Using data gathered by the U.S. Census Bureau and the Bureau of Labor Statistics (BLS), the following study focused on U.S. metropolitan areas with populations of less than 1 million residents<\/strong> and scored them across six indicators, including:<\/p>\n For more details about how these metrics are defined, as well as a list of all our data sources for this study, visit the methodology section<\/a>.<\/p>\n The top spots across the six indicators were distributed fairly evenly between the 15 entries that made the shortlist.<\/p>\n Boulder, Colo.<\/a>,<\/strong> garnered the highest score overall, landing in the first position for its number of tech establishments per 100,000 residents. It also made the podium across three other metrics, totaling 79.12 points.<\/p>\n Tech workers in the Bridgeport-Stamford<\/a>-Norwalk, Conn., <\/strong>area enjoyed the highest average salary among the 15 entries, at $106,591 per year. The 943,332-strong metropolitan area also had a good concentration of leisure establishments and ranked 12th<\/sup> for tech density.<\/p>\n Midwestern tandems dominated a couple of indicators: The Madison, Wisc.<\/a>,<\/strong> and Ann Arbor, Mich.<\/a>,<\/strong> duo occupied first and second place for the highest percentage of population covered by health insurance, while the life quality index was topped by Bloomington, Ill.<\/a>,<\/strong> and Madison.<\/p>\n On the East Coast, the California-Lexington Park, Md., <\/strong>area took the lead in the tech job density rankings, while the Portland<\/a>-South Portland, Maine, <\/strong>metro received the highest score for its share of leisure establishments.<\/p>\n\n
Midwestern Metros Take Top 3 for Life Quality, Tech Job Density & Health Insurance Coverage<\/h2>\n
 <\/p>\n\n\n
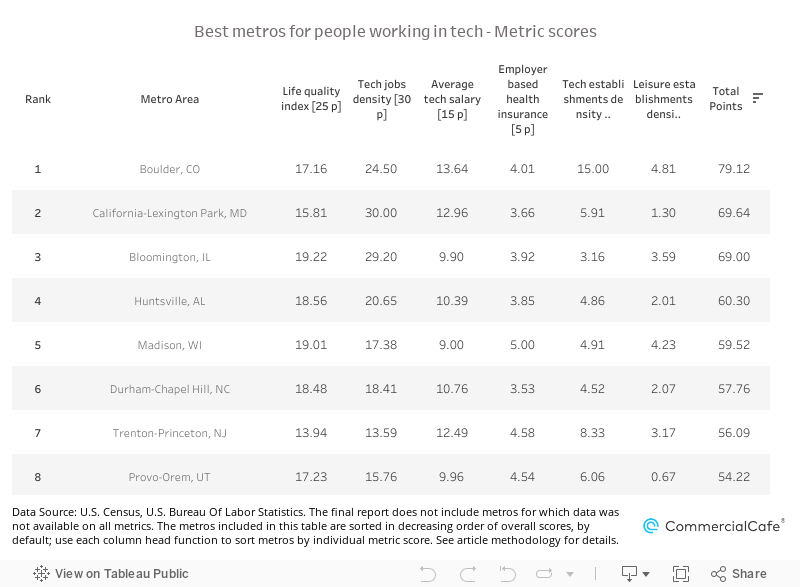