Key Takeaways:<\/h2>\nLarge Metros<\/h4>\n\n- San Jose, CA,<\/strong> topped the list, boasting the highest-paid and most educated Millennial workforce.<\/li>\n
- Austin, TX,<\/strong> claimed the #2 spot with the highest percentage of Millennials in its total population (25.4%) in our study.<\/li>\n
- Salt Lake City, Nashville, TN,<\/strong> and Kansas City, MO,<\/strong> each combined low costs of living with strong job markets for their Millennials.<\/li>\n
- The top six large metros for Millennials were located in the West and the Southwest.<\/li>\n<\/ul>\n
Midsized Metros<\/h4>\n\n- Des Moines, IA,<\/strong> earned the title of best midsized metro for Millennials, thanks to the growth and overall percentage of the age cohort in its total population.<\/li>\n
- Madison, WI,<\/strong> seized the #2 overall ranking with great showings for its educational attainment, health coverage and unemployment rate.<\/li>\n
- The top five midsized metros for Millennials were in the Midwest and the West.<\/li>\n<\/ul>\n
Best Large Metros for Millennials: San Jose, Austin & San Francisco Stand Out as Millennial Hotspots<\/h2>\n
When it comes to attracting some of the most talented professionals across various industries, the pull of San Jose and San Francisco remains unrivaled. Nevertheless, a host of other metro areas across the country \u2014 such as Kansas City; Salt Lake City; or Denver \u2014 have also become strong contenders, aided by relative affordability when compared to their coastal counterparts, as well as rich local culture and recreational opportunities.<\/p>\n
\n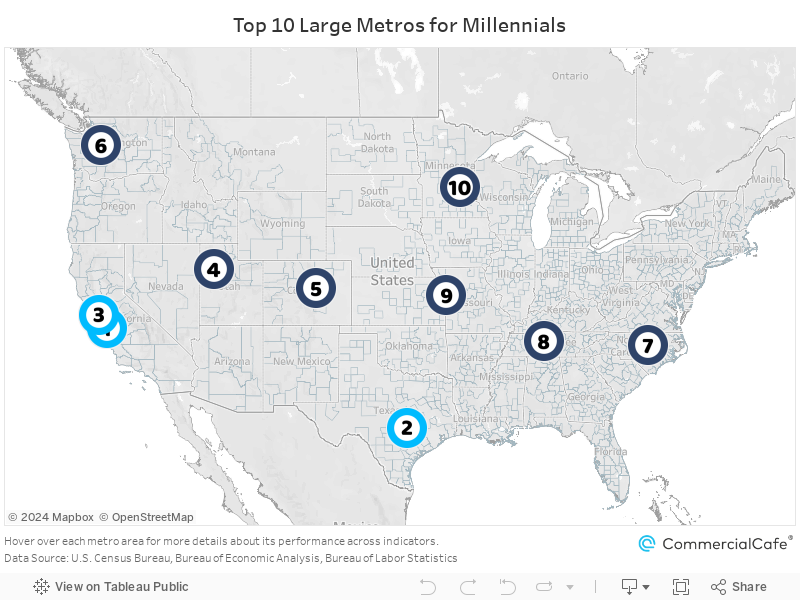
- \n
- San Jose, CA,<\/strong> topped the list, boasting the highest-paid and most educated Millennial workforce.<\/li>\n
- Austin, TX,<\/strong> claimed the #2 spot with the highest percentage of Millennials in its total population (25.4%) in our study.<\/li>\n
- Salt Lake City, Nashville, TN,<\/strong> and Kansas City, MO,<\/strong> each combined low costs of living with strong job markets for their Millennials.<\/li>\n
- The top six large metros for Millennials were located in the West and the Southwest.<\/li>\n<\/ul>\n
Midsized Metros<\/h4>\n
- \n
- Des Moines, IA,<\/strong> earned the title of best midsized metro for Millennials, thanks to the growth and overall percentage of the age cohort in its total population.<\/li>\n
- Madison, WI,<\/strong> seized the #2 overall ranking with great showings for its educational attainment, health coverage and unemployment rate.<\/li>\n
- The top five midsized metros for Millennials were in the Midwest and the West.<\/li>\n<\/ul>\n
Best Large Metros for Millennials: San Jose, Austin & San Francisco Stand Out as Millennial Hotspots<\/h2>\n
When it comes to attracting some of the most talented professionals across various industries, the pull of San Jose and San Francisco remains unrivaled. Nevertheless, a host of other metro areas across the country \u2014 such as Kansas City; Salt Lake City; or Denver \u2014 have also become strong contenders, aided by relative affordability when compared to their coastal counterparts, as well as rich local culture and recreational opportunities.<\/p>\n
\n - Madison, WI,<\/strong> seized the #2 overall ranking with great showings for its educational attainment, health coverage and unemployment rate.<\/li>\n
- Austin, TX,<\/strong> claimed the #2 spot with the highest percentage of Millennials in its total population (25.4%) in our study.<\/li>\n