


The pragmatism that Gen Zers have adopted to survive economic uncertainty shows up directly in how they weigh a city. Specifically, nearly half name the high cost of living as the single-biggest barrier to their financial success, which puts pressure on where they can afford to start out. That pressure is compounded by a job market that’s far less receptive to new graduates than it used to be, and it’s here that location can actually move the needle.
For a city, supporting a generation that expects life’s milestones later than past generations did and that values balance over career advancement comes down to a rough framework — namely, affordability, firms and industries that can support entry-level openings, in addition to lifestyle features, like green space and functional, affordable transit. Cities that can check those boxes are best-prepared to hold onto a generation just starting its working life.
With that in mind, as we do annually, we evaluated every U.S. city with a population above 400,000 where data was available across nine metrics, scoring each out of 100. Categories include:
Community — the share of Gen Z residents
Economic — the share of employment in occupations suited to recent graduates, meaning roles requiring a degree or vocational training, but no more than four years of experience, as well as the unemployment rate among young adults
Affordability — a composite cost-of-living index, plus the cost of unlimited broadband at 60 Mbps or higher
Education — the share of Gen Zers enrolled in some form of education
Fun & Green — recreational and dining establishments, from performing arts and museums to bars and restaurants; parks per 10,000 residents; and how much of commuting is made via public transportation, walking or cycling.
Following our national ranking, we also break down the best large cities by region.
Raleigh, N.C, is Top City for Gen Z, Ending Atlanta & Minneapolis’ 4-Year Run
This year brought a four-city photo finish with Raleigh, N.C.; Minneapolis; Atlanta; and Tucson, Ariz., all separated by a single point. Historically, no other city other than Atlanta or Minneapolis had topped our annual ranking, going back as far as 2022.
Overall, Raleigh’s win came as it topped just one of the nine metrics outright (internet cost), but finished inside the top 10 on four more.
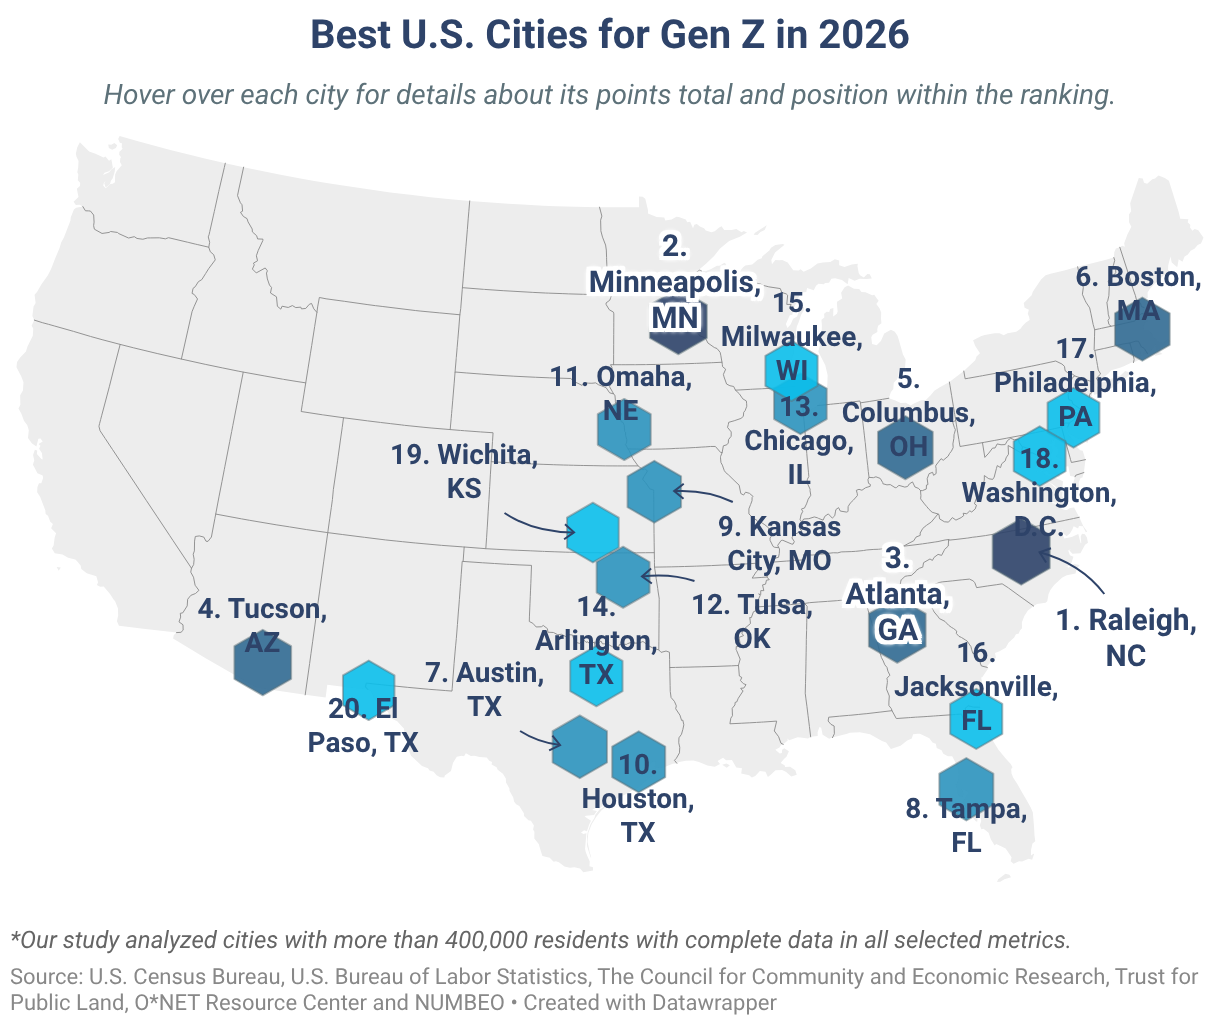
#1 – Raleigh, N.C.
When it comes to Gen Z appeal, Raleigh stacks up as one of the best places to live for the student-to-career transition. That’s pertinent for a generation, many of whom have recently made, or are about to make, that life leap. To that end, Gen Z students enrolled at North Carolina State University or Wake Technical Community College (the largest community college in the state) can find entry-level opportunities in education itself, health care or life sciences across the Triangle without leaving town. The city ranked in the top 10 on two fronts — fifth-best for jobs suited to recent graduates, as well as one of the highest shares of Gen Z still in school with 46.4% enrolled.
It makes sense, then, that Raleigh has the third-highest share of young adults among its total population with the age group making up 9.7% of its roughly 500,000 residents. But, where Oak City adds to its appeal for the generation is how it pairs that opportunity with affordability. Living costs run around 5.3% below the national average and are among the top five cities for entry-level job share. Plus, internet costs are the lowest of any city in the study at around $63 a month. So, while other cities can point to a strong pipeline from student to career start, few can offer what Raleigh does — courtesy of the Triangle — without the cost tax that usually comes with it.
#2 – Minneapolis, MN
Last year’s best large city for Gen Z, Minneapolis claimed second place this year by less than one point. Notably, the city has secured either first or second place in each of our rankings in the last five years. This year, it continues to hold one of the highest concentrations of young adults, ranking fourth among all cities with more than 9% of its population being young adults. It also boasts the third-highest school enrollment for that demographic with 54.2% attending one of the city’s large colleges, like the University of Minnesota (U of M).
That student and general young adult concentration links nicely with attractive lifestyle factors: The U of M is located just across the river from downtown, and the city boasts a park system that has seven city parks per 10,000 residents. Living costs also run 8% below the national mark. But, if there were one area where Minneapolis lost the slightest ground to Raleigh, it would be how the share of jobs suited to entry-level graduates was slightly lower at 29.8%. At the same time, it was ahead, comparatively, on green-commuting usage and recreational establishments.
#3 – Atlanta
Atlanta has the most education-enrolled young adult population in the study. More precisely, almost 60% of Gen Zers are at one of the city’s schools or universities, per the latest Census data. This helped the city move above the likes of Boston and Minneapolis on this particular measure since last year’s ranking. In Atlanta, Georgia Tech, Georgia State, Emory and the Atlanta University Center are behind the high student share.
The age group also makes up more than 8% of the city’s total population — a top-five share — with the added benefit of centrally located campuses, so there’s daily proximity to a bustling city, but one that also includes plenty of green space. Additionally, Atlanta was the third-best city in our ranking for access to parks with 10 parks per 10,000 residents. In fact, several of the largest parks, including Piedmont and Woodruff, are next to the city’s campuses. Lastly, and beyond the classroom, the city has among the lowest unemployment rates for young adults in the study at 6.4% for Gen Z that have or are about to enter the job market. Meanwhile, for all involved, living costs sit more than 5% cheaper than average.
#4 – Tucson, Ariz.
Tucson has the highest Gen Z share of any city with 11.7% of its population. What’s more, no city has topped Tucson on that measure across five straight editions of this ranking. The University of Arizona, home to more than 43,000 undergrads, accounts for a strong portion of that age group share with around 47% of Tucson’s Gen Zers enrolled in a form of education — the eighth-highest share in the study. But, that also shows that many young adults here aren’t students, which means there’s more to the local young adult population than Wildcats.
Still, Tucson does feature a compact college town feel at the neighborhood level, as well as one that equates to areas next to the University that are ideal for walking. And, for the adventurous or outdoor enthusiasts, the Sonoran Desert and Saguaro National Park flank the city on either side. Tucson also brings culinary credentials to the table as an official UNESCO City of Gastronomy. On the cost-of-living front, prices across goods, services, and housing roughly match the U.S. norm.
#5 – Columbus
A persistent presence near the top of our annual Gen Z ranking, Columbus has never finished outside of the top 10. That all-rounder tag is one that Columbus earns once again this year. In fact, it could be argued that “C-bus” is the most consistent city in the entire study this year.
Here, youth unemployment of 6.4% tied for sixth-lowest; young adults make up 7.8% of the population; and the city posts top-15 finishes for internet cost, park density and affordability with living costs about 7% cheaper than average. Even its lowest result, green commuting (24th among all cities), is an area that the city is tackling. In 2024, voters approved a sales tax anticipated to raise $6 billion for transit work through 2050. The plan funds five bus rapid-transit corridors; a 45% service increase; and around 500 miles of sidewalks, bike lanes and trails. Service is already up 8.5%, and an upcoming line will connect The Ohio State University to downtown.
#6 – Boston
Boston is another consummate Gen Z entry in our yearly study, although it’s one that stands out as being rather “polarized,” or at least one that has its high points and a cost-of-living consideration. For instance, it finished #1 for parks per resident and #2 for four more — graduate-suitable jobs at 32.5%, school enrollment at 57.1%, Gen Z share at 10.5% and green commuting at 42.7%. That’s five top-two results, yet it didn’t climb higher than sixth overall (albeit, an excellent result). That’s because living costs in Boston run nearly 50% above the national average — the fifth-highest among all large cities we looked at. Even so, Boston was the only high-cost coastal market to break into the top 10.
Still, there are more factors to weigh against those living costs. Namely, green commuting means Gen Zers can skip car ownership, which is a plus for how to afford life here. Meanwhile, in a city where two-thirds of households are renting, being flexible and ready to rely on multi-roommate living arrangements can also help you make it work.
#7 – Austin
While the University of Texas at Austin does give the city a major collegiate footprint, students account for only 34% of Austin’s Gen Z population. That means the majority in this age bracket are likely to be active participants in an attractive entry-level market: Austin recorded unemployment of 4.8% — the second-lowest in our study — and finished ninth for graduate-friendly jobs at 31.1%. In this case, corporate tech moves and the talent inflows that followed have become synonymous with the city’s growth. That said, tech is far from the only game in town: Office administration, management, sales, food service and finance all employ more people. Ultimately, the draw to relocate remains strong — the famous Austin vibe, connected to its youthful population, plus the nature, breweries and live music heritage.
#8 – Tampa, Fla.
In Tampa, lifestyle and career starts have the potential to work hand in hand. Granted, the way of life speaks for itself with the Gulf Coast, warm weather, and beaches (St. Pete Beach and Clearwater are just across the bay). Meanwhile, graduate hiring is sixth-best in the study with nearly one-third (31.4%) of metro jobs being accessible to recent graduates. Moreover, Tampa is a growing destination for young people with Generation Z climbing as a share — now at 8.2% of the city’s total population and seventh in our ranking — an increase on the 7.5% in last year’s study. Finance, fintech, health care, and tech are all part of an expanding job market with health care being the single-largest source of openings thanks to Moffitt Cancer Center, Tampa General and BayCare.
# 9 – Kansas City, Mo.
Already the third Midwest entry in the ranking, Kansas City had the study’s fewest young adults out of work. It’s also one of the cheapest places to start out with living costs about 11% below the U.S. norm. Parks are plentiful, too, at around nine per 10,000 residents, and the city has a culture that punches above its size with iconic barbecue, a deep jazz heritage and First Fridays in the Crossroads. Even so, the city has a smaller student body concentration of Gen Z as only 30.3% of young adults are enrolled in education, which means it’s less of a student location and more so one that stands out for the low unemployment of young adults with one of the better shares (30.9%) among Midwest cities of jobs accessible for graduates.
# 10 – Houston
Houston holds the second-highest count of recreational venues (6,922) of any city in the study by offering a rich selection of things to do paired with a manageable, Sunbelt cost of living. And, as one of the most ethnically diverse cities in the country with more than 145 languages spoken, the culinary scene that comes with that is well-recognized.
However, for job-seekers, the young adult unemployment rate remains relatively high at more than 10%. Still, while traditional energy firms have pulled back on new hiring in recent years, the local economy has diversified. Now, emerging sectors — like clean energy, health care with the Texas Medical Center and aerospace around NASA’s Johnson Space Center — offer strong alternative paths for specialized talent.
Midwest is Nation’s Most Consistent Region for Gen Z With 7 of 9 Cities in Top 20
The Midwest may have had only nine cities that qualified as large enough (above 400,000 population) for our study, but seven of those finished in the top 20, which makes for quite the hit rate. Plus, with Indianapolis just outside at #22 overall, the median national rank for Midwestern cities was 13 — better than the median of the next-best region, the Northeast, at 17.
As covered earlier, Minneapolis, Columbus, and Kansas City featured in the overall national top 10.
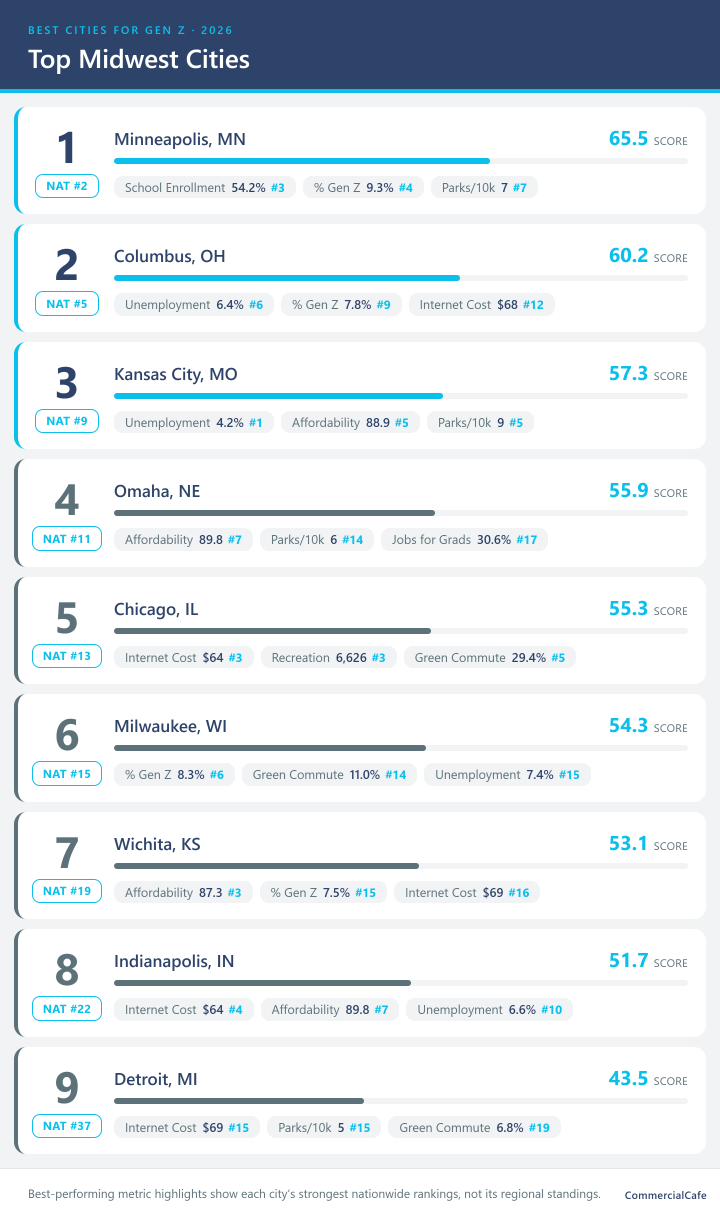
Other than Minneapolis; Columbus, Ohio; and Kansas City, Mo., that ranked in the top 10, Omaha, Neb., was as close to joining them as possible. The Nebraska entry ranked 11th nationally thanks to living costs that were among the most affordable we analyzed — some 10% below the national average. As we will see in other Midwest entries, affordability is one of the region’s strongest selling points for Gen Z.
For comparison, in Chicago, the 13th-best city overall, it’s a plenitude of available recreational and cultural that was the highest in the region with more than 6,600 bars, restaurants, and museums. Plus, that count was the third-most in the entire study, which makes sense given it’s the third-largest city in the country. Like other large metropolises, green commuting is a necessity here and most common in the region with around 30% of all commutes made without a car. Lastly, and perhaps a surprise, the Windy City has the lowest internet costs in the Midwest.
To the north, Milwaukee comes in at #15 with an 8.3% Gen Z population — one of the highest shares in the study. Within the Midwest, only Minneapolis boasted a higher concentration.
Meanwhile, the affordable living costs show up best in the Great Plains with Wichita, Kan., (19th overall) notching the lowest living costs in the region (almost 13% cheaper than average) as the city made its first appearance in our large-city ranking after being featured in the mid-sized city (sub-400,000 population) ranking last year. Just outside of the top 20, Indianapolis (#22) has the Midwest’s second-lowest internet costs, in addition to living costs around 10% below average.
South Places 10 Cities in Top 20 & Half in National Top 10
The South had the most cities in the study with 20 entries. And, just as it did in our Gen Z ranking last year, the region made up half of the top 10 overall entries: Raleigh, N.C.; Atlanta; Austin, Texas; Tampa, Fla.; and Houston all made the upper echelon.
Where the stand-out change occurred compared to last year was how the area’s previous leader, Atlanta, was toppled by Raleigh, N.C., as the best city for Gen Z this year.
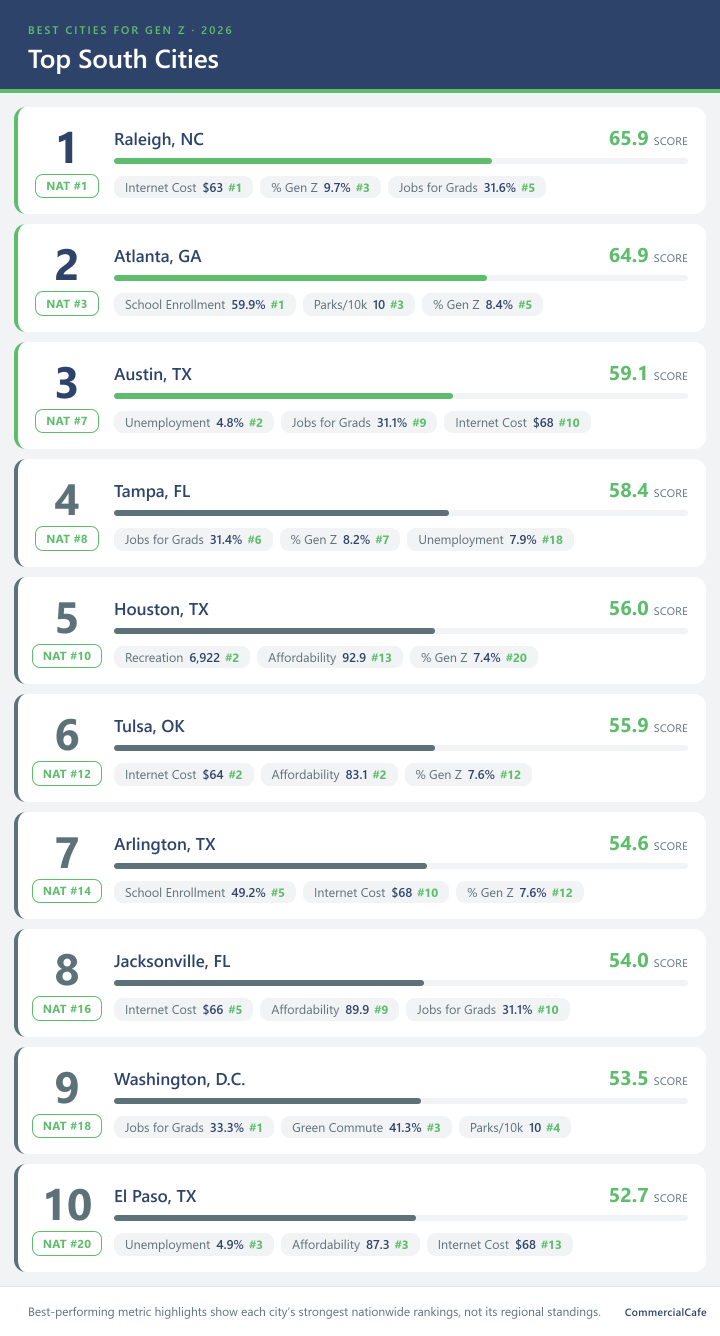
Just below those that made the top 10 nationally was Tulsa, Okla. Arguably the best value among all cities, it combines the region’s (and nation’s) second-lowest average internet prices with the second-best living costs. Then, at #14, Arlington, Texas, was runner-up for school enrollment in the South, a nod to the University of Texas at Arlington (UTA), while Jacksonville, Fla., (#16) claimed the third-most affordable internet costs for the region.
At #18, Washington, D.C.’s results across the Gen Z metrics might land as slightly paradoxical. For example, the city leads the study for graduate-friendly jobs at 33.3%, above Boston nationally and more than Raleigh, N.C., in the South. It also has excellent access to parks (second-best in the South) and is best in the region for green commuting.
That said, where the nation’s capital city lost ground was for recording the South’s largest young adult unemployment rate. That means that, while a high share of the job market is suitable to graduates at the entry level, it’s also fiercely competitive. Of course, that’s been exacerbated as federal employment across the wider metro area has fallen to the lowest level in three decades.
Otherwise, Texas alone had seven cities in the ranking, easily the most for the region (Florida was next with three). Lone Star State entries included El Paso, Texas, (#20), which snuck inside the top 20 overall. Here, young adult unemployment was the South’s second-lowest overall at 4.9%, basically on par with Austin, Texas (4.8%).
Additionally, two cities are worth singling out despite finishing outside of the top 20: Oklahoma City (#29) has the lowest cost of living of any large city in the country at almost 19% below the national average, whereas Miami (#30) has more than 4,000 bars, restaurants and venues. The latter is a significant highlight when we consider its population of 487,000, which is lower than any city with at least 4,000 such establishments.
Tucson, Ariz., Breaks Into Top 10 Nationally as Sole Western Entry in Top 20
Tucson, Ariz., at #4 overall gave the West an entry inside the top 10 national ranking. That’s especially notable because Tucson came in 16th last year.
The West also had the second-highest number of cities in the study with 16 cities. Granted, most of those landed in the bottom half of the ranking, hampered by higher living costs.
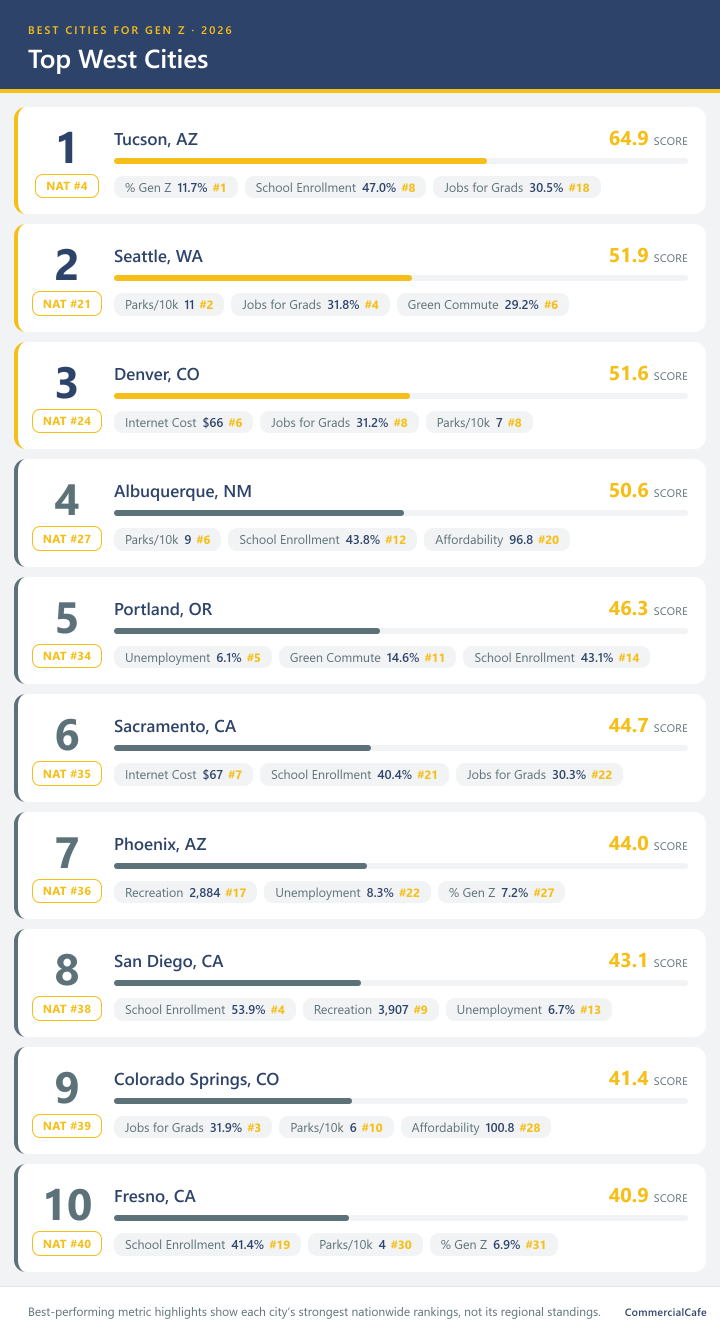
Seattle, in the runner-up spot among cities from the West, went closest to joining Tucson in the national top 20, finishing at #21 nationally.
Seattle certainly has specific areas that appeal to Gen Z. Specifically, the Emerald City has the best park access in the West (second nationally) with 11 parks per 10,000 residents. It also finished second in the West for graduate-friendly jobs, green commuting, and share of young adults.
Not to be outdone, Denver (at #24 nationally) was third in the West. The Colorado entry’s best metrics were for share of graduate jobs and ratio of parks per 10,000 residents, in addition to internet costs that are among the lowest in the region.
Directly south from the Mile High City, Albuquerque, N.M., (#27) features a high density of parks (nine per 10,000 residents) and is one of just two Western cities (the other being Las Vegas) to offer below-average living costs.
To that end, two other cities also topped the region for a specific metric: No Western city has fewer young adults out of work than Portland, Ore., whereas San Diego (#38) is home to the region’s best school enrollment with 53.9%.
As you might expect, entertainment and cultural excursions are most easily available (in terms of volume) in Los Angeles and Las Vegas. LA has 6,292 such venues versus 4,508 in Las Vegas. But, bear in mind that Las Vegas packs in a punch of entertainment given that LA’s population is 5.7 times larger. Las Vegas was also the most affordable in the region.
3 Cities, 3 National Titles: Boston & New York Lead Northeast
The Northeast presented just three cities above the 400,000-resident mark for the fewest of any region. Two cities made the top 20 overall with Boston coming in at #6 and Philadelphia at #17.
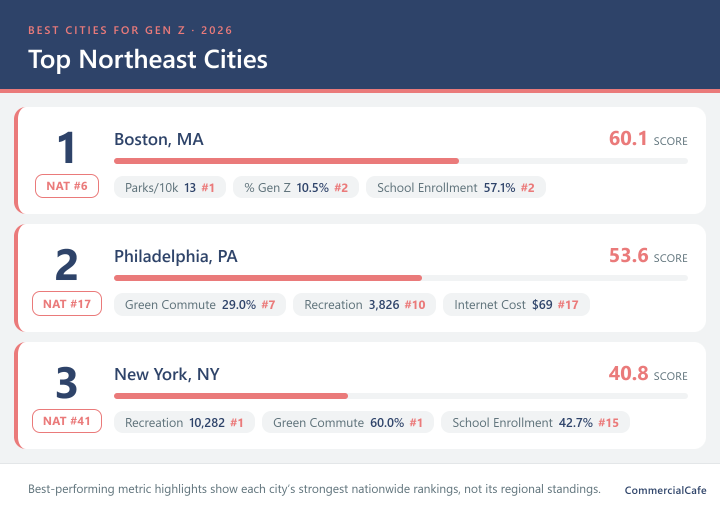
Even so, what’s bullish for the Northeast is how, with just three cities, the region collectively managed to occupy the top spot in three of the nine metrics nationally: Boston (#6) posted the highest parks per resident ratio in the study. New York City, #41, claimed the study’s most recreational venues at more than 10,000 and is best for green commuting at 60%, as expected. Notably, New York City and Boston (even at sixth overall) would have finished much higher had it not been for their costs of living — some of the highest in the nation. Finally, Philadelphia was more affordable, comparatively, with living costs at 7% above the national rate, as opposed to New York City’s nearly 79%.
Methodology
We ranked the largest U.S. cities with more than 400,000 residents where data was available for all metrics. Metrics were selected based on their potential to provide Gen Zers with career opportunities and quality of life, while the population cutoff was chosen to result in a selection of mid- to large-sized cities with ample opportunities for education, employment and entertainment. Metrics were then assigned a weight based on their importance in determining the overall attractiveness of a city for Gen Zers. The base categories, underlying metrics and their weights in the final score were as follows:
Gen Z Economic Indicators:
- Cost of Living – The composite index showing cost of living, which is expressed as a number higher or lower than 100. Numbers higher than 100 represent living costs above the national averages, while numbers below 100 represent living costs below the national average (25% of the total index). Source: C2ER Cost of Living Report 2025.
- Jobs for Recent Graduates – Share of employed population currently working in a job requiring a bachelor’s degree, associate’s degree, or vocational training, as well as a considerable amount of work-related skill and knowledge, but no more than four years’ experience (15% of the total index). Source: BLS 2025. Because data for this metric is only available at a metro level, it was mapped to each city based on the metro that it’s part of.
- One-year unemployment rate within the local population aged 20 to 24 years old in 2024 (5% of the total index). Source: U.S. Census Bureau.
Share of Gen Z Residents: The percentage of the population aged 20 to 24 in each city in 2024 (15% of the total index). The U.S. Census Bureau provides population data in age groups spanning five years each. The age range was chosen to be illustrative of a city’s population of adult Generation Z members as a community while not overlapping with other age groups. Source: U.S. Census Bureau.
Gen Z Educational Enrollment: The percentage of the population aged 20 to 24 enrolled in a form of education as of 2024 (10% of the total index). Source: U.S. Census Bureau.
Internet Cost: The price of internet with connection speeds of at least 60 Mbps by city (10% of the total index). Source: Numbeo.
Things to Do: The number of establishments for recreation, arts and sports, including performing arts; spectator sports; museums; historical sites; amusement parks and arcades; other amusement and recreation; drinking places (bars); restaurants; and other places to eat (10% of the total index). Source: Census Business Patterns 2023 of the U.S. Census Bureau. Data for this indicator is available at a zip-code level. The number of establishments within a city is the sum of the establishments in all of its associated zip codes.
Green Category:
- Green Commuting – The combined percentage of public transportation, walking and cycling as a means to travel to work for each city in 2024 (5% of the total index). Source: U.S. Census Bureau.
- Number of parks per 10,000 residents (5% of the total index). Source: TPL 2026 park data. For Charlotte, N.C., and Honolulu, we took park figures from TPL City Park Facts because they weren’t in the 2026 ParkServe dataset.



Matthew Preston
Content Writer, CRE News & Market Analysis
Matthew has covered commercial real estate for CommercialCafe since 2022. He focuses on the office and industrial sectors, reporting on leasing, development, and investment across national markets and individual submarkets. His work draws on data and original research. He also writes about demographic shifts and urban innovation in U.S. cities. The New York Times, The Real Deal, Bisnow, The Business Journals, and Yahoo Finance have cited his reporting.