Top 30 Mid-Sized Cities in America for Green Commuting: Honolulu, Madison & Pittsburgh Lead the Way


Key Takeaways:
- Honolulu topped the list due to high rankings in green commuting metrics, like the rates of carpooling, cycling and walking.
- Madison, Wis., secured the #2 spot with a strong emphasis on cycling, supported by dedicated bike infrastructure and sustainability initiatives.
- Pittsburgh claimed #3 due to a focus on walkability, showcasing its transformation from an industrial hub to a sustainable city.
- Jersey City, N.J., landed at #4, benefiting from its proximity to New York City, as well as its robust public transit infrastructure and commitment to reducing car dependency.
As many workers return to their daily commutes, the quest for sustainable transportation options looms large. But, while bigger cities often take center stage for their eco-friendly commuting initiatives, mid-sized cities are quietly revolutionizing the transportation landscape. In fact, these smaller, yet more nimble urban centers are demonstrating that green commuting is not just an abstract aspiration, but also an achievable reality — even without the vast resources of their larger counterparts.
Recognizing the influence of city size on commuting patterns, we opted to conduct a focused analysis, and narrowed our scope to those with populations ranging from 220,000 to 500,000 residents. We then evaluated key indicators like public transportation ridership, pedestrian and bicycle commuting rates, carpooling champions, electric vehicle charging infrastructure, and green amenities’ abundance, to identify the frontrunners in sustainable commuting.
Here’s the top 30 cities that emerged from our analysis. For a more in-depth examination of the top 10, continue reading.
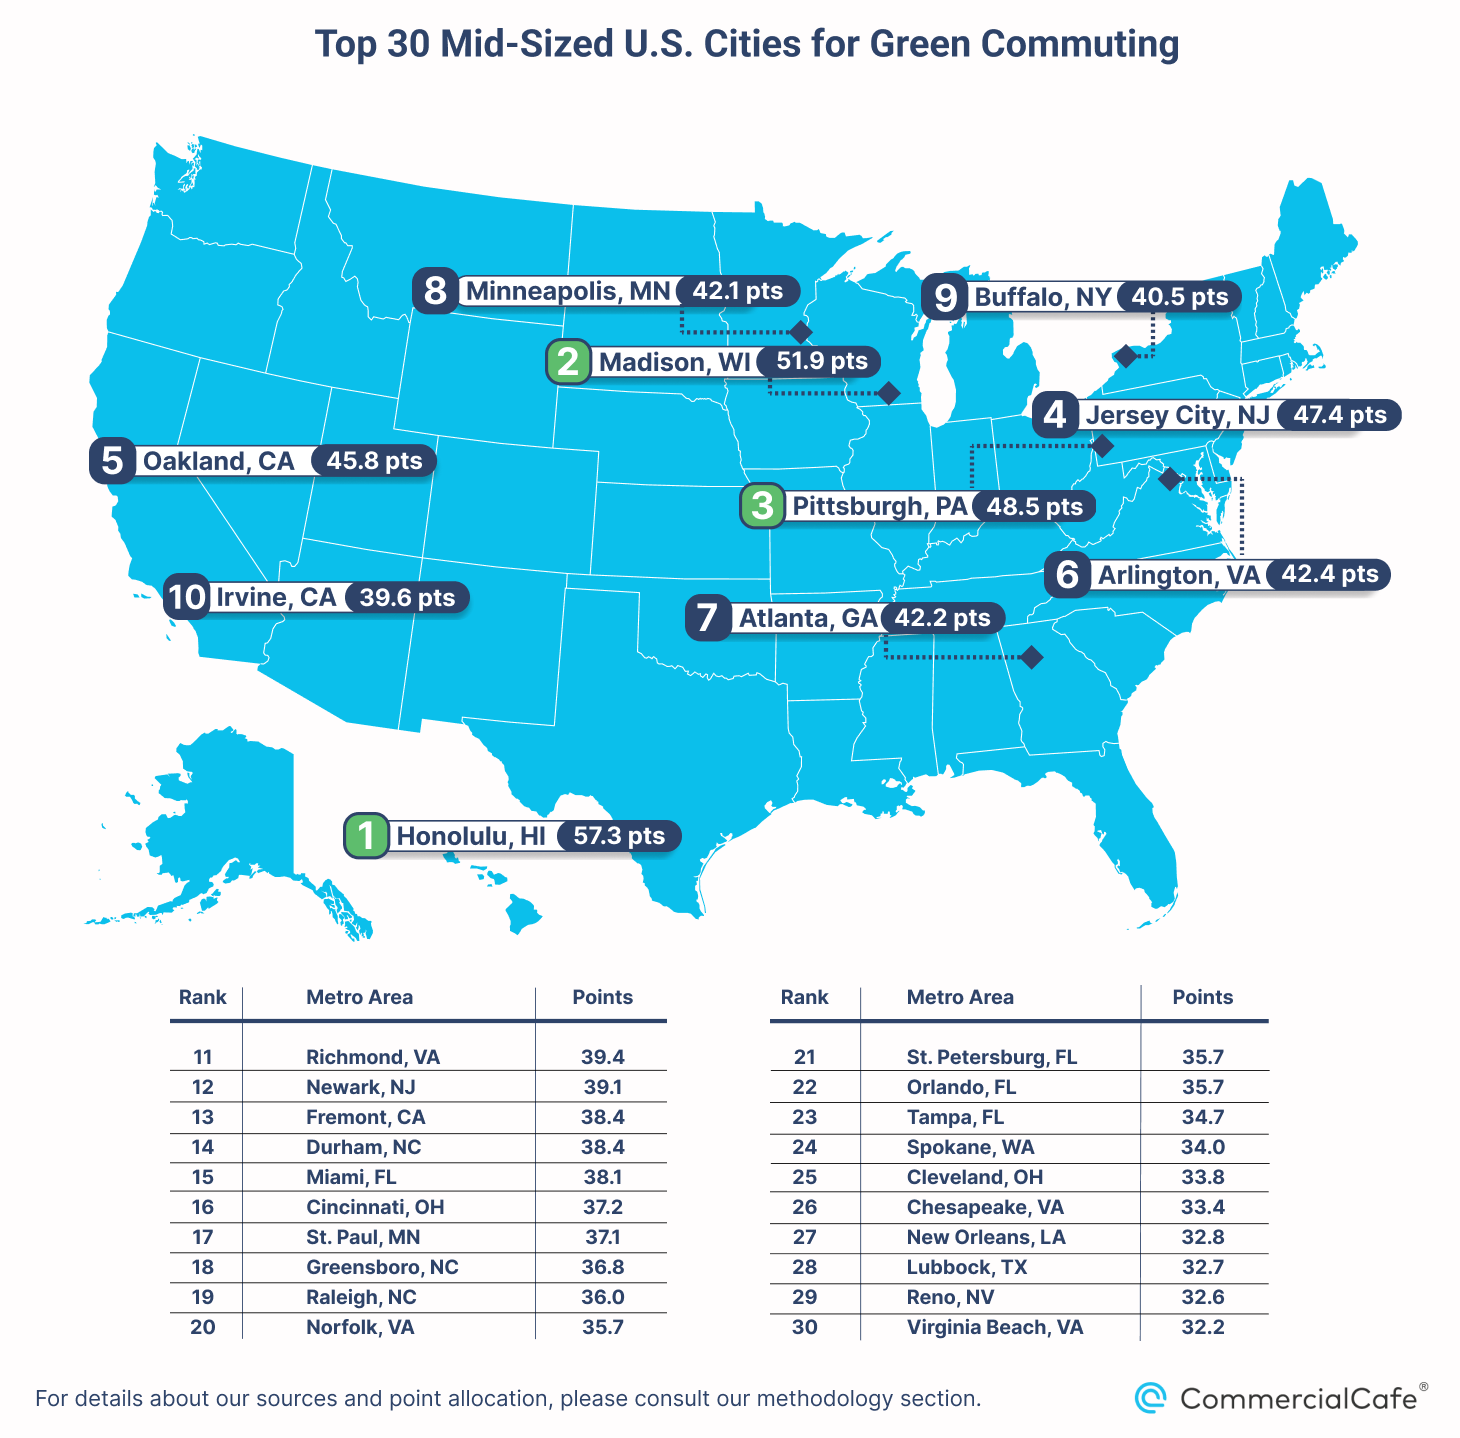
1. Honolulu – Total Points: 57.3
Honolulu earned the title of best city for green commuting by topping the overall ranking with a score of 57 points. Specifically, the Hawaii capital outshined the rest of the competition by securing top-five placements for carpooling — where it garnered the highest score — along with walking and biking.
Moreover, with a top-10 finish in public transit use, it’s noteworthy that mid-sized cities such as Honolulu are expanding their infrastructure — often with help from the Bipartisan Infrastructure Bill. For example, Honolulu recently opened the first phase of its skyline passenger rail project that’s slated to transport approximately 84,000 passengers daily — nearly one-quarter of the city’s population of 345,000. Furthermore, the city secured a $20 million grant from the Federal Transit Administration (FTA) to purchase new electric buses, pushing Honolulu closer to its goal of an all-electric bus fleet by 2040.
2. Madison, Wis. – Total Points: 51.9
Given its reputation as a biking haven, it’s no wonder that Madison topped the list of cities with the highest percentage of cyclist commuters. While 2.6% may seem like a modest number, it’s a significant leap from the national average of just 0.5%. And, thanks to an extensive network of bike lanes and cyclist-friendly policies, the city has transformed into a cyclist’s paradise.
Similarly, Madison ranked third for walking commuters, indicating a strong local preference for car-free living and a welcoming environment for alternative transportation options overall. This dedication to sustainability was further reflected in the city’s second-highest ranking in terms of parks per capita, which showcases the interest of the city in its environment well-being, as well as promotes active, healthy habits for its residents.
3. Pittsburgh – Total Points: 48.5
Once known for its industrial heritage, Pittsburgh is adopting a greener future and embracing eco-conscious commuting practices. This transformation was evident in the city’s performances, including the highest percentage of walkers among workers in the study with an impressive 11%. Plus, this feat was further complemented by Pittsburgh’s robust public transportation system, which ranked fifth among the top 30 cities in ridership. Likewise, the city’s diverse and sustainable commuting options were also enriched by its share of commuting cyclists.
In support of this growing trend away from car dependency, Pittsburgh recently secured a $150 million construction grant from the FTA for the bus rapid transit line. This initiative aims to provide fast and convenient transit along the congested corridor connecting downtown Pittsburgh to Oakland. However, the city isn’t short on green spaces, either, as evidenced by its fourth-place ranking for parks per capita.
4. Jersey City, N.Y. – Total Points: 47.4
Situated alongside New York City and seamlessly integrated into the region’s expansive transportation network, Jersey City presents its workforce with a diverse array of transit commuting choices. Therefore, it was no surprise that with more than 35% of commuters opting for public transportation, the city easily surpassed all others in terms of commuter transit ridership.
Notably, Jersey City has taken a multifaceted approach to promoting green commuting by investing in the creation of car-free plazas — like the Newark Avenue Pedestrian Plaza to encourage walking — and expanding bike lanes to enhance cycling options. Furthermore, Jersey City’s carpooling rate stood at 14% (the third-highest among the top 30 cities), which demonstrates a collective effort to reduce traffic congestion in this densely populated urban landscape.
5. Oakland, Calif. – Total Points: 45.8
On the West Coast, Oakland stood out in carpooling, car-free commuting and cycling. In particular, the city’s impressive 15% carpooling rate, which tied for second in the study, was bolstered by the Bay Area’s comprehensive high-occupancy vehicle (HOV) lane network.
At the same time, Oakland’s commitment to car-free commuting was also evident in its fourth-place ranking for transit ridership: Here, Mass Transit Oakland and the Bay Area Rapid Transit System provide seamless connections for commuters across the Bay Area, making Oakland one of only four cities in the study to attract more than 10% of commuters to public transportation.
Otherwise, for those seeking an even greener commute option, Oakland’s cycling scene offers a viable alternative. Accordingly, the city ranked fourth in cycling commuters, making it an ideal location for those who enjoy outdoor activities and embrace the opportunity to pedal to work.
6. Arlington, Va. – Total Points: 42.5
Ranking sixth among the top 30 cities, Arlington achieved a third-place finish in public transit ridership with more than 12% of workers opting for public transportation. Similar to Jersey City, commuters here benefit from their integration into one of the nation’s largest transit hubs — Washington, D.C.’s Metro system. The city boasts 11 metro stations offering convenient connections to the Orange, Silver, Blue and Yellow lines. Meanwhile, for those residing beyond the reach of the subway, an extensive bus network provides a reliable alternative, ensuring access to various parts of the city.
To further enhance the public transit experience, Arlington has also implemented strategic initiatives designed to encourage public transportation usage. One such initiative is the provision of complimentary transfers for rail riders transitioning from Metro to bus within a two-hour window. Conversely, compared to all of the other cities in the top 10, Arlington had a lower share of commuters who chose walking or biking as methods of traveling to work.
7. Atlanta – Total Points: 42.2
Atlanta has developed into a leading innovator in sustainable transportation, including making significant strides in embracing electric vehicle technology. More precisely, the city boasted the second-highest number of EV charging stations per capita, which creates an attractive environment for both existing EV owners and those considering making the switch to eco-friendly transportation.
Beyond its robust EV infrastructure, Atlanta is also actively pursuing strategies to enhance mobility and safety for all commuters. Despite a slight lag in walk and bike commute percentages compared to other top-ranked cities, Atlanta’s widespread tree canopy cover and easy access to parks make for an invigorating outdoor commuting experience for those who opt for non-motorized options — a trend that’s prevalent among many Southern cities in the top 30. The city is also exploring ways to improve public transportation ridership and overall transportation infrastructure.
8. Minneapolis – Total Points: 42.1
With its extensive network of bike lanes, Minneapolis has transformed into a cycling paradise, sharing the runner-up spot for cycling commuters with Honolulu. In this case, the city’s proactive approach to promoting cycling has included lowering speed limits and redesigning streets to prioritize bicyclists. And, although the recent closure of Nice Ride — the city’s bike-sharing program — dealt a blow to the cycling movement, the future remains bright. That’s because Minneapolis currently boasts 21 miles of protected bike lanes on city streets and has set a goal to expand this by 141 miles by 2030.
Clearly, Minneapolis does well in public transportation as it ranked among the top 10 cities for ridership with 6.7% of commuters choosing this mode. That said, the twin city also boasted a high percentage of walkers, thereby showcasing its dedication to pedestrian-friendly infrastructure and active lifestyles.
9. Buffalo, N.Y. – Total Points: 40.5
Emerging as an all-rounder in terms of sustainable commuting, Buffalo excelled across public transit ridership, park accessibility, air quality and carbon emissions. Namely, with 9.3% of commuters utilizing public transportation to get to work, Buffalo stood alongside Pittsburgh as a top-six city in that category. However, it was Buffalo’s air quality that elevated its overall ranking as the city had the fifth-best air in the ranking alongside Spokane, Wash. Additionally, Buffalo’s estimated low carbon emissions (ranking third in our analysis) further underscored the city’s commitment to green commuting practices.
While Buffalo’s public transportation ridership is commendable, there’s nevertheless a clear opportunity to expand its reach and make it an even more attractive option for commuters. Recognizing this need, the Niagara Frontier Transport Authority is actively engaging the public through a series of listening sessions to gather feedback and gather support for its proposed metro transit expansion project. This initiative aims to eventually create a better-connected transportation network that reaches workers across the entire region.
10. Irvine, Calif. – Total Points: 39.6
Rounding out the top 10 best mid-sized cities for green commuting, Irvine stood out as a leading advocate for the electric vehicle revolution. With more than 20 EV charging stations per 10,000 residents, Irvine not only had easily the highest ratio of EV ports, but also exemplified California’s nationwide leadership in paving the way for an electric future. Likewise, at the city level, Irvine’s vast network of EV charging stations provides peace of mind to EV owners — particularly those residing in apartment complexes or relying on street parking — and ensures easy access to recharging facilities.
At the same time, Irvine also displayed an impressive share of commuting cyclists to claim fifth place among the top 30 cities. This feat was complemented by the city’s extensive network of more than 285 miles of on-street bikeways, as well as the city’s abundance of green spaces. Yet another plus here is the favorable southern California climate which incentives commuters to opt for zero-emission transportation modes such as cycling that enjoy the outdoors.
Methodology
To identify the top mid-sized cities for green commuting, we analyzed a comprehensive set of metrics and used a weighted scoring system to determine the final rankings. Our study focused on cities with populations between 220,000 and 500,000, based on U.S. Census data as of December 31, 2022. Additionally, only cities with complete data for all indicators were included in the analysis.
The term “commuters” refers to workers aged 16 and older who do not work from home. For each metric, points were awarded proportionally to the city’s performance, except for air quality, where lower values were considered better.
Commuting Methods:
- Percentage of workers commuting by public transportation (up to 15 points) — the share of a city’s workforce using public transportation as a means of transportation to work (excluding taxicab). Data source: U.S. Census Bureau.
- Percentage of workers commuting by walking (up to 10 points) — the share of a city’s workforce walking as a means of transportation to work. Data source: U.S. Census Bureau.
- Percentage of workers commuting by bicycle (up to 10 points) — the share of a city’s workforce using cycling as a means of transportation to work. Data source: U.S. Census Bureau.
- Percentage of drivers carpooling to work (up to 10 points) — the share of a city’s drivers who carpool as a means of transportation to work. Minimum two-person carpool. Data source: U.S. Census Bureau.
Green Amenities:
- Number of EV charging stations per 10,000 residents (up to 10 points) — Data source: U.S. Department of Energy.
- Number of parks per 10,000 residents (up to 5 points) — Data Source: Trust for Public Land.
- Percentage of a city’s land area occupied by parks (up to 5 points) — Data Source: Trust for Public Land.
- Percentage of a city’s land area occupied by tree canopy cover (up to 10 points) — Data Source: Tree Equity Score.
Air/Environment:
- Air quality (up to 15 points) — Data Source: Air Quality Index (U.S. Environmental Protection Agency).
- Carbon emissions by city (up to 10 points) — a city’s estimated carbon emissions. In order to estimate each city’s total CO2 emissions, we first calculated the average CO2 emissions per person across the entire state. Then, we multiplied the average emission rate by the population of each city to determine its corresponding CO2 Data source: U.S. Department of Energy.


Matthew Preston
Content Writer, CRE News & Market Analysis
Matthew has covered commercial real estate for CommercialCafe since 2022. He focuses on the office and industrial sectors, reporting on leasing, development, and investment across national markets and individual submarkets. His work draws on data and original research. He also writes about demographic shifts and urban innovation in U.S. cities. The New York Times, The Real Deal, Bisnow, The Business Journals, and Yahoo Finance have cited his reporting.