Caution and financially strategic investment still prevail across the U.S. office sector: While some recovery has occurred in the national market, it has not been equally distributed. Specifically, top-tier properties in key locations still significantly outperform other tiers in terms of leasing and occupancy.
And, while the effect of recent economic policies has not yet had a noticeable effect on office demand, leasing still tends to show a preference for a reduced tenant footprint and increased flexibility. Furthermore, the importance of flexibility is also notable in the continued expansion of the coworking segment, where data showed increased momentum across a greater number of markets during the first three months of the year.
In the office market report below, we ranked the 100 largest office markets in the country by comparing their performances in terms of fundamentals — including asking rent, vacancy, market expansion, and loan maturities — and scoring how each of them kicked off the year.
In order to keep up with evolution in the industry, we capture key performance trends across the 100 largest office markets in the U.S. in a series of quarterly office market reports that compare and score markets across several metric categories, including vacancy, pipeline, asking rates, evolution of the coworking space segment, upcoming loan maturities, and quarterly shifts in online searches for both traditional and flexible office space.
See the methodology section for details and read on for highlights of the best-scoring markets, followed by a breakdown of the ranking report by metric category.
“As the sector continues to undergo significant cultural and technological shifts, flexibility still seems to be doing a great job at filling a much-needed gap for working professionals. Corporations are also making coworking space a growing portion of their overall footprint as flexibility in size, terms, and pricing remain essential benefits.”
Peter Kolaczynski, Director, CommercialEdge
Key Takeaways
Top 10 Office Markets in Q1
- Boston, Baltimore and Orange County, Calif., topped the ranking of largest office markets in Q1 2025.
- Eight of the 10 best-performing mid-sized markets in Q1 were concentrated east of the Mississippi, including four hailing from Florida alone.
Top Scores for Each Ranking Metric Category (jump to section)
- Vacancy: Though rates continued to inch up during Q1, more markets saw larger quarter-over-quarter slips in office vacancy compared to Q4.
- Asking rent: Rents continue to adjust across the sector with roughly half of the markets we compared seeing values trending upward in Q1.
- Office construction: More than 9 million square feet of office space was added in Q1 across 37 of the markets analyzed.
- Coworking space: Data showed quarter-over-quarter growth of the coworking segment in nearly 30% of the office markets we compared.
- Loan maturities: In 41 of the markets we compared, less than 10% (each) of future loans are due to mature in 2025.
- Search trends: Online search trends for office, as well as for coworking space, showed notable increases in interest compared to Q1 2024.
Office Market Report: Top 10 Markets Larger Than 100M Square Feet
Boston remained the best-performing large office market for the third quarter in a row, scoring nearly 67 points out of a potential 100 across the indicators we analyzed in Q1 2025. Boston’s best performances this past quarter stemmed from the expansion of its local coworking scene, future expansion of its office market and its office vacancy rate.
Specifically, Boston scored second-highest for amount of coworking space added during Q1, as well as what that space meant in terms of increase of the share of coworking out of total office in the market. Additionally, Boston earned the third-highest score for the percentage of office stock under construction at the start of the year. It also had the fourth-lowest office vacancy rate among the larger markets analyzed for this ranking report.
With a total of a little more than 66 points out of 100, Baltimore scored very closely behind Boston to rank as the second-best office market in Q1 2025. Office vacancy here was the sixth-lowest of the large markets we ranked. Notably, this marked the largest percentage-point drop from Q4 2024, an indicator for which Baltimore earned the top score on the Q1 scale for this indicator. And, while office space completed here during Q1 was the second-most square footage delivered, it nevertheless represented the largest market expansion as a percentage of stock.
Orange County, Calif., scored third-best in Q1 2025 (63 points) among office markets larger than 100 million square feet. Within this group, the Orange County office market earned the top score for year-over-year increase in average asking rate, as well as for its comparatively good outlook in terms of loan maturities due in 2025. Additionally, office space here had the fifth-lowest vacancy rate during the first quarter of the year, right behind Boston and slightly ahead of Baltimore.
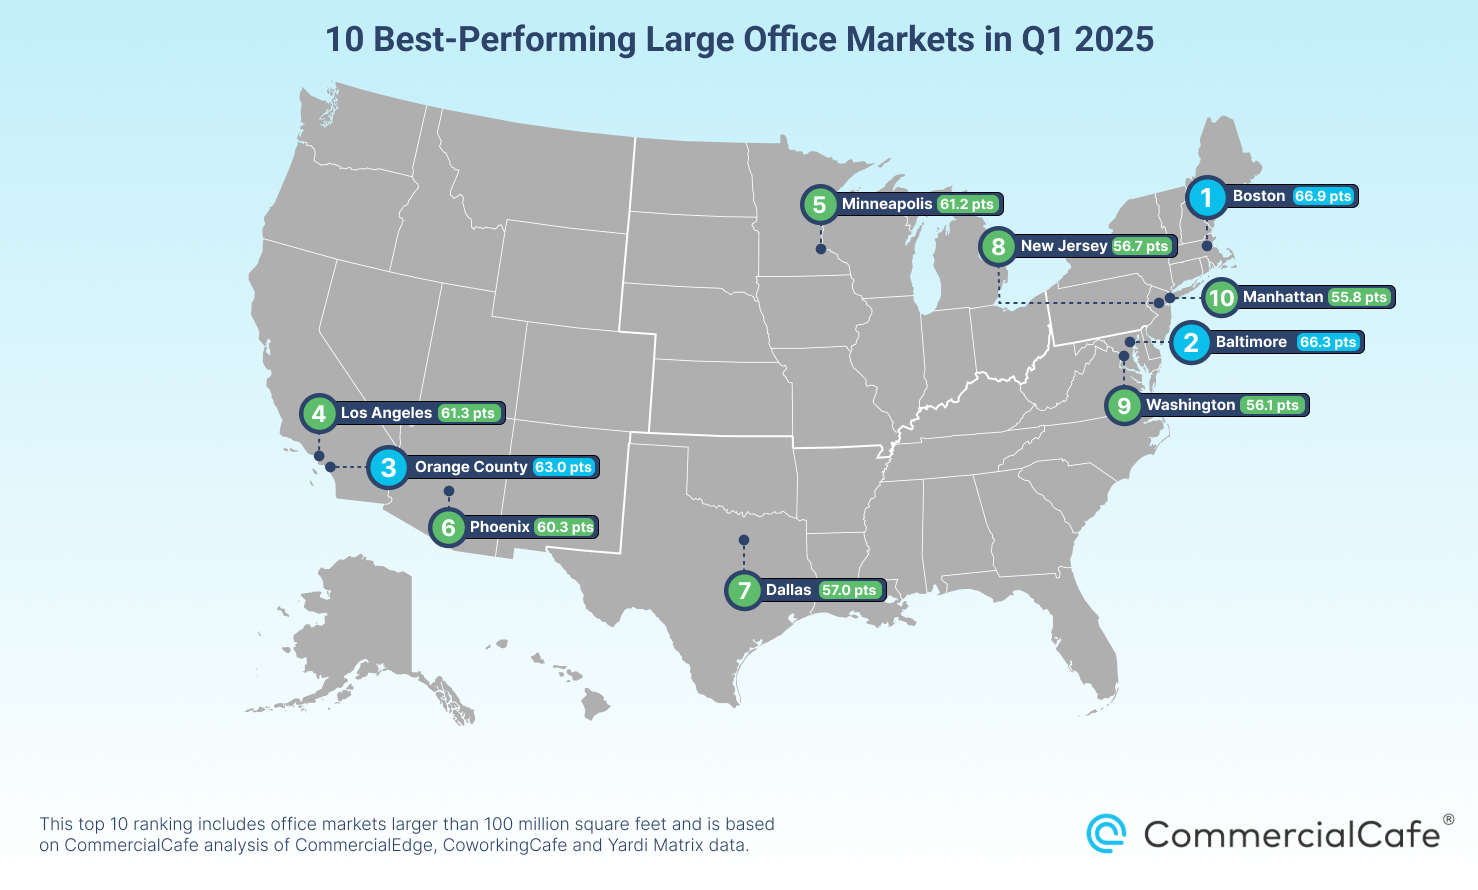
Next, Los Angeles earned the fourth-best score in Q1 2025. The California market sported the second-lowest vacancy rate, and office space here saw one of the 10 largest increases in average asking rent during the previous 12 months. In this case, the local coworking scene also earned Los Angeles some noteworthy scores: Coworking space added here during the first quarter of the year received the third-highest score and represented the sixth-largest increase in the share of coworking space out of the total office space in the market.
Then, Minneapolis-St. Paul rounded out the top five for office markets larger than 100 million square feet. It’s worth noting here that the Twin Cities office market kicked off the year with the lowest vacancy rate of the quarter within this ranking group. The growth of the local coworking scene also equated to top-10 scores both in terms of coworking square footage added during Q1 (ninth-most) and for the share of coworking out of the total office space (seventh-largest).
Placing sixth-best among large markets in Q1 2025, Phoenix earned top-10 scores for most of the indicators we compared for the purposes of this ranking. More precisely, the Arizona office market saw the fourth-highest percentage-point dip in vacancy rate compared to the previous quarter, and office space here had the seventh-lowest vacancy at the close of Q1 among markets larger than 100 million square feet. Phoenix also added the sixth-most office space during the first three months of the year, which represented the fourth-largest market expansion as a percentage of stock. Its fourth-best finish for loans that are expected to mature in the market by the close of the year was another strong performance.
The Dallas-Fort Worth metroplex landed seventh in the Q1 2025 office markets ranking. Its best-performing indicators were its year-over-year increase in average asking rent (second-highest score, behind Orange County); new office space delivered during Q1 (third-highest score); and loan maturities due in 2025 (seventh-best score among markets larger than 100 million square feet).
New Jersey placed eighth-best in Q1 2025 among office markets larger than 100 million square feet. Here, office space delivered during the first three months of the year made for the seventh-largest market expansion in terms of square footage added, as well as eighth-largest when looking at it as a percentage of stock. Moreover, the market placed third-best for office property loans maturing this year. New Jersey also had the eighth-lowest vacancy rate in Q1, following what was the fifth-largest percentage-point dip compared to the previous quarter.
Washington, D.C. earned the ninth-best score of the large markets compared in our ranking. The capital’s strongest suits in Q1 2025 included loans maturing this year (fifth-best score), as well as the office market expansion in terms of square footage added since the start of the year (eighth-best) and as a percentage of stock (ninth-best).
Not to be outdone, Manhattan, N.Y., wrapped up the top 10 office markets larger than 100 million square feet in Q1 2025. The East Coast powerhouse claimed the third-lowest office vacancy rate at the close of Q1, following a very modest dip from Q4. Recent reports show that not only did leasing activity in the country’s premier office market remain strong in recent months, but sublease inventory also shrank and premium office spaces are quickly claimed.
Office Market Report: Top 10 Markets Smaller Than 100M Square Feet
With a total score of nearly 72 points out of 100, Florida’s Tampa-St. Petersburg-Clearwater ranked first among office markets with less than 100 million square feet in Q1 2025. The market earned the top score for having added the most office square footage during the first three months of the year — an expansion that ranked third when considering it as a percentage of stock. The local pipeline-related strengths were also apparent in upcoming projects as its percentage of stock under construction in Q1 was the second-highest among markets this size in the ranking.
On the opposite coast, Inland Empire, Calif., earned the second-best score in this ranking group. Among office markets with less than 100 million square feet, the Inland Empire held its position for the lowest vacancy rate, despite a roughly one-percentage-point increase compared to the previous quarter. Meanwhile, office deliveries here during the first three months of this year represented the fourth-largest market expansion, both in terms of square footage and as a percentage of stock.
Back east, Miami earned the third-best score among the mid-sized entries in our ranking. The development pipeline here continued to be the Florida market’s strongest suit with office space under construction in Q1 making for the third-largest market expansion as a percentage of stock among ranking entries smaller than 100 million square feet.
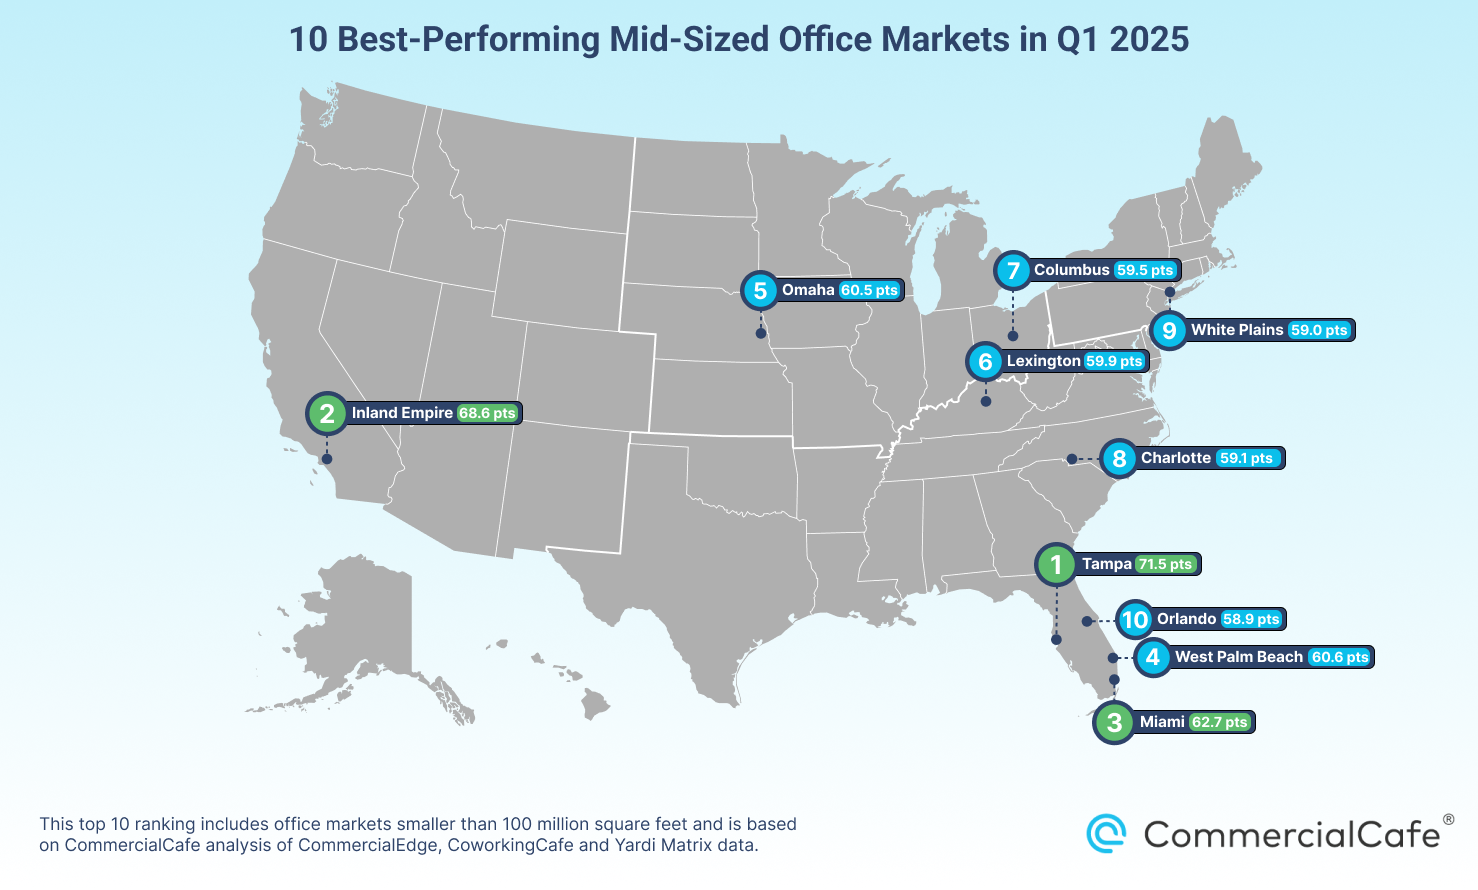
The third Florida market to rank among this top-10 echelon, West Palm Beach scored fourth-best. Here, the under-construction pipeline in Q1 2025 earned the highest score for percentage of office stock in development. What’s more, the office vacancy rate in West Palm Beach was the third-lowest in the group.
Next, Omaha, Neb., placed fifth in the ranking among office markets with less than 100 million square feet. Its best-performing local indicators in Q1 pertained to the expansion of the coworking scene (scoring second-best for growth in terms of square footage and as share of coworking out of total office); office space in development (fourth-most office space under construction as a percentage of stock); and the office vacancy rate in the market (fourth-lowest among the smaller markets in our ranking).
Further east, Lexington, Ky., ranked sixth-best with a total score of nearly 60 points out of 100. Of the office markets with less than 100 million square feet compared in this ranking, Lexington had the lowest share of loans maturing this year, which earned it a top score for this indicator. And, while office square footage delivered during the first three months of this year scored 12th, it nevertheless represented the second-largest quarterly market expansion as a percentage of stock.
Nearby, Columbus, Ohio — which landed seventh in this ranking group — performed its best for office market expansion and asking rent trends. Specifically, the office space delivered during Q1 2025 represented the seventh-most square footage among markets in this ranking group and was 11th-highest when considering it as a percentage of stock. At the same time, the average asking rent for office space in Columbus saw the eighth-largest increase from Q1 2024, scoring closely behind Charlotte, N.C., for this performance indicator.
Speaking of Charlotte, the North Carolina entry was the eighth-best scoring market in Q1 among entries with less than 100 million square feet of office space: Average asking rents for office space saw the seventh-largest increase year-over-year. In fact, Charlotte was one of only nine markets in this ranking where rents went up more than 10% since Q1 2024.
Not to be outdone, White Plains, N.Y., earned the ninth-best score in Q1 2025 by sporting a comparatively low share of office property loans maturing this year (sixth-lowest), the seventh-largest under-construction pipeline as a percentage of stock, and the fifth-largest dip in vacancy rate from the previous quarter.
Finally, Orlando, Fla., wrapped up the top 10 and was the fourth Florida market to rank among the 10 best in Q1. Here, the average asking rent for office space showed the fourth-largest increase in 12 months, while the vacancy rate dipped a modest half-percentage point from the previous quarter — all with less than 1% of stock under construction in Q1 2025. Expansion of the coworking scene was Orlando’s best-performing indicator since the start of the year after it added the sixth-most coworking square footage during the first three months of 2025.
Top-Scoring Office Markets for Each Ranking Metric
1. Top-Scoring Markets by Vacancy Rate at Close of Q1
Across the top 10 ranking entries with more than 100 million square feet of office space (those that had the lowest vacancy at the close of Q1), rates were well into the double digits (from 16.5% to 19.5%). For comparison, within the mid-sized markets ranking (less than 100 million square feet), there was only one entry in Q1 2025 with a vacancy rate below 10%. Among the latter, the 10 lowest vacancy rates were from 8.2% to 14.6%.
Markets Larger Than 100M Square Feet: Twin Cities, Los Angeles & Manhattan in Close Competition for Lowest Vacancy Rate
The three markets to score best for this indicator were in very close competition for the lowest vacancy at the close of this year’s first quarter. In the end, office vacancy in Minneapolis-St. Paul received the top score, followed by Los Angeles (#2) and Manhattan, N.Y. (#3), all of which rounded out to about 16.5% in March 2025.
Markets Smaller Than 100M Square Feet: California’s Inland Empire Remains Only Mid-Sized Office Market With Office Vacancy Rate in Single Digits
In California, Inland Empire remained the only office market in the ranking to claim a vacancy rate below 10% in Q1. Up nearly one percentage point from the close of Q4 2024, vacancy averaged 8.2% here in March 2025. Not far behind, the southwest Florida coast ticked up to an even 10% to score second-best. It was followed by West Palm Beach, Fla., in third place at a comfortable, two-percentage-point distance.
2. Top-Scoring Markets for Q-o-Q Percentage-Point Change in Vacancy Rate
Nearly 30 of the markets included in this ranking saw some relief in vacancy from the previous quarter — and eight of those were markets larger than 100 million square feet. Though dips in office vacancy remained modest during the first three months of the year, some did surpass the maximum percentage-point difference we saw between Q3 and Q4 2024. Whereas the greatest single-market decrease then was just one percentage point, in Q1 2025, data showed vacancy rates slip as much as four percentage points.
Markets Larger Than 100M Square Feet: More Large Markets See Dip in Vacancy Than in Previous Quarters
In this report, eight of the 22 office markets with more than 100 million square feet of office space saw decreases in vacancy from the previous quarter. Fortunately, that marks continued improvement compared to Q4 2024 (when that number was six), as well as Q3 2024, when it was just three.
Baltimore earned the top score for changes in vacancy rate after recording a two-percentage-point slip since Q4. To the south, Houston followed in second place with a 1.7-percentage-point dip to go from a 24.5% vacancy rate in December to 22.8% this March. The Bay Area in California was third after a 0.8-percentage-point decline in its vacancy rate (from 26.4% to 25.5%).
Markets Smaller Than 100M Square Feet: Vacancy Trends Hold Steady in Q1 Across Mid-Sized Markets
Among office markets smaller than 100 million square feet, vacancy trends held relatively steady compared to the previous quarter: About 40% of the markets in this category saw office vacancy dip in Q1. The largest single-market decrease was a little more than four percentage points.
Tulsa, Okla., was the top-scoring market in this category with a vacancy rate decline of 4.3 percentage points from December to March. Next, Boise, Idaho, earned the second-highest score for this metric with office space here seeing a four-percentage-point decrease in vacancy during Q1. New Orleans scored third-best as office space vacancy here slipped 2.8 percentage points compared to Q4 2024.
About half of the 22 office markets with more than 100 million square feet included in our ranking report saw positive 12-month differences in office asking rents during the first three months of 2025. At the same time, of the 53 office markets we compared with less than 100 million square feet, nearly 60% saw flat or upward average office asking rent trends.
Markets Larger Than 100M Square Feet: Average Asking Rates Mark Modest Increases Across 10 Best-Scoring Markets
As Q1 2025 wrapped up, Orange County, Calif., had the highest 12-month asking rate hike among the larger markets we compared for this ranking report. Next, Dallas-Fort Worth followed in second place with asking rents in March 2025 averaging 8% higher than a year before. Staying in Texas, Austin landed third. Average asking rents here were roughly 7% higher in Q1 2025 than they were in Q1 2024. Atlanta (#4) and San Francisco (#5) were the only other markets in this ranking group to see average office asking rents increase by more than 5% year-over-year.
Markets Smaller Than 100M Square Feet: Indianapolis Average Asking Rents Push Market to Top Score in Q1 2025
Indianapolis shot up to the #1 position for this metric by earning the top score for the largest 12-month increase in asking rates in Q1. Interestingly, Kansas City, Mo. — which earned the second-best score for this indicator — was the only other market in this group to see rents increase by more than 18% compared to the previous year. Las Vegas scored third, followed by Orlando, Fla., (#4) and Raleigh-Durham, N.C., (#5) in very close succession.
1. Largest Office Market Expansions in Q1 2025
Nearly 6 million square feet of office space was delivered during the first three months of the year across 14 of the 22 larger markets compared in this ranking report. At the same time, 23 of the 53 mid-sized markets experienced expansion in terms of the square footage of added office space for a total of about 3.2 million square feet delivered in Q1.
Markets Larger Than 100M Square Feet: Office Deliveries Pick Up Steam in Q1
According to data on recently completed projects, 14 of the 22 larger markets in our ranking added office square footage during Q1 2025, compared to just seven in Q4 2024. Granted, as the number of markets welcoming more office space increased, the square footage delivered (5.9 million square feet) also inched upward. In the previous quarter, completions amounted to just less than 5 million square feet.
In particular, the 1.5 million square feet of San Francisco office space added during the first three months of the year earned the City by the Bay the top score for market expansion in terms of square footage, as well as the second-best score for market growth as a percentage of stock. Meanwhile, Baltimore had the largest market expansion as a percentage of stock — the only large market in the ranking to add more than 1% in Q1 — and placed second to San Francisco for square footage completed.
Lastly, Dallas-Fort Worth was the only other market in the ranking to add more than 1 million square feet during Q1. As such, it placed third for both market expansion indicators (by square footage and as a percentage of stock).
Markets Smaller Than 100M Square Feet: Office Completions in Q1 Make for Slow Start to Year
When looking at new office space delivered across markets with less than 100 million square feet in Q1, Florida’s Tampa-St. Petersburg-Clearwater market earned the top score for its roughly 654,000 square feet of office space completed during Q1. That represented roughly 0.8% of stock, which scored third-best among markets in this ranking group.
Raleigh-Durham in North Carolina followed in second place for market expansion in terms of square footage added.
Then, Louisville, Ky., had the third-most square footage completed. However, the volume of deliveries here represented 1.1% of stock, which was the largest such single-market expansion in Q1, followed closely by nearby Lexington, Ky. (0.88% of stock).
2. Largest Office Space Pipeline Under Construction in Q1 2025
Development pipeline data for projects under construction in Q1 showed 54 million square feet of new office space underway across all of the 22 large office markets we compared for this ranking. Meanwhile, nearly 24 million square feet was in development across 40 of the 53 mid-sized markets ranked in this report. Looking at the development pipeline as a percentage of stock, data showed that the largest expansion within both market size groups was around 4% in Q1 2025.
Office Space Under Construction in Q1 as a Percentage of Stock in Markets Larger Than 100M Square Feet
Austin, Texas, earned the highest score for this metric with nearly 4% of stock in various stages of development. The second-largest percentage of stock that was under construction at the start of this year was in San Diego, where 2.8% of office stock was under construction. Boston ranked third as office projects in progress here added up to about 2.4% of stock.
Office Space Under Construction in Q1 as a Percentage of Stock in Markets Smaller Than 100M Square Feet
Three Florida markets top the chart for market expansion as a percentage of stock among ranking entries with less than 100 million square feet. First, West Palm Beach led the under-construction pipeline ranking in Q1. Next, Tampa-St. Petersburg-Clearwater earned the second-best score with a development pipeline representing 3.67% of stock. It was followed by Miami, where 3.32% of stock was in progress in the first quarter of the year. Moreover, within this ranking group, they were also the only three markets to record expansions larger than 3% of stock in Q1.
In Q1 2025, data showed that more markets experienced an expansion of their coworking segments than in the previous quarter. To be precise, more than 3.2 million square feet of coworking space was added across 17 of the 22 large markets included in the ranking during the first three months of this year. This was a slight increase compared to the 15 markets that saw coworking growth in Q4. The same was also true for markets smaller than 100 million square feet, 29 of which saw positive differences in total coworking square footage from the previous quarter, when 27 coworking markets expanded.
Otherwise, no ranking entries exceeded one percentage-point growth in the share of coworking out of the total local office space.
Markets Larger Than 100M Square Feet: Chicago Nabs Comfortable Lead for Coworking Scene Growth in Q1
Chicago added the most coworking space during the first three months of the year and received the highest score for its coworking expansion of more than 1.1 million square feet. The Illinois market led the Q1 ranking in this respect by a significant margin and was the only entry to see the local coworking scene grow by more than 1 million square feet.
Boston earned the second-best score for this metric after adding close to 420,000 square feet in Q1. Los Angeles followed in third place with a Q1 coworking scene expansion of more than 280,000 square feet.
Markets Smaller Than 100M Square Feet: More Expansion in Coworking Segment
Among the 29 ranking entries with less than 100 million square feet to see positive change for this indicator, the largest coworking expansion in Q1 was roughly 207,000 square feet in Tampa-St. Petersburgh-Clearwater. This total represented the fourth-largest increase of the share of coworking space out of the total local office space.
Omaha, Neb., earned the second-highest score for both its coworking growth in terms of square footage and for its expansion of the coworking segment as a share of the total local office space. Next, San Antonio landed in third for coworking space added during Q1, while Fort Wayne, Ind., had the third-largest increase in the share of coworking out of the total local office space.
Of the nearly $780 billion in loans across the 75 markets that entered the Q1 ranking, roughly $77 billion are estimated to mature this year. That said, as the year progresses, we’ll likely see adjustments to these numbers as some maturities may be refinanced; some loans may still have extensions available; and new ones, of course, are yet to be issued.
Markets Larger Than 100M Square Feet: Orange County & Detroit Sport Smallest Percentages of Future Loans Coming Due This Year
Orange County, Calif., earned the highest score for this metric among the larger office markets in the ranking: Loans due to mature here represented a little more than 5% of the total future maturity value at the start of the year. Detroit — the next-best-scoring entry on this list — was the only other large market in Q1 to have less than 6% of loans maturing in 2025 out of the total future loans in the market.
Of course, Manhattan (the largest market of them all) remains firmly planted among the 10 best-positioned markets for loan maturities and remains the market with the largest dollar value of loans maturing in the current year ($19.4 billion). The New York powerhouse scored roughly on par with Washington, D.C. At the start of the year, each of the two markets was looking at about 7.5% of loans maturing in 2025.
Meanwhile, the highest percentage among office markets with more than 100 million square feet was in Atlanta, where the nearly $3.2 billion in loans due to mature this year account for 21.1% of future loans in the market.
Top-Scoring Markets for Online Office Space Searches
In Q1 2025, the average monthly volume of searches for office space saw a year-over-year increase in 18 of the 22 office markets with more than 100 million square feet included in this ranking. Boston earned the top score for its notable boost in search volume compared to the monthly average in Q1 2024. Washington, D.C. followed in second place, and San Francisco office space wrapped up the top three.
Looking at the office markets that claim less than 100 million square feet, 12-month search trends showed a strong increase in interest for office space in New York’s Long Island and Albany.
Top-Scoring Markets for Online Coworking Space Searches
Of the larger markets in the Q1 ranking, 11 saw positive year-over-year differences in their average monthly volumes of online searches for coworking space. Namely, Baltimore (#1), California’s Bay Area (#2) and San Francisco (#3) earned the top three scores for this indicator. They were also the only three to see more than 50% positive differences in the average monthly volume of online searches for coworking space in 12 months.
At the same time, among the 16 office markets with less than 100 million square feet to see positive development for this metric, it was White Plains, N.Y., (#1) and Fort Wayne, Ind., (#2) that saw the average monthly volume of online searches for coworking space increase by more than 50% year-over-year.
Methodology
For this office market report, we compared the 100 largest office markets in the U.S. (by total office space square footage) across several indicators — office space lease rate, vacancy, the local coworking segment, pipeline activity, loan maturities, and online search interest for each location on the list. All individual ranking metrics are explained further below.
We based our analysis on commercial real estate data and research from CommercialEdge, CoworkingCafe, and Yardi Matrix, as well as analysis of Google search trends. For a fairer comparison, we divided the dataset into two groups and chose the cutoff threshold to be 100 million square feet. Each group was then comparatively ranked separately. Furthermore, to account for the occasional percentage-value volatility in markets with low leasing activity, the final rankings include only those markets where the average asking lease rate was calculated based on at least 100 listings.
A certain number of maximum points was attributed to each metric. This total was evenly distributed between the lowest and highest metric values in each of the two groups. On this scale, a score was calculated for each location based on its metric values. The factors (metrics or indicators) on which we based the composite scores are explained below.
For average vacancy rate and loan maturity rate, the number of points awarded was inversely proportional to the metric values. For all other indicators, the number of points awarded was directly proportional to the metric values.
- Refers to the year-over-year comparison between asking lease rates in each office market between the last month of Q1 2024 and the last month of Q1 2025. This metric reflects the percentage change in asking rate during that 12-month time period.
- Maximum points: 20
- Data source: CommercialEdge
- In this category, we looked at two aspects:
- the vacancy rate for each market in the last month of Q1 2025 (a metric for which we attributed a maximum of 25 points)
- the percentage point change in vacancy rate compared to the last month of Q4 2024 (for which we attributed a maximum of 5 points)
- Maximum points: 30
- Data source: CommercialEdge
- This metric category included three indicators:
- office square footage added during Q1 in each of the locations we included in the ranking (maximum 10 points)
- office space added as percentage of total inventory between December 2024 and March 2025 (maximum 5 points)
- office space under construction at the start of Q1 as a percentage of total market inventory (maximum 10 points)
- Maximum points: 25
- Data source: CommercialEdge and Yardi Matrix
- In this category, we looked at two aspects:
- the change in total coworking space square footage for each market compared to the previous quarter (a metric for which we attributed a maximum of 2.5 points)
- the percentage-point change of the coworking share out of total office space in each location compared to the previous quarter (maximum 2.5 points).
- Maximum points: 5
- Data source: CoworkingCafe
- This metric refers to the total of loans that are due to mature in 2025 as a percentage of total future loans in the market.
- Maximum points: 10
- Data source: CommercialEdge
- As a potential indicator of tenant interest in the market, we looked at changes in the monthly average volume of online searches for both office and coworking space compared to the monthly average at the same time in the previous year. We attributed a maximum of 5 points for each property type.
- Maximum points: 10
- Data source: in-house analysis of Google searches for office- and coworking-related keywords