Key Takeaways:
- The U.S. office vacancy rate was 19.4% in June, following an increase of 130 basis points year-over-year
- The average U.S. office listing rate was $32.87 per square foot in June, marking a 3.8% year-over-year increase
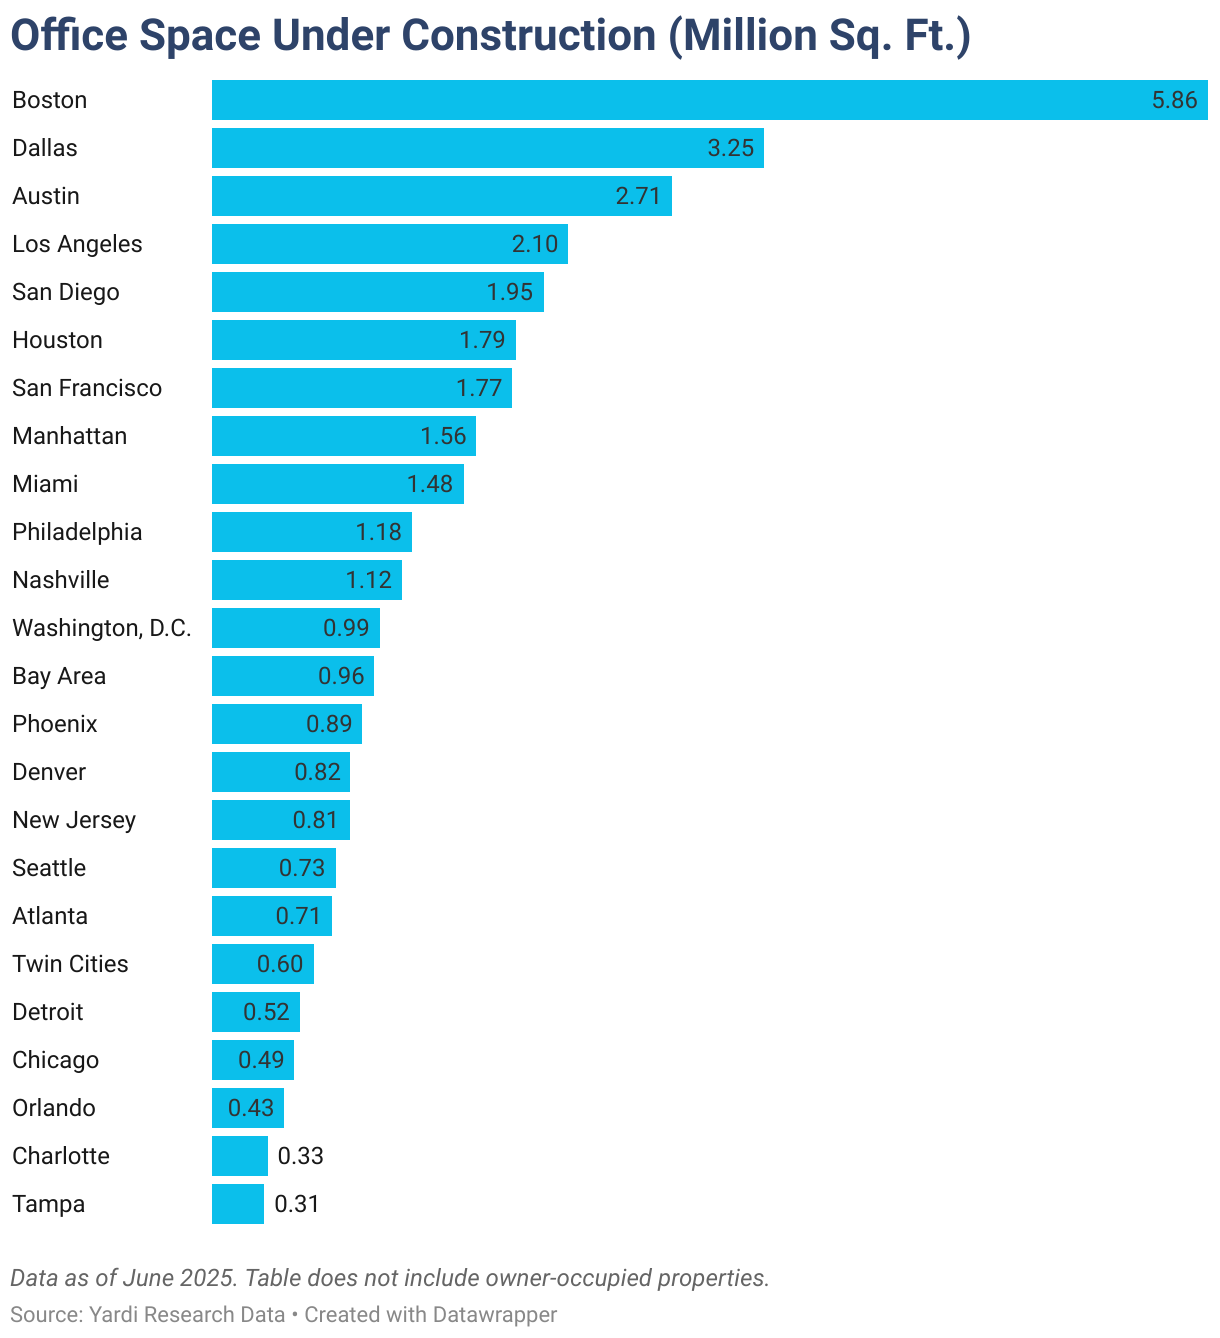
- With nearly 41 million square feet of office space currently under construction, the office supply pipeline continued to shrink last month
- The Bay Area topped the list for YTD sales through June in terms of total dollar volume (nearly $3.2 billion) and claimed the second-highest sale price per square foot ($387)
- Austin, Texas, vacancy was the highest in the nation in June at 28%, while the market boasted the third-largest development pipeline (2.7 million square feet under construction)
- More than half of the national office pipeline is concentrated in construction across 11 of the top 25 markets, with Boston and Dallas-Fort Worth leading in June
Trends & Industry News
Loan Maturities in the Office Sector Coming Home to Roost
Yardi Research estimates that about 14,000 office properties are encumbered by loans that have recently matured or that will mature by the end of 2027. That equates to 33% of all office loans and adds up to nearly $290 billion. Additionally, at the start of the year, Moody’s reported that the percentage of loans extended in 2024 dropped from the previous year and defaults increased. And, according to Trepp, office commercial mortgage-backed security delinquency rates rose to 11.08% in June, which marked a 3.5% increase from June 2024.
But, what does this all mean? Well, it means that some cans have been kicked just about as far as the road goes, and borrowers and lenders must now confront difficult decisions. While loan extensions have kept borrowers afloat to some extent, lenders are likely to be hesitant to extend loans going further. What’s more, we are likely to see more discounts on office properties in the coming months, as the possibility of office-to-residential conversion becomes more attractive and more public policies are created to support it.
“Our expectation is that, given the unchanged office headwinds, more buildings will have their future determined in the second half of 2025 than we have seen recently with the spike of short-term extensions.”
Peter Kolaczynski, Director, Yardi Research
Vacancy remaining elevated in alignment with stagnant physical occupancy numbers, sluggish office-using job growth, interest rates likely to remain high, and overall economic uncertainty are compounding the stress affecting office properties that were already struggling.
Among the largest office markets in the U.S., Atlanta is looking at the highest percentage of loans maturing (50.5%, valued at more than $11 billion). Then, Denver follows close behind with 49% of loans maturing ($8.4 billion). Similarly, Bridgeport-New Haven, Conn., is looking at 48.5% of loans coming due ($3.9 billion); Chicago is at 46% ($15.3 billion); and the Twin Cities office market has 41.2% (or $3.4 billion) in loans maturing.
Listing Rates & Vacancy
Manhattan’s Mix of Office Users Yields Resilience
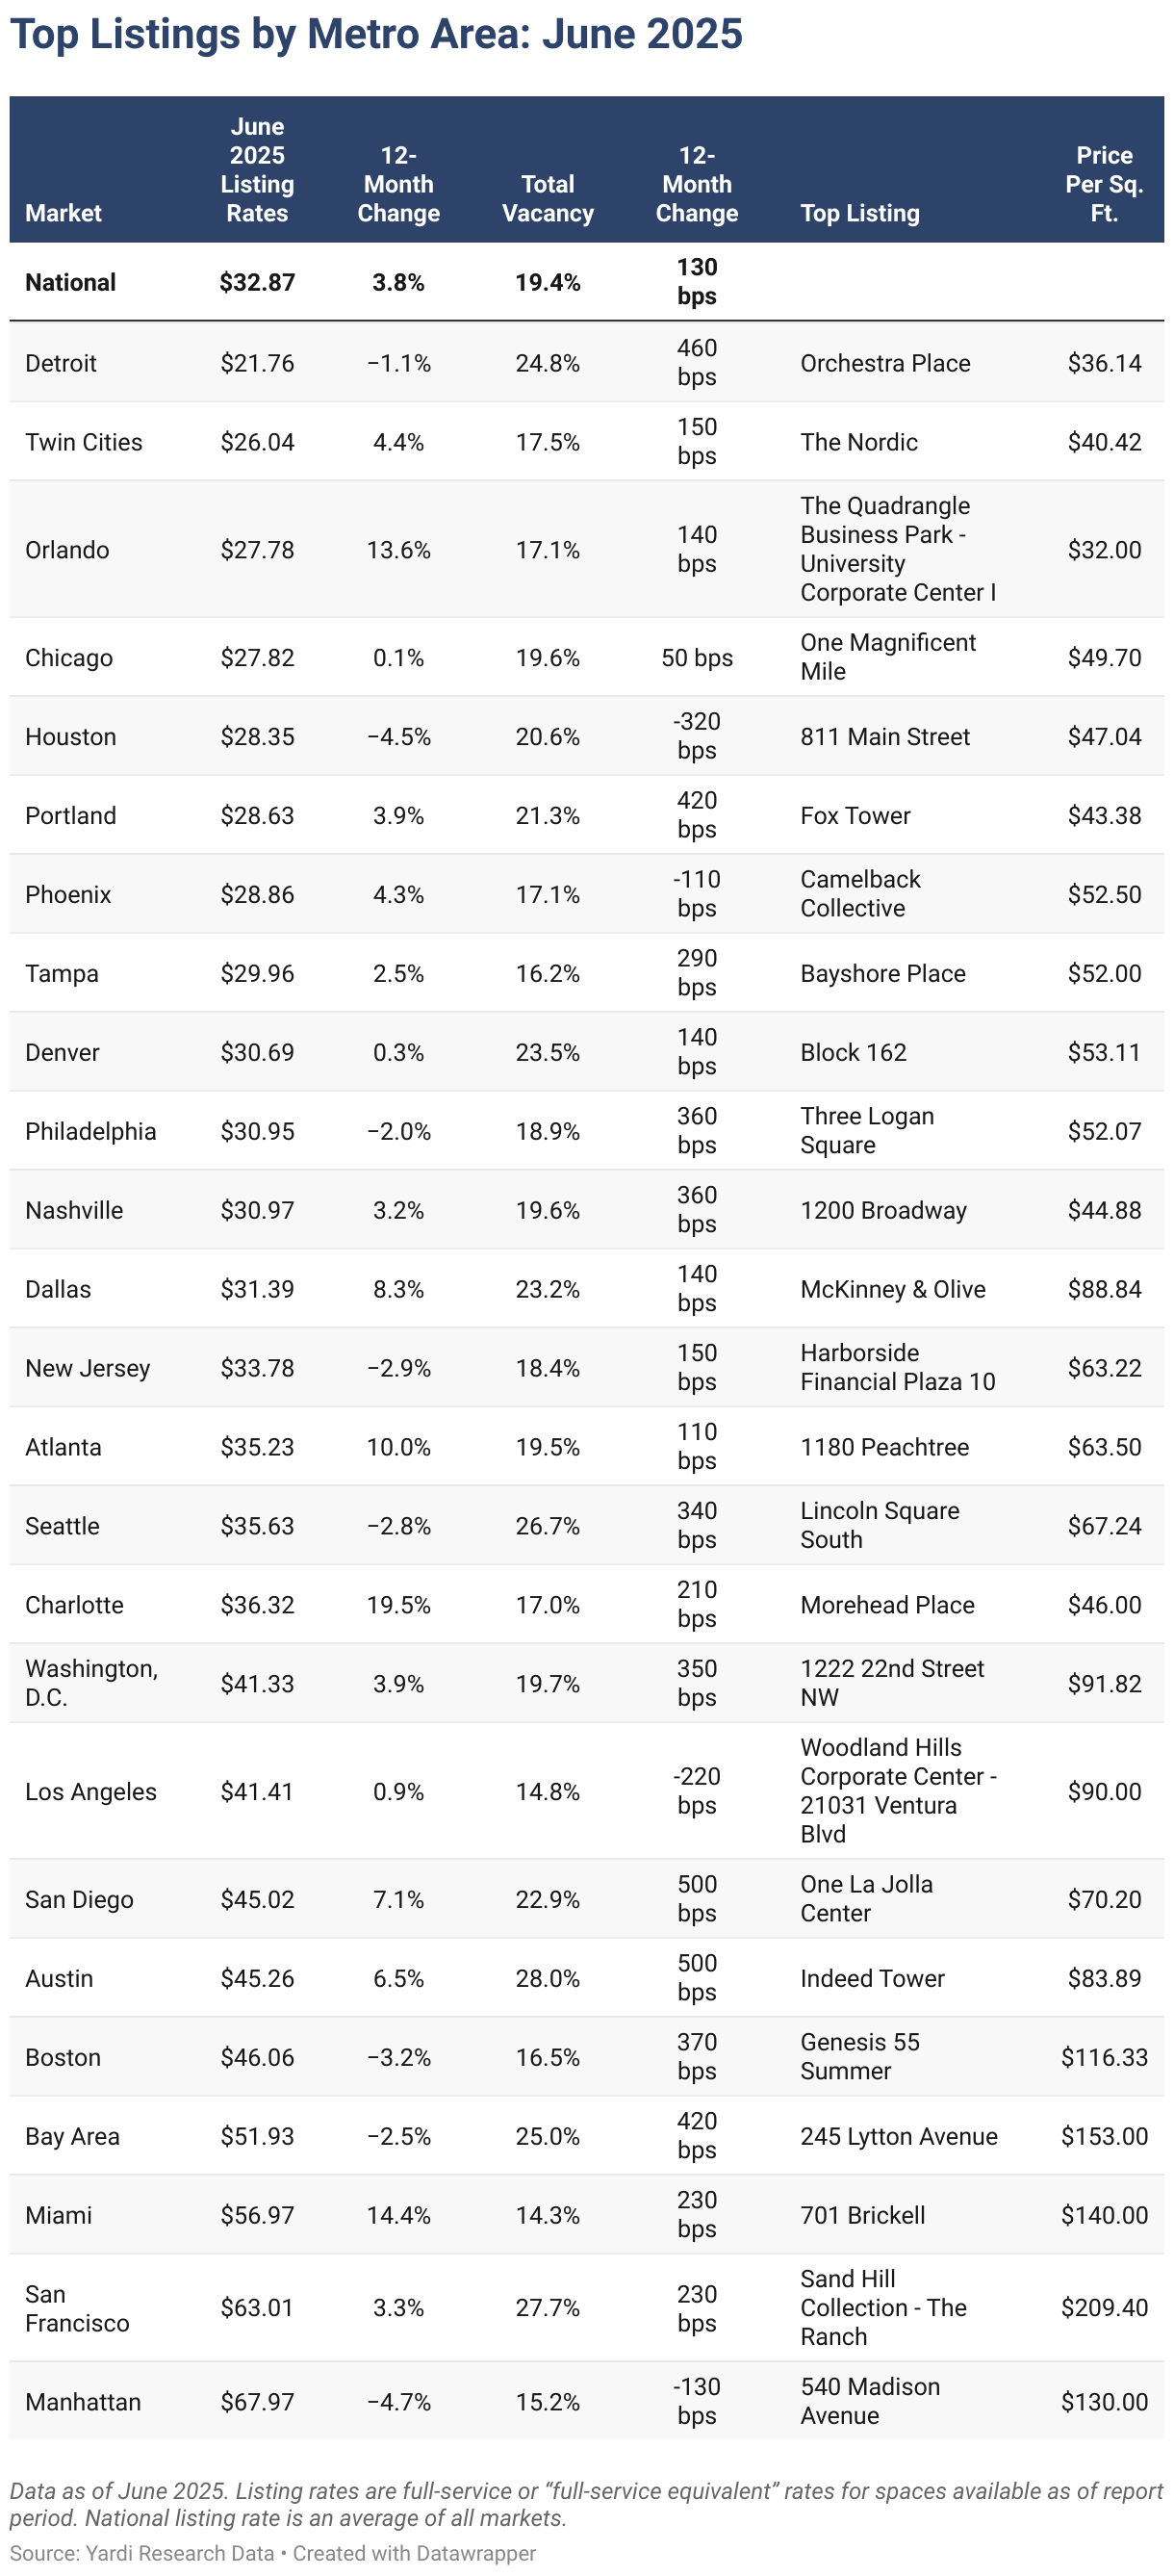
In June, the national average full-service equivalent listing rate stood at $32.87 per square foot. This marked a slight decrease of $.28 from the previous month, but was nevertheless a 3.8% increase compared to a year before. At the same time, the national vacancy rate remained relatively flat month-over-month at 19.4%, although it represented an uptick of 130 basis points (bps) year-over-year.
Zooming in on Manhattan, N.Y., the vacancy rate fell by just as much during the previous 12 months to reach 15.2% in June and stand out as one of the few examples of what key players in the office sector still hold out hope for. Of course, the significant local concentration of legal and finance firms (where remote work is less prevalent) holds weight in office occupancy. Plus, Manhattan’s notoriously tight quarters mean that many residents lack adequate space to work at home, which also contributes to higher office space usage.
At the same time, big names holding large footprints in the city added to the office sector’s resilience in Manhattan. One such example of considerable market activity is Amazon, which has either leased or acquired nearly 1.5 million square feet since last fall with transactions of significant office leases, such as the 330,000 square feet that the company signed on for at 452 Fifth Ave. earlier this year.
Transactions
Atlanta: Investment Reality Beyond Steady Sale Price
Office sales through the first half of the year added up to a total of $23 billion with assets trading at an average price of $189 per foot. One of the steadier markets in terms of investment performance has been Atlanta: Office assets sold this year in the Georgia market changed hands for an average of $163 per square foot, which was not much below the 2019 average sale price of $168 per square foot.
Aside from the relatively stable sale price for office space in Atlanta, the sales volume has been lower in the last three years compared to 2019 through 2021, and prominent properties have traded at discounted prices. One such example was the office high-rise at 1100 Peachtree, which Street Capital purchased this May for nearly $140 million. The property was previously acquired for nearly $154 million in 2007.

Supply
Office Construction at New Low as Life Sciences Space Reaches Surplus
Development activity showed nearly 41 million square feet of office space under construction as of June 2025 across top office markets in the U.S. Representing an estimated 0.6% of stock, this supply pipeline also marks what seems to be the lowest level of activity in recent years.
According to the latest construction data analyzed for this report, 6.5 million square feet of starts were logged during the first six months of the year, which is on pace to match the 12 million square feet started in 2024. Of course, the pandemic’s long-term effects on the way we work are likely to continue unfolding for years to come, so new office development is expected to remain rather modest.
Even the life sciences development surge in recent years has reached a level to be tempered as enthusiastically built large research and development campuses have struggled to fill the lab space, indicating that the sector is oversupplied.
One such example is San Diego, where 3.5 million square feet of lab space was delivered between 2020 and 2024 — including projects such as the RaaD IQHQ Campus and the Campus at Hoton — for which life sciences tenants have been challenging to secure. And, with more than half of the nearly 2 million square feet of space currently under construction in San Diego dedicated to life sciences, lab vacancy in the market is expected to keep climbing.
Western Markets
Los Angeles, San Diego & San Francisco Lead Office Development in Region
Most of the Western U.S. markets surveyed for this report continued to see office vacancy rates above the national average of 19.4% throughout June. The highest market vacancy rate in the region last month was in northern California: Office space in San Francisco was 27.7% unoccupied in June after a year-over-year vacancy increase of 230 basis points.
On the southern end of the Golden State, San Diego office space logged the largest 12-month vacancy increase in the region — 500 basis points since June 2024 for nearly 23% vacancy last month. The third-largest year-over-year hike in vacancy was also in a California market: office occupancy in the Bay Area dropped by more than 420 basis points since June 2024, when it was nearly 21% (now roughly 25% office vacancy in June 2025).
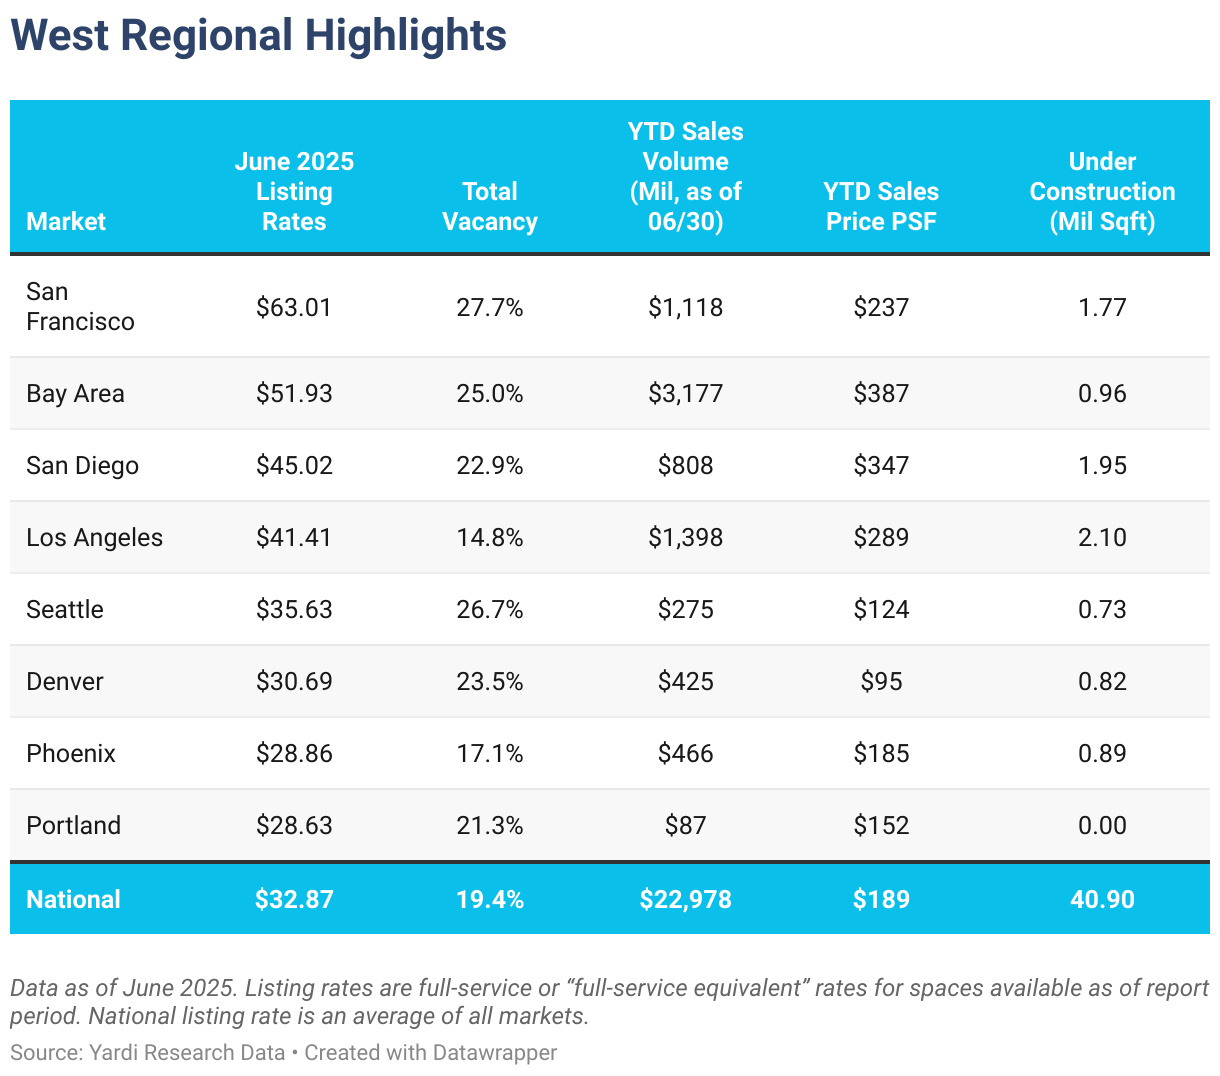
San Francisco also logged the largest asking rents among Western U.S. markets in June. Here, office space was about $63 per square foot after an increase of more than 3% in 12 months.
Similarly, four other Western U.S. markets also had office space pricier than the national average of $32.87. The Bay Area in California was the second-priciest leasing market in the region with full-service rates or full-service equivalent office asking rates averaging nearly $52 in June. San Diego was third ($45) and Los Angeles followed close behind ($41.40). Seattle ($35.63) was the only Western market outside of California with asking rents higher than the national average in June.
Meanwhile, three of the eight largest Western U.S. markets surveyed for this report totaled office sales in excess of $1 billion during the first six months of the year: Once again, the Bay Area stood out for year-to-date office sales adding up to $3.17 billion through June, which was more than the next two markets combined — Los Angeles ($1.4 billion) and San Francisco ($1.1 billion).
Office space in the Bay Area was also the priciest in the region with properties here changing hands at an average of nearly $387 per square foot in June. Then, Los Angeles was the third-most expensive market in the region with office space trading for an average of $289 per square foot. The market also had the third-highest year-to-date sales volume with assets traded in LA adding up to nearly $1.4 billion through June.
Whereas office assets in top California markets traded above the national average of $189 per square foot, office sales in Phoenix; Portland, Ore.; Seattle; and Denver closed below it.
It’s worth noting that roughly 63% of office construction in Western markets was concentrated in Los Angeles, San Diego, and San Francisco, which led development in the region with around 2 million square feet underway each for a combined total of nearly 6 million square feet under construction last month.
Midwestern Markets
Chicago Investment Momentum Continues, Approaching $1 Billion in YTD Sales
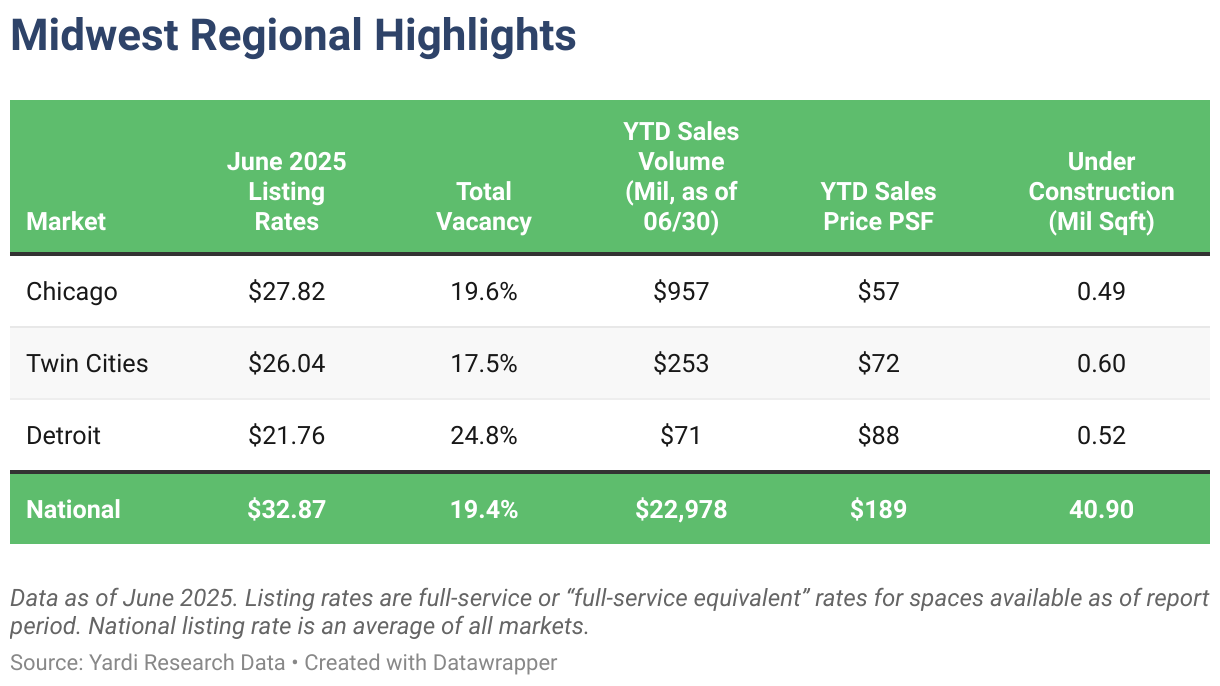
The Midwest accounted for three of the five most affordable office markets in June, both for office leasing and for investment. Here, office development remained comparatively limited, maintaining the region’s trend of slow construction activity. Vacancy rates also held relatively steady year-over-year.
Specifically, Chicago office space retained its position as the lowest sale price in June, averaging $57 per square foot last month. Even so, year-to-date transactions totaled more than $957 million — the seventh-largest office sales total among top U.S. markets through June and more than double the sales total closed during the same time last year ($345 million from January through June 2024).
In terms of leasing, office space in Chicago had the fourth-lowest rate in June ($27.82 per square foot) on a national level, as well as the third-most affordable within the Midwest. Office vacancy here was slightly above the national average last month, holding relatively stable year-over-year at around 19%.
Otherwise, the Twin Cities had the lowest vacancy rate in the Midwest in June (17.5%) and was the only one in the region below the national level. Office space here was the second-most affordable among Midwest markets, both for leasing and for sales. Asking rates also increased more than 4% year-over-year to reach roughly $26 per square foot in June. At the same time, office sales closed since the start of the year totaled about $253 million and averaged $72 per square foot.
Looking at supply, the nearly 600,000 square feet of office space under construction in the Twin Cities marked a year-over-year increase of almost 37%. Notably, Minneapolis-St. Paul was one of only two office markets in June where there was more office space in development than a year prior. The other was Phoenix.
Not to be outdone, Detroit was the least expensive office market in June with rents at $21.60 per square foot. Sales closed here during the first six months of the year averaged $88 per square foot, which was the priciest in the region. And, with 520,000 square feet of office space in development, Detroit even had a slightly larger supply pipeline than Chicago last month.
Southern Markets
Miami Leads in Leasing & Sale Prices, Texas Markets Dominate Construction Pipeline
Office rents in the top Southern markets remained mixed in June with half placing below the national average. Nevertheless, construction activity remained strong with five markets boasting supply pipelines larger than 1 million square feet each. Moreover, vacancy rates were below the national average in three of the top office markets in this region last month.
In the South, Miami was the priciest market, both in terms of leasing (with an office asking rent average of nearly $57 per square foot in June) and sale price per square foot, which averaged $255 per square foot for office sales closed during the first six months of the year. On a national level, Miami had the third-largest office asking rate and the fifth-highest sale price per square foot.
However, Washington, D.C., and Houston stood out for year-to-date sales totals as they were the only two markets in the region where more than $1 billion worth of office assets was traded during the first six months of the year. Logging $3.1 billion in sales since January, Washington, D.C. boasted the highest sales volume in the region and second-highest nationwide (close behind the Bay Area).
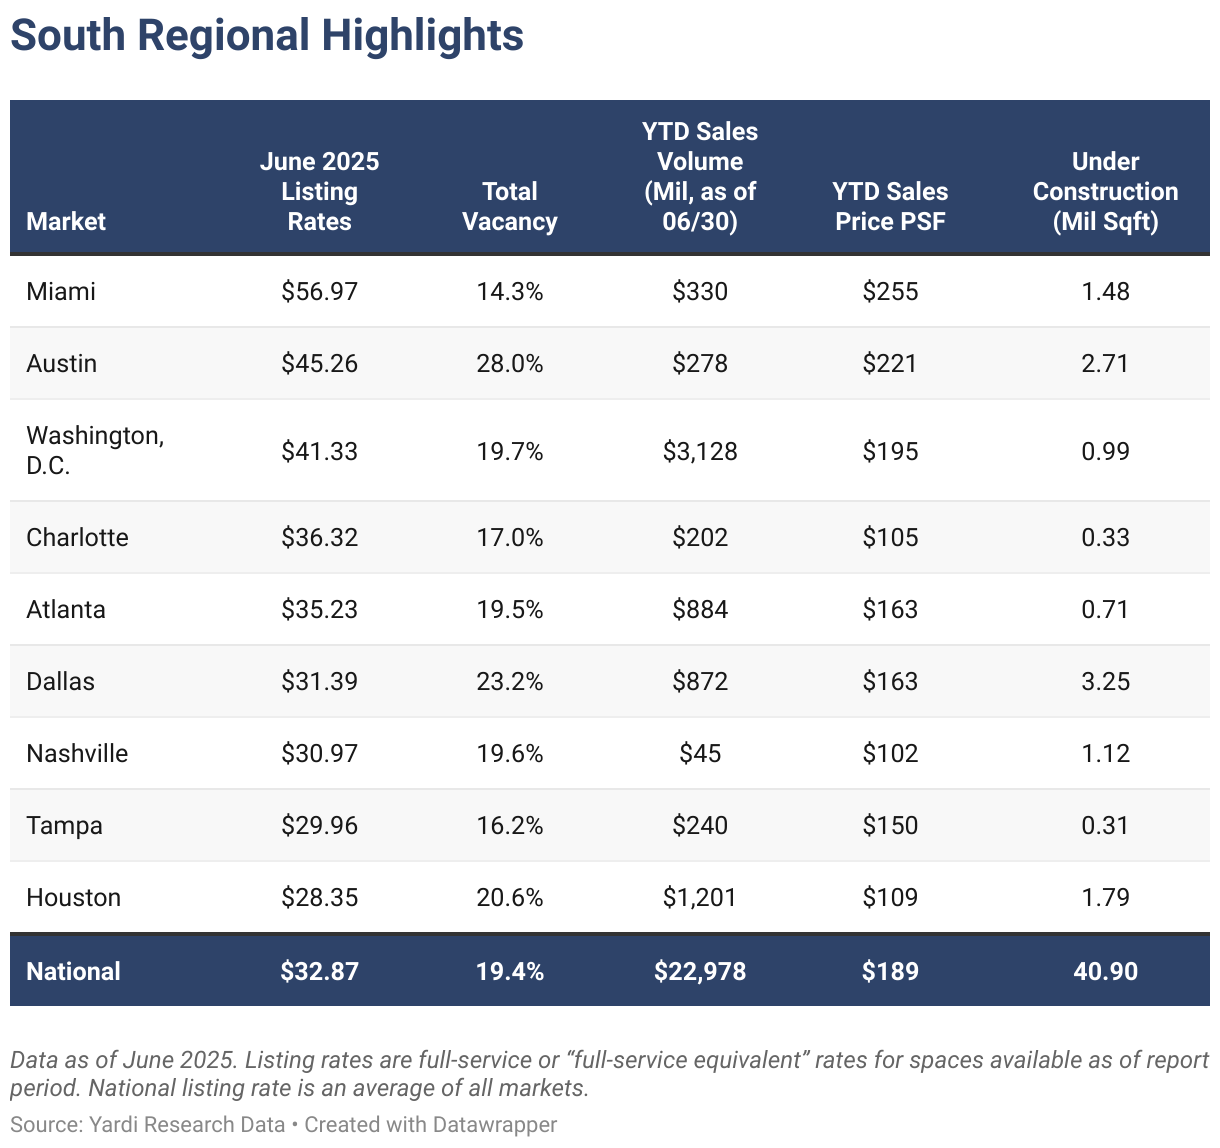
Further west, Houston office sales totaled $1.2 billion through June, which was the second-most among top Southern U.S. markets and the fifth-largest nationwide. At the same time, Houston was one of the most affordable office investment markets in the region as properties here changed hands for nearly $109 per square foot — third-lowest in the region and eighth-most-affordable investment market nationwide.
In fact, Texas markets dominated regional development as roughly 61% of office space under construction in the South was concentrated in Dallas-Fort Worth (3.25 million square feet), Austin (2.71 million square feet), and Houston (nearly 1.8 million square feet). Additionally, in June, the office development pipeline in the Dallas-Fort Worth metroplex was the largest in the South and second only to Boston on a national level.
Meanwhile, it was Miami that had the highest occupancy last month with a vacancy rate of roughly 14.3%. The Florida powerhouse was one of only three Southern office markets to log vacancy rates lower than the national average of 19.4% in June. At the other end of the spectrum, the highest vacancy rates in the region last month were in Austin, Texas, (nearly 28%) and in Dallas-Fort Worth (23.2%), which also boast some of the largest office supply pipelines in the country.
Northeastern Markets
Boston Claims Biggest Pipeline, Manhattan Logs Lowest Vacancy
All Northeastern U.S. markets tracked for this report had vacancy rates below the national average of 19.4% in June with Manhattan, N.Y., remaining among the tightest nationwide at 15.2%. And, in most other respects, Manhattan had the highest values in the region last month, including highest office listing rates (nearly $68 per square foot); highest sale price ($437 per square foot); and largest year-to-date sales volume ($2.7 billion through June).
Even so, the largest office supply pipeline was in Boston. Developers here had nearly 6 million square feet of office space under construction in June, which was the most sizeable development pipeline among all of the office markets analyzed nationwide for this report.
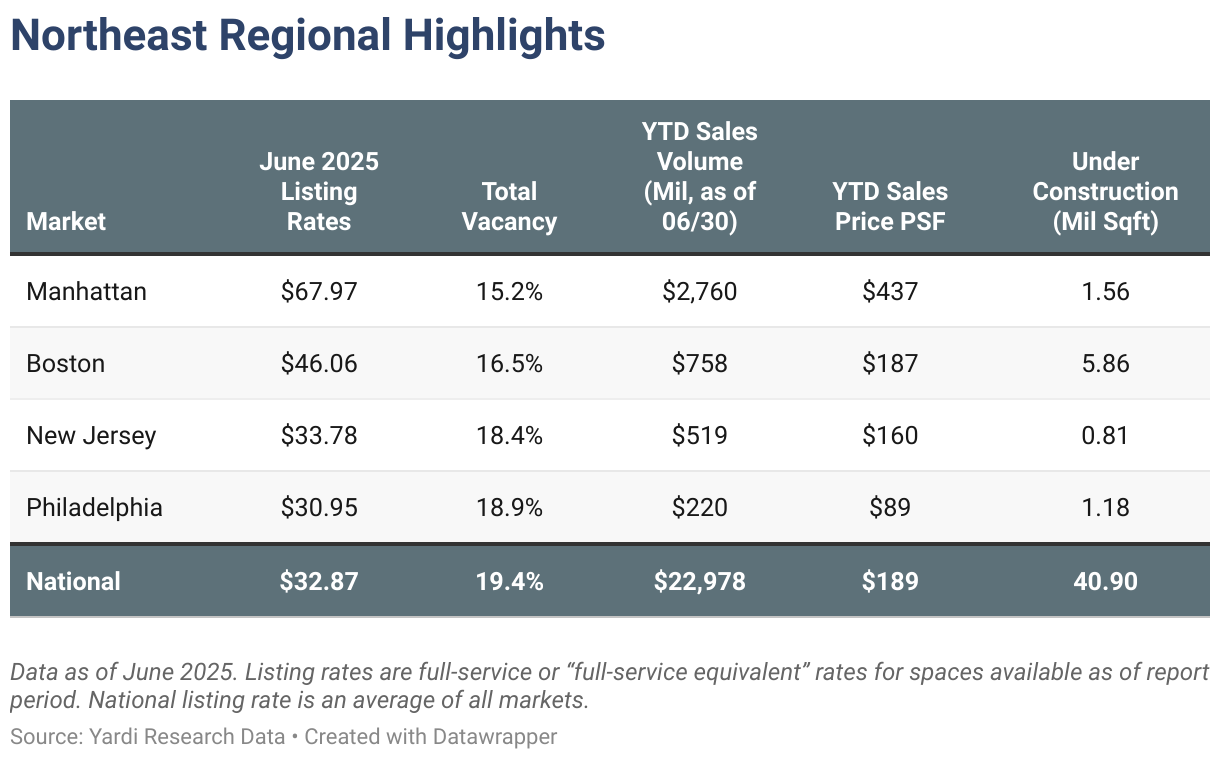
In this case, Philadelphia held its position as one of the most affordable major office markets in the U.S. as asking rents here averaged just under $31 per square foot in June, following a slight 2% dip year-over-year — the lowest listing rate in the region and 10th-most affordable nationwide. The market was also one of the most affordable office investment markets this year: Office assets traded here during the first six months of the year sold for an average price of $89 per square foot, which was the lowest in the Northeast and the third-lowest among top office markets nationwide.
Office-Using Employment
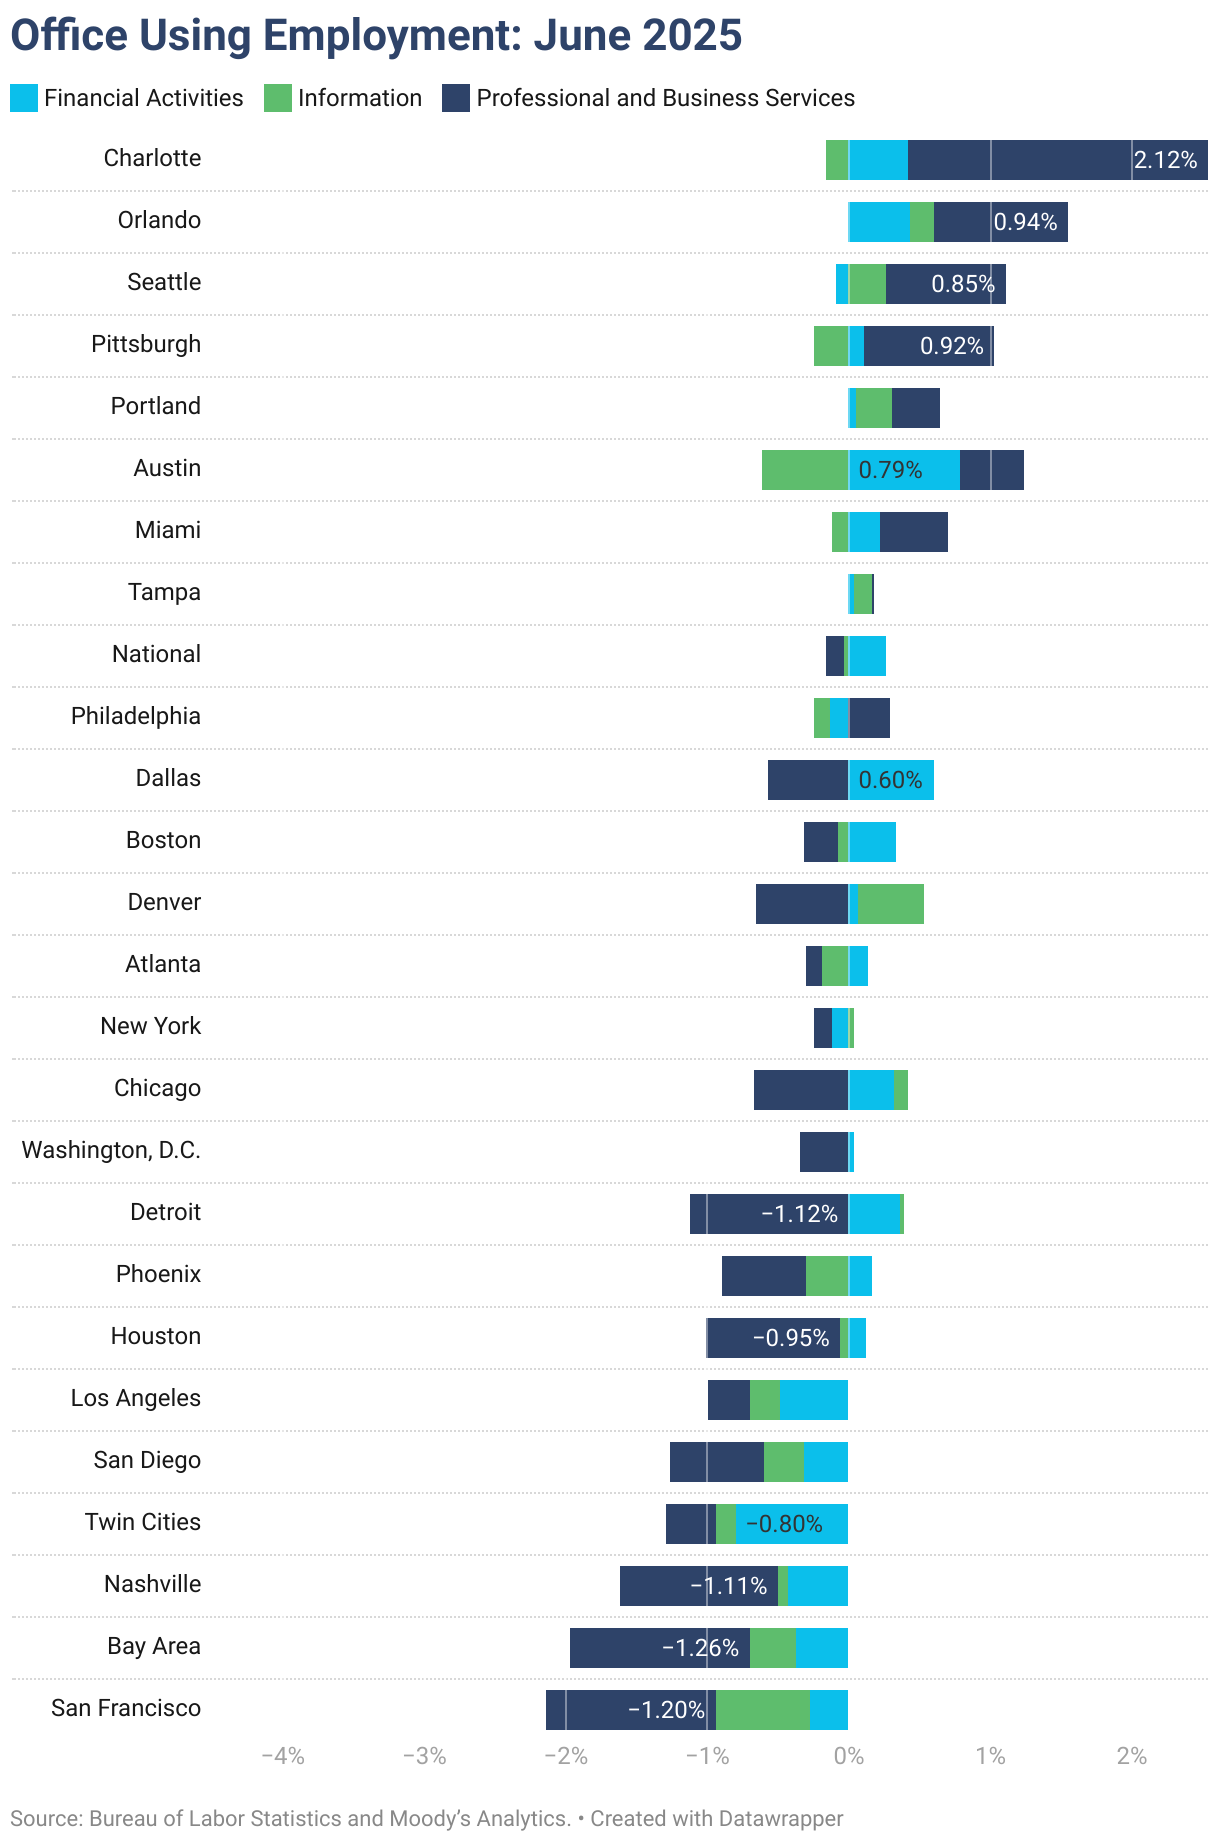
Slow Job Growth Compounds Effects of Hybrid Work on Office Utilization
Finally, analysis of recent labor market data shows that office-using sectors have seen an increase of just 0.1% in the last 12 months — which is troublingly weak growth for an office sector that still yearns for pre-pandemic level utilization. That said, expectations may need to be adjusted as remote and hybrid work, as well as ongoing technology absorption across a variety of industries, continue to push for a transformation of the office sector.
In fact, that transformation is already seeing increasing support for office property conversion to other uses, which would, ideally, repurpose the portion of office stock that was already slipping prior to the pandemic in terms of quality and repositioning potential.
Methodology
This report covers office buildings that are 25,000 square feet or larger. Listing rate and occupancy information was based on Yardi Research data.
- Listing rates are full-service rates or “full-service equivalent” for spaces that were available as of the report period.
- Vacancy refers to the total square feet vacant in a market (including subleases) divided by the total square feet of office space in that market. Owner-occupied buildings are not included in vacancy calculations. For reporting purposes, A and A+/trophy buildings were combined.
Stages of the supply pipeline:
- Planned — Buildings that are currently in the process of acquiring zoning approval and permits, but have not yet begun construction.
- Under Construction — Buildings for which construction and excavation has begun.
Office-Using Employment is defined by the Bureau of Labor Statistics as including the sectors Information, Financial Activities, and Professional and Business Services. Employment numbers are representative of the Metropolitan Statistical Area and do not necessarily align exactly with CommercialCafe market boundaries.
Sales volume and price-per-square-foot calculations for portfolio transactions or those with unpublished dollar values were estimated using sales comps based on sales that were similar in terms of the market and submarket; use type; location and asset ratings; sale date; and property size.
Market boundaries in the CommercialCafe office report coincide with markets defined in the CommercialCafe Markets Map and may differ from regional boundaries defined by other sources.
Fair Use & Redistribution
We encourage and freely grant you permission to reuse, host, or repost the research, graphics, and images presented in this article. When doing so, we kindly ask that you credit our research by linking to CommercialCafe.com or this page so that your readers can learn more about this project, the research behind it, and its methodology. For more in-depth, customized data, please contact us at [email protected].