Which U.S. Metros Are the Top Millennial Magnets?


Millennials are the largest working-age population in the U.S. They’re currently living their most influential years as they become decision-makers and leaders of their communities, while also continuing to influence culture as only a younger generation can. As such, understanding the preferences and values of this age group can shed light on the shape of the country’s future for decades to come. And, there may be no better way to do that than by tracking where Millennials choose to live.
So, in an attempt to determine which metro areas were some of the most attractive destinations for Millennials, we conducted a two-part study of both large and midsized metros to highlight their performances across a variety of metrics. Specifically, we reviewed Millennial demographics, median earnings, educational attainment, health insurance coverage, cost of living (regional price parity) and unemployment rate.
Key Takeaways:
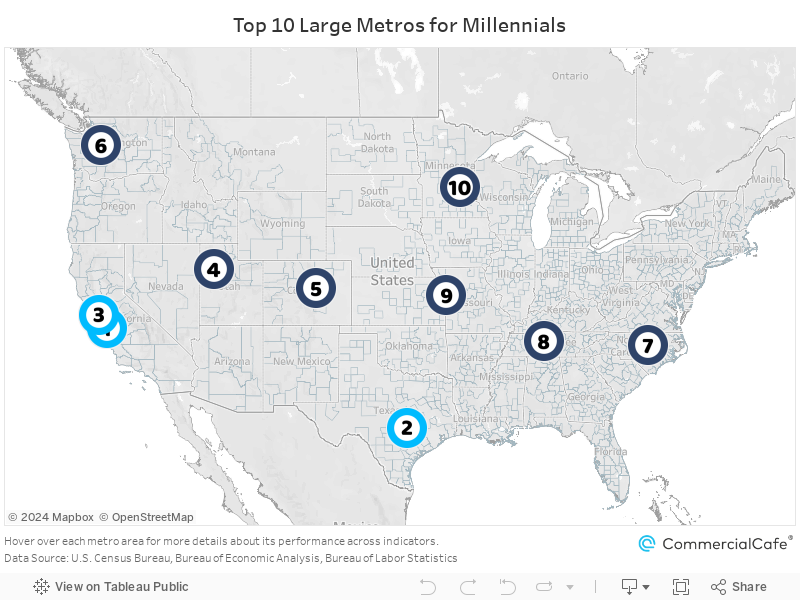
Large Metros
- San Jose, CA, topped the list, boasting the highest-paid and most educated Millennial workforce.
- Austin, TX, claimed the #2 spot with the highest percentage of Millennials in its total population (25.4%) in our study.
- Salt Lake City, Nashville, TN, and Kansas City, MO, each combined low costs of living with strong job markets for their Millennials.
- The top six large metros for Millennials were located in the West and the Southwest.
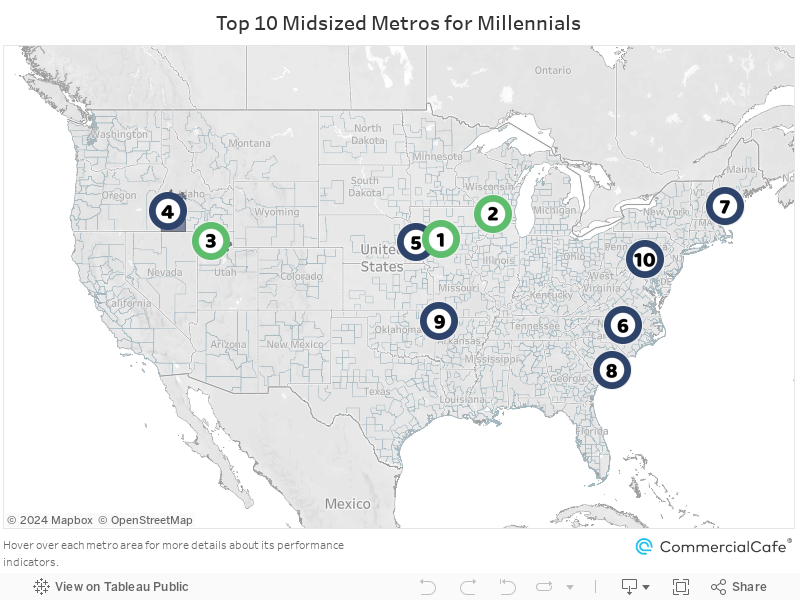
Midsized Metros
- Des Moines, IA, earned the title of best midsized metro for Millennials, thanks to the growth and overall percentage of the age cohort in its total population.
- Madison, WI, seized the #2 overall ranking with great showings for its educational attainment, health coverage and unemployment rate.
- The top five midsized metros for Millennials were in the Midwest and the West.
Best Large Metros for Millennials: San Jose, Austin & San Francisco Stand Out as Millennial Hotspots
When it comes to attracting some of the most talented professionals across various industries, the pull of San Jose and San Francisco remains unrivaled. Nevertheless, a host of other metro areas across the country — such as Kansas City; Salt Lake City; or Denver — have also become strong contenders, aided by relative affordability when compared to their coastal counterparts, as well as rich local culture and recreational opportunities.
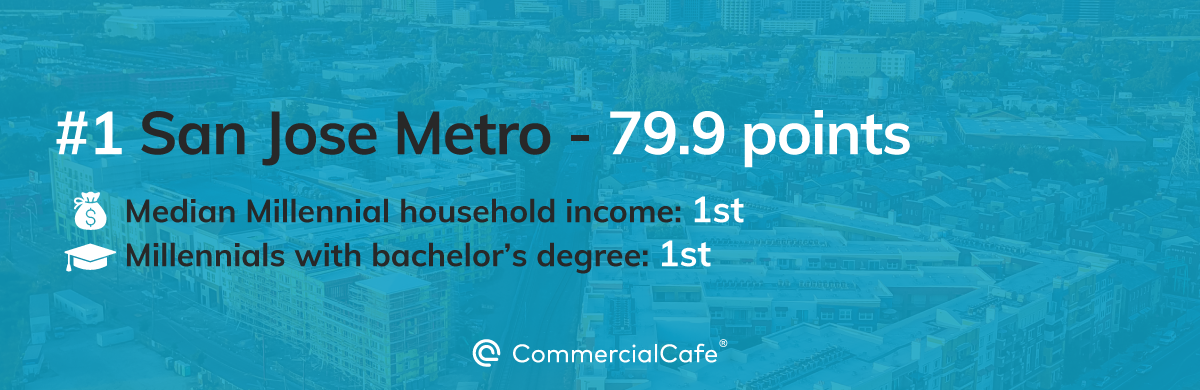
Given the proximity of Silicon Valley, San Jose, CA, has been a veritable magnet for big business and some of the most highly regarded and paid talent in the industry for years. Specifically, San Jose’s Millennials earned a median income of $163,291 per household — the highest figure on this list. That put the city ahead of San Francisco by a margin of nearly $20,000, as well as Seattle by roughly $55,000.
Next, the San Jose metro claimed first place for its Millennial population’s educational attainment levels, with more than 61% of residents from this age group holding at least a bachelor’s degree. Of course, this was not surprising given the talent provided to the region by educational institutions such as Stanford University, San Jose University and Santa Clara University.
Finally, San Jose cemented its best overall performance with a top placement in employer-sponsored health insurance, as well as the second-lowest unemployment with a 2.1% rate recorded in December 2022.

With Millennials making up one-quarter of the metro’s population, Austin, TX, took the top spot for the percentage share of this age cohort within the total population. In raw numbers, 568,373 Millennials have made the city their home. The metro coupled this with another strong demographic performance as it witnessed a 15.7% boost in its Millennial population between 2017 and 2021 — the third-largest uptick in the rankings. Austin also had a solid result for its educational attainment indicator with more than half of its Millennials holding a bachelor’s degree or higher.
Meanwhile, the cost of living was another key feature of the Austin metro area’s popularity. Although the Southwest city finished in fifth place in terms of its regional parity scores (RPP), Millennials in Austin can still expect to spend 45.7% less on their monthly rent than those in San Francisco, according to RentCafe’s living cost tool.

San Francisco’s third place finish featured two runner-up results, the first of which was for Millennial median household earnings. Specifically, at $143,520 per year, Millennials in San Francisco were behind only San Jose and well ahead of other metros in this ranking.
San Francisco also went toe to toe with neighboring San Jose in terms of the educational attainment levels of its Millennial residents. Just 1% away from first place for this metric, 59.1% of San Francisco Millennials held a bachelor’s degree or higher. What’s more, as the metro with the largest overall population in the rankings, San Francisco also boasted more than 1 million Millennial residents — the largest number overall.
Although the city didn’t rank first for any individual indicator, it cemented its top three overall spot with the third-highest health insurance coverage (73%), as well as the fourth-lowest unemployment rate (at 2.4%).
However, where San Francisco lost ground to all other metros was in its living costs: A regional price parity score of 119 meant that goods, services and housing rents were 19% higher here than the national average.
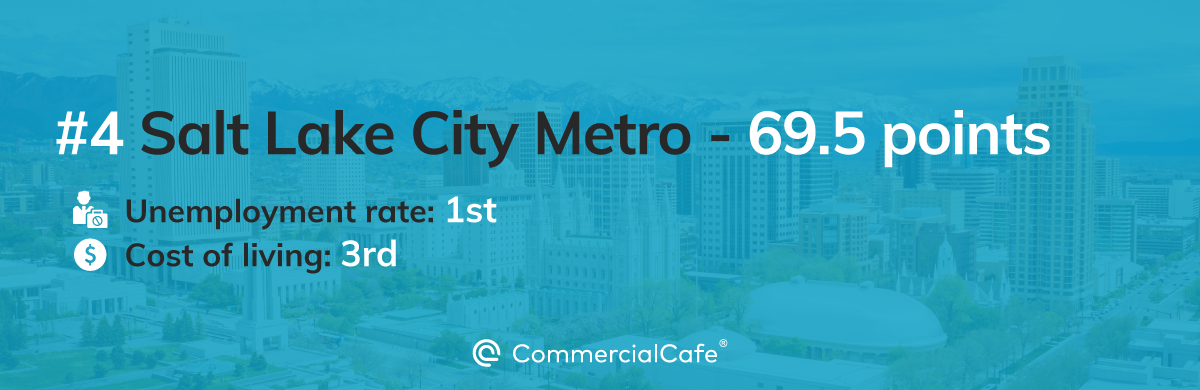
Salt Lake City garnered significant points for having the lowest unemployment rate among the entries. Accordingly, this demonstrated the city’s excellent job market, which is a function of a diversified economy driven by the Wasatch Front urban corridor. Moreover, the city’s 2.0% unemployment rate was also remarkable considering the fact that the 3.5% recorded at the national level at the end of last year was already historically low.
Additionally, Millennials in Salt Lake City made up a 24% share of the metro’s population — an indication of the affordable lifestyle and the many outdoor activities available within the city’s valley and surrounding mountains.

With a 16.3% increase, Denver recorded the largest percentage increase in Millennial residents, adding 101,104 residents from this age group between 2017 and 2021. The metro also ranked third for its share of Millennials within the total population.
At the same time, the city’s Millennials ranked fifth in terms of both household income and educational attainment. More precisely, their median earnings were $95,233 per year, and almost half of people in this bracket held a bachelor’s degree or higher.
Overall, Denver has put itself in a great position to accommodate a growing number of Millennials looking for an alternative to the nation’s coastal hubs. Previously an economy focused on the energy industry, it’s become increasingly diversified with important contributions from the health care and tourism sectors.
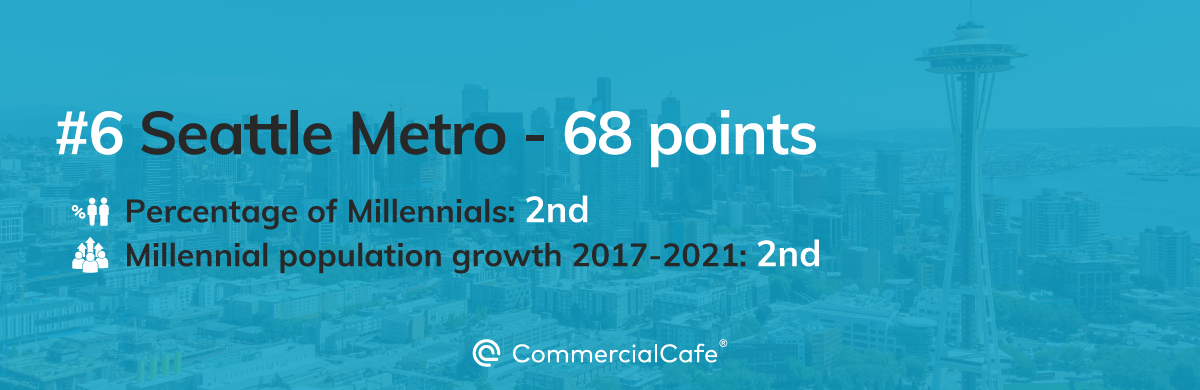
Seattle landed in second place for both its percentage increase of Millennial residents and their share of the overall population. Specifically, Seattle witnessed an increase of 15.7% for this age group between 2017 and 2021 as their numbers grew by 133,432. Presently, Millennial residents total 980,821, making up 24.7% of the metro’s population.
According to the most recent U.S. Census data, the average household income for Seattleites between the ages of 25 and 44 was roughly $108,134 per year. Additionally, the metro was part of a small group of West Coast cities (which includes San Jose and San Francisco) with median household earnings above the $100,000 mark. And, while the tech industry has undoubtedly played a transformational role for Seattle, its presence has also had an effect on the metro’s affordability as it registered the second-highest cost of living across the ranking, just behind San Francisco.
Still, beyond the transformation to the economy, the benefits of living in the Pacific Northwest metro are perhaps best summarized in the description chosen by Microsoft when recruiting new staff to the city back in 1980: In a large display ad, the text included: “Mountains, ocean, desert, rain forest, rivers and lakes all within easy reach.”
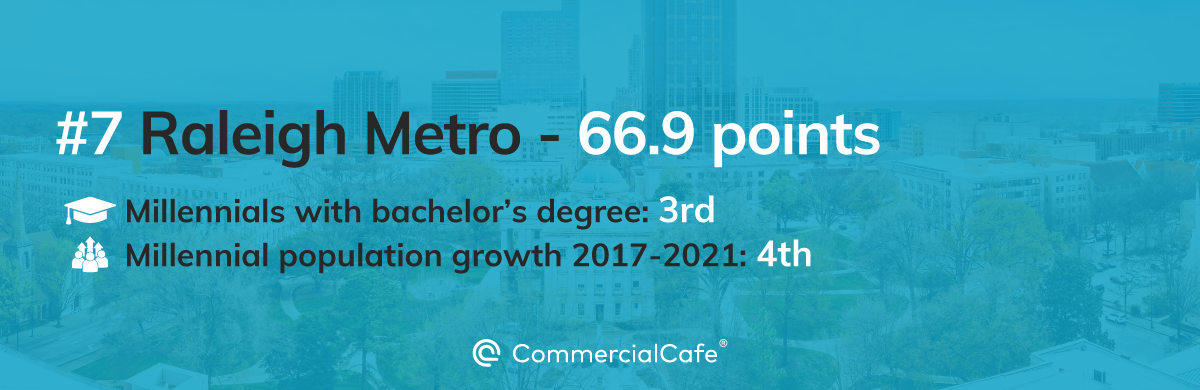
The number of Millennial residents in Raleigh, N.C., with a bachelor’s degree or higher was 53.7%. That was a strong result that owed much to local, tier one research universities (such as North Carolina State University). It was also high enough to garner the North Carolina metro a third-place finish for that metric. Additionally, through the Triangle Research Park, the metro has formed a strong post-study work stream.
However, while the city boasted top educational attainment and local career opportunities, the Millennial incomes remained modest in comparison to other top 10 large metros. To that end, Raleigh finished seventh in terms of income with Millennials earning a median of $89,357. Yet, any strain felt in affordability was alleviated as the city was fourth-best in terms of regional price parity.
Finally, Raleigh saw the fourth-highest jump (13.9%) in its percentage of Millennial residents between 2017 and 2021.

Millennials in Nashville, TN, enjoyed the second-lowest cost of living among the 10 best large metros. According to the U.S. Bureau of Economics (BEA), living costs in this metro were 4.5% lower than the national average. The Tennessee city also ranked third in terms of its unemployment (2.3%), with only Salt Lake City and San Jose having lower rates.
Similarly, Music City increased by 41,058 Millennials from 2017 to 2021. That’s a growth rate of 10% throughout five years — the fifth-highest among the large metros — according to U.S. Census data.
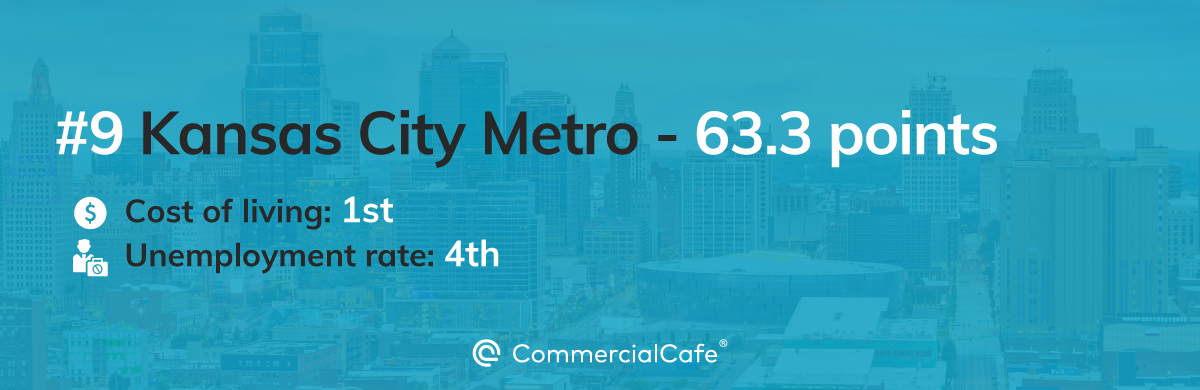
Notably, Kansas City, MO, had the lowest cost of living among all metros in our study. In comparison to the national average, living expenses in the city were 6.3% lower, according to the BEA. Additionally, at 2.4%, Kansas City also had the fourth-lowest unemployment rate in the ranking.
And, although Kansas City lost out on points due to its percentage of Millennials as compared to other large metros, it still recorded the seventh-highest increase — almost 10% — in its numbers for the age cohort.
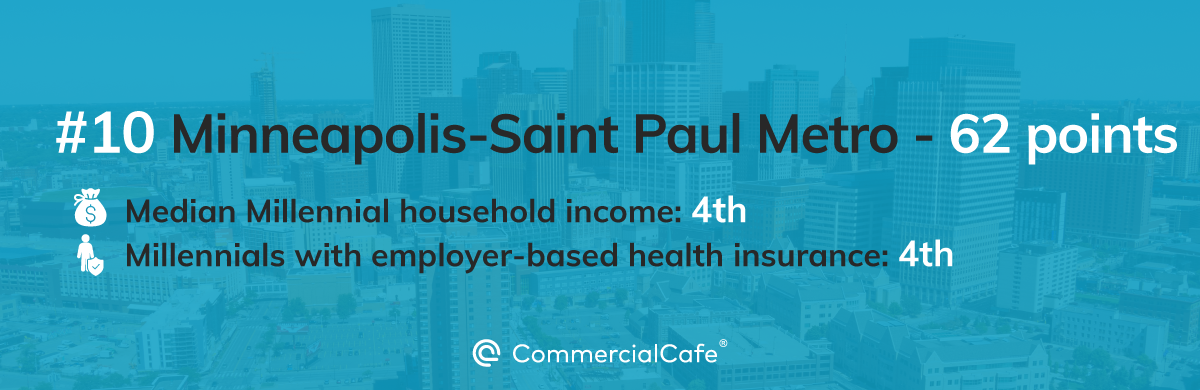
Minneapolis-St.Paul, MN, squeezed into 10th place, thanks to consistent — if unspectacular — performances across several metrics.
Here, the local economy benefited from having a high concentration of Fortune 500 companies — such as Target, United Health Group, Best Buy and CHS — all competing to attract the best talent from the labor market. Accordingly, this competition also benefited employees, with the metro landing in fourth place for its median household earnings of $96,262 per year.
Additionally, the Twin Cities had the fourth-highest number of Millennial residents with employer-based health insurance in our analysis with 72.7% covered.
Best Midsized Metros for Millennials: Midwest Entrants Des Moines, IA, & Madison, WI, Top List
The iconic large urban centers of the U.S. have become synonymous with modern American culture on a worldwide scale. That said, they’re also more expensive than ever. Thus, with rising costs of living and a lack of affordable housing in many of the most sought-after metro areas across the country, Millennials looking for the right place to settle down might be attracted to slightly more relaxed and affordable metros.
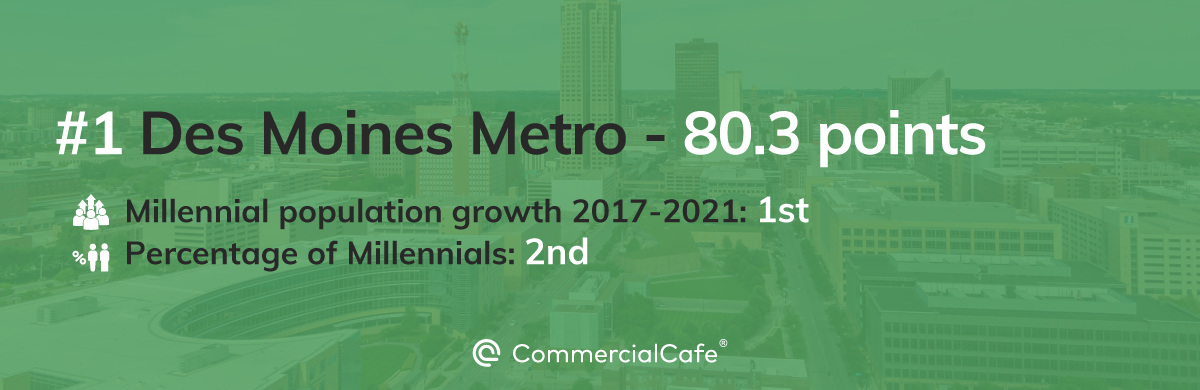
Des Moines, IA, witnessed the highest increase in its Millennial population between 2017 and 2021 with a 17% uptick. The Iowa capital also boasted the second-highest share of Millennials within its overall population among the midsize metro entries (21.9%).
To date, the metro has managed to strike a good balance between making itself attractive to Millennials, while still keeping its cost of living in check. Des Moines also did well in terms of affordability, with a second-best placement for its regional price parity, as well as a fourth-place finish for its median Millennial household income of $83,156 per year.
Known as a hub of the insurance industry, companies looking to establish their presence in Des Moines will benefit from the metro’s rich talent pool: Des Moines had the fourth-highest number of Millennials with a bachelor’s degree or higher (44.3%) among top midsized metros.
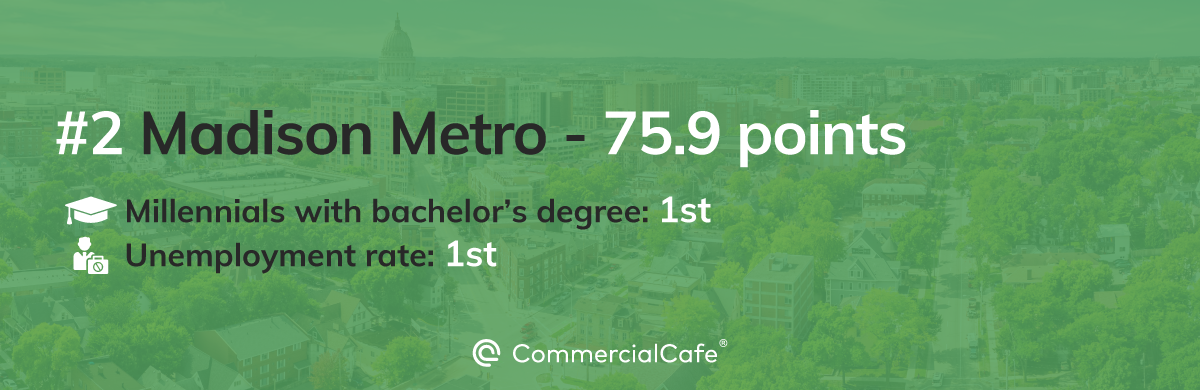
Madison, WI, had the most educated Millennial population of all of the midsized metros in our study with 56.2% holding a bachelor’s degree or higher. Additionally, the metro had the lowest unemployment rate (1.6%), while also recording the highest employer-sponsored health insurance coverage for its Millennials.
Here, Millennials benefited from the University of Wisconsin-Madison’s influence across the region. In founding both UW Health and the University Research Park, the university provides its health and STEM graduates with ample opportunities to live and work with a competitive salary in Madison after their studies. In fact, Millennial households in Madison also boasted the second-highest annual earnings on our list, with the average household income for this age group standing at $86,182.
And, while the number of residents between the ages of 25 and 44 years in Madison decreased during the surveyed period, the metro still had the third-largest proportion (21.9%) of this age cohort across its total population.
![]()
Ogden-Clearfield, UT, featured the third-highest household incomes for Millennials with median earnings of $83,359 per year, as well as the second-lowest unemployment rate on this list at 2.0%.
Furthermore, with the fourth-lowest cost of living, the metro area has also been a popular choice for Millennials looking for its all-round affordability. To that end, the metro witnessed a steady 9.3% increase in its Millennial demographic from 2017 to 2021. This demographic growth was the fourth-highest in the midsized metro ranking, as was Ogden’s current percentage share of Millennials within its total population (21.8%).

Boise, ID, had the second-highest increase in the number of Millennial residents from 2017 until 2021. In numbers, this 16% leap amounted to 22,027 more residents from this age group.
And, while the overall proportion of Millennials across the metro’s entire population was the third-smallest on the list (21%), the state capital also boasted one of the lowest unemployment rates, as well as relative affordability in terms of living costs.
What’s more, a 2021 CommercialCafe study looking at metro-to-metro migration trends showed that Boise attracted more people from Los Angeles than from any other midsized metro. For Millennials, the move from a large, coastal, California metro to Boise was likely made easier due to the city’s affordability and strong job market, not to mention the Mountain West nature.
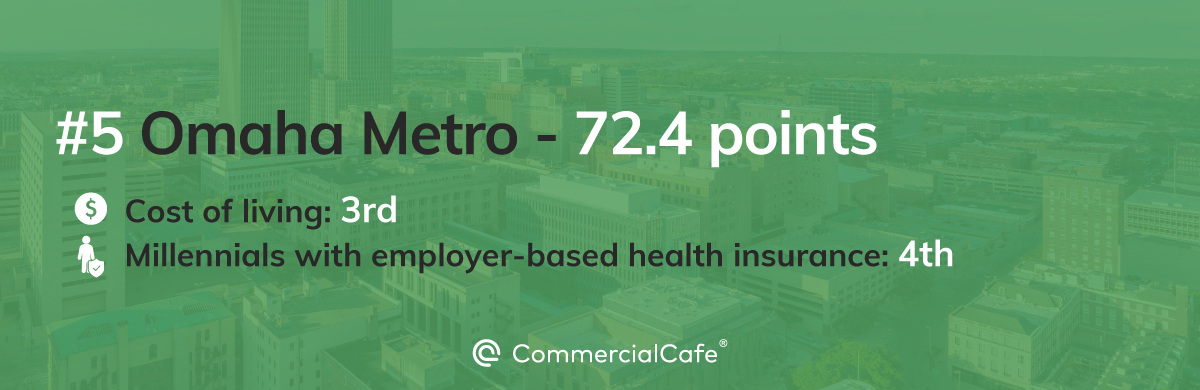
The Omaha (NE-IA) metro’s fifth-place finish was due to its consistently above-average showings across all metrics, rather than any individual standout performance.
Having said that, Omaha landed a podium finish in the regional price parity indicator, offering its Millennials the third-lowest living costs among the list of midsized metros, as well as the value of 70% employer-based health insurance coverage.
The city also ranked fifth in terms of both median Millennial household income ($80,495 per year) and unemployment rate (2.5%).
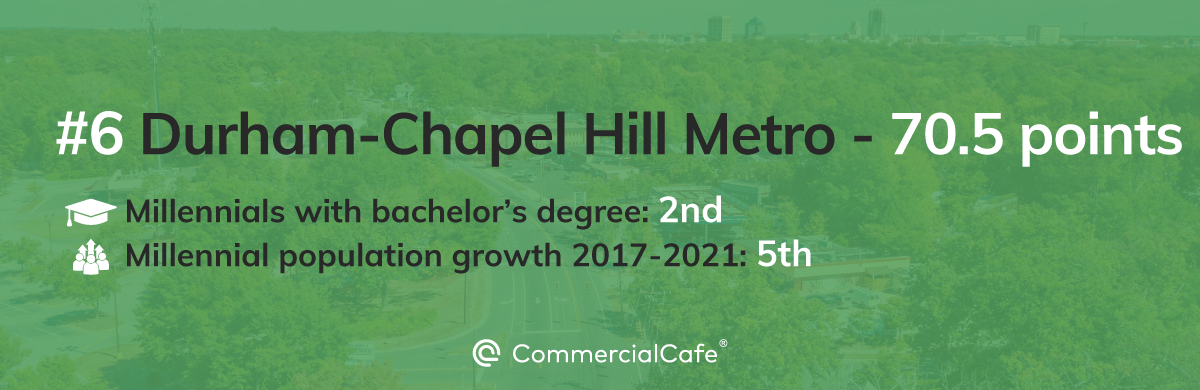
Known for its prominent universities (such as the University of North Carolina at Chapel Hill and Duke University in Durham), it’s perhaps no surprise that the Durham-Chapel-Hill, N.C., metro’s standout result was a second-place finish for educational attainment. Here, 52.8% of resident Millennials held at least a bachelor’s degree.
But, while Durham-Chapel Hill had the lowest overall median Millennial earnings in the top 10 midsized metros, it made up some of those lost points due to its relative affordability. Another metric that contributed to the metro’s tally was the area’s fifth-place finish for its 7.2% rise in residents from this age group among the metro’s overall population.
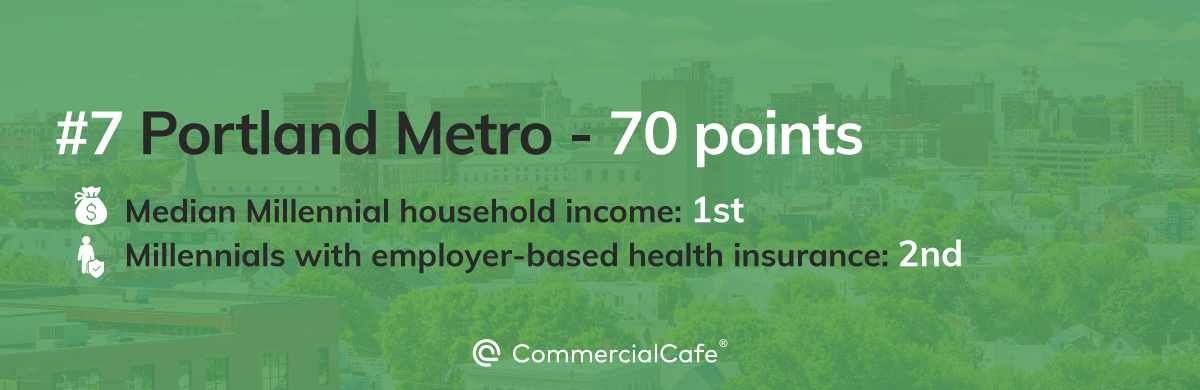
Portland, Maine, had the highest Millennial earnings in the top 10 with a median income of $88,766 per household, cushioning the effect of the highest living costs compared to other midsized metros. Likewise, in further strong showings, the coastal metro also reached second place in employer-purchased health insurance with 74.1% coverage of its Millennials. Finally, it had the third-highest ratio of residents between the ages of 25 and 44 years who held at least a bachelor’s degree (47%).
Despite having the lowest percentage share of Millennials, Portland experienced 10.3% growth in its number of residents from this age group across a five-year period — the third-highest in the midsized metro ranking.
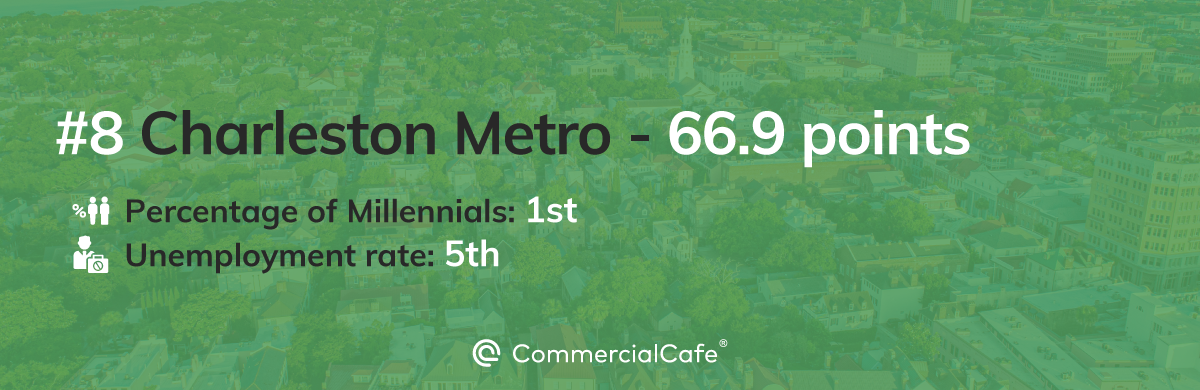
At 22.5%, Charleston, S.C., had the largest percentage share of Millennials within its total population among midsized metros with some 177,764 individuals in this age group calling the port city home.
Here, 42% of those between the ages of 25 and 44 years held a bachelor’s degree or higher — the sixth-best finish for this indicator across the ranking. Charleston also came in fifth for its 2.5% unemployment rate.
However, the metro also had a higher cost of living than most entries (with the exception of Portland, Maine), as well as the fourth-lowest median Millennial household income at $76,552 per year.
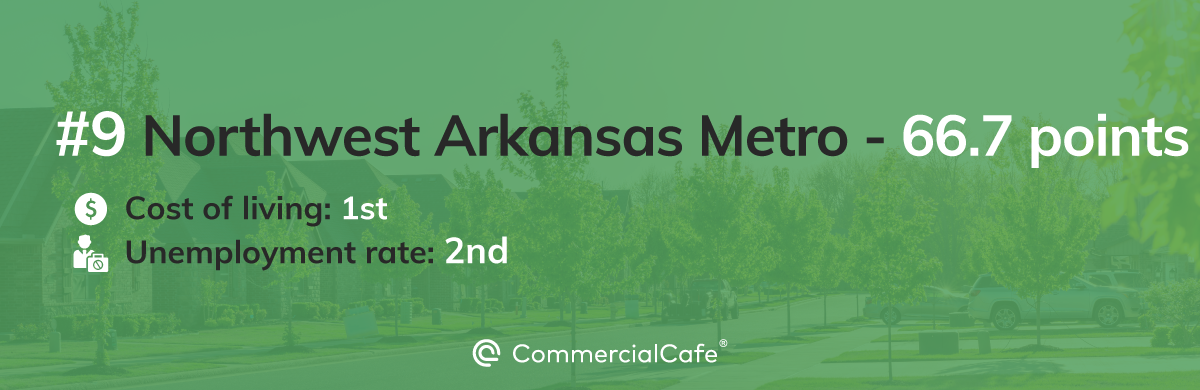
The Northwest Arkansas metropolitan area (AR-MO) had the lowest cost of living among all midsized metros in our ranking, as well the second-lowest unemployment at a rate of 2%.
And, while the area only recorded a slight increase in its Millennial resident numbers between 2017 and 2021, the percentage of individuals of this age cohort living in the metro was the fifth-highest at 21.7%.
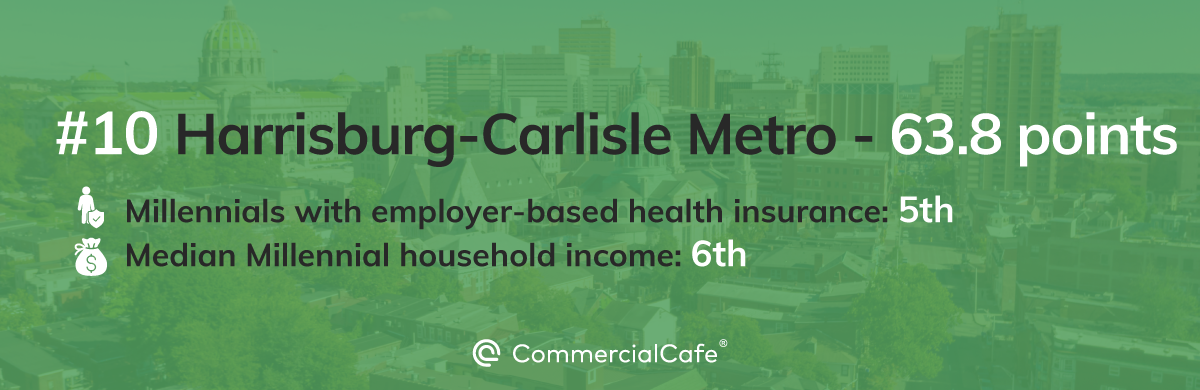
The Harrisburg-Carlisle, PA, metro secured a top 10 overall finish thanks to understated results across the board. First, its Millennials had the fifth-highest employer-sponsored health insurance coverage at 70%. Next, the metro’s Millennial residents registered the sixth-highest household earnings with a median $79,366 per year. Finally, the metro reached the seventh spot in the educational attainment category with 40% of its Millennials holding a bachelor’s degree or higher.
Methodology
A large metro refers to a metropolitan statistical area with a population of over one million residents. While a midsized metro refers to a metropolitan statistical area with a population from 500,000 up to one million residents.
To define Millennials, we used the 25 to 29, 30 to 34, and 35 to 39 age groups, as defined by the U.S. Census Bureau.
We ranked the best U.S. metro areas for Millennials based on seven select indexes. Each metro could score between zero and maximum points for each metric directly proportional to its performance in the respective index:
- Millennial population growth refers to the relative difference in each metro area’s Millennial population from 2017 through 2021, according to U.S. Census Bureau (0 to 15 points)
- Percentage of Millennials of the total population, provided by the U.S. Census Bureau. (0 to 15 points)
- Regional price parity (RPP) measures the cost of living in a region by comparing it to a national average, conventionally set at 100. In addition to housing costs, RPPs also cover all consumption goods and services. Values scored were the 2021 Bureau of Economic Analysis numbers. (0 to 15 points)
- Median Millennial household income includes income of the householder and all other individuals 15 years old and over in the household. Because many households consist of only one-person, median household income is usually less than median family income. Although the household income statistics cover the past 12 months, the characteristics of individuals and the composition of households refer to the time of interview. Thus, the income of the household does not include amounts received by individuals who were members of the household during all or part of the past 12 months if these individuals no longer resided in the household at the time of interview. Similarly, income amounts reported by individuals who did not reside in the household during the past 12 months but who were members of the household at the time of interview are included. However, the composition of most households was the same during the past 12 months as at the time of interview. Age group used: 25-44 years. (0 to 15 points)
- Metro-level unemployment rate in 2022, provided by the Bureau of Labor Statistics (0 to 15 points).
- Millennials with employer-based health insurance measures the percentage of Millennials covered by an employment-based health insurance plan. Values scored were 2021 U.S. Census Bureau demographic percentages. Age group used: 26-44 years. (0 to 15 points)
- Millennials holding a bachelor’s degree or higher is the percentage of individuals between the ages of 25 to 44 who are active within the labor force and have a bachelor’s degree. Values scored were based on five-year estimates of the U.S. Census Bureau’s American Community Survey. (0 to 10 points)


Matthew Preston
Content Writer, CRE News & Market Analysis
Matthew has covered commercial real estate for CommercialCafe since 2022. He focuses on the office and industrial sectors, reporting on leasing, development, and investment across national markets and individual submarkets. His work draws on data and original research. He also writes about demographic shifts and urban innovation in U.S. cities. The New York Times, The Real Deal, Bisnow, The Business Journals, and Yahoo Finance have cited his reporting.