April 2026 Industrial Report: Growing Demand for New Warehousing Spaces Amid Automation Adoption


Key Takeaways:
- Automation’s space-intensive nature and reliance on specialized structural features are driving the demand for new warehouses as modern buildings are far better positioned to support high-tech integration.
- After years of major market expansion, New Jersey is currently entering a period of readjustment with lower rent growth and higher vacancies following new supply deliveries.
- While construction activity in Phoenix has decelerated compared to 2021-2022 levels, the market still ranks third nationally with 7 million square feet of industrial space in the pipeline.
- Atlanta is outranked only by Dallas among top U.S. markets for total industrial sales volume, standing at $811 million in the first quarter.
Regional Highlights:
- California’s Central Valley industrial pipeline reached 8 million square feet following an 81% jump since February — the largest month-over-month increase across Western markets.
- Kansas City, Mo., witnessed the highest percentage increase in its sales activity across the region and one of the highest nationwide, resting at $101 million in year-to-date sales following a 627% hike.
- Houston stands out among Southern industrial markets due to its 8% vacancy rate, which was the lowest in the region and second-lowest nationally, behind Kansas City, Mo.
- With $784 million in year-to-date industrial sales, New Jersey ranks fourth nationally behind Dallas, Atlanta and Chicago with average prices of $292 per square foot.
Trends & Industry News
More Tech, More Space: Why Automation is Expanding the Industrial Footprint
Automation and artificial intelligence are increasingly common in warehousing operations, yet their implementation remains uneven. Contrary to earlier industry assumptions, the rise of technology has not actually lessened the demand for logistics real estate. This is partly due to consumer expectations for faster delivery, which has effectively absorbed the efficiencies gained through tech.
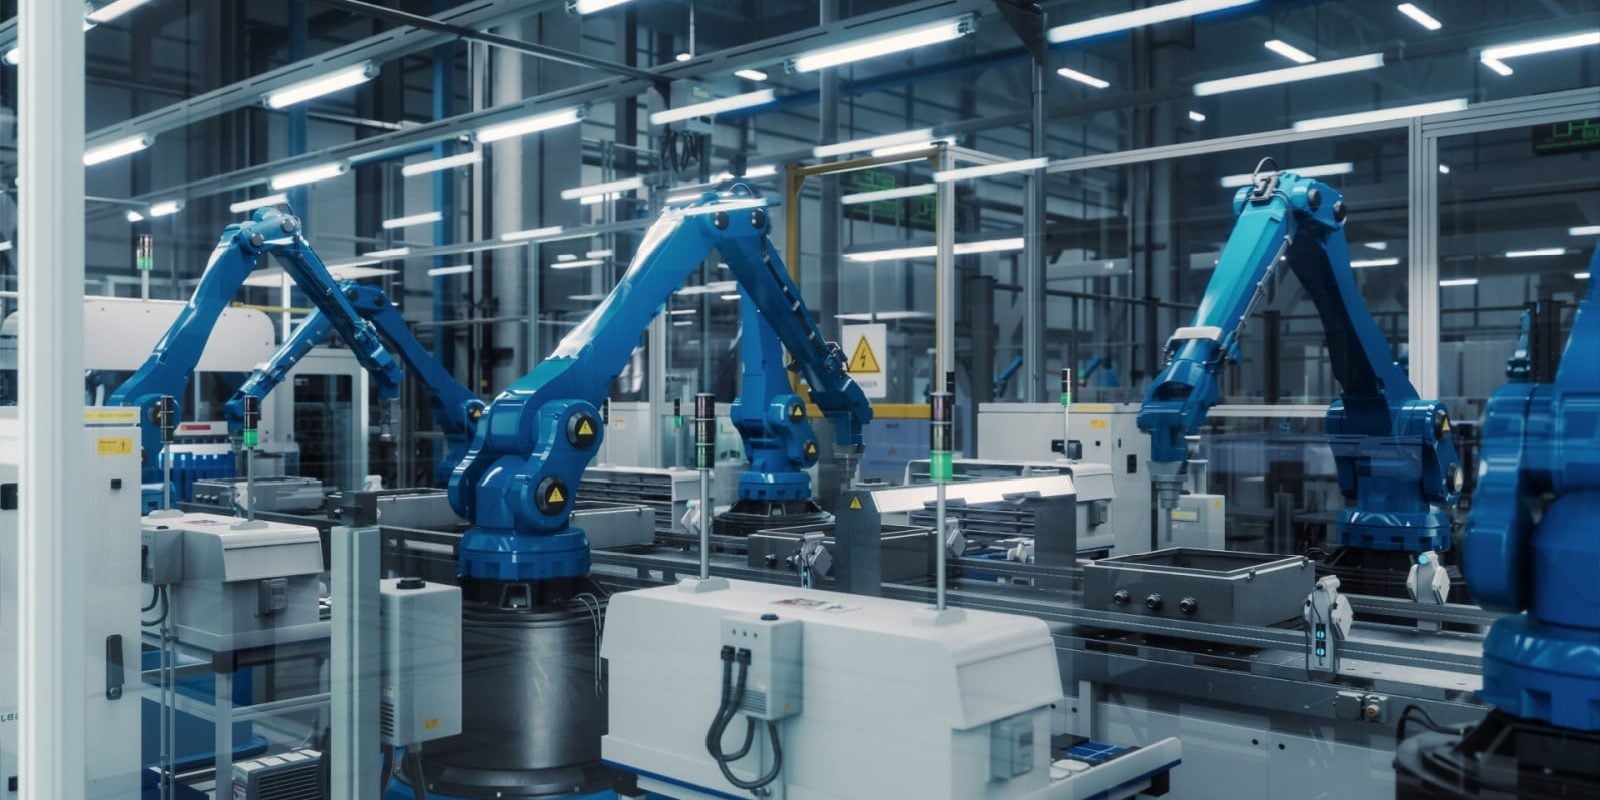
Additionally, automation is remarkably space-intensive: It requires flatter floors, higher clear heights, wider column spacing and specific layouts to facilitate the use of robotics, as well as internal product movement. As a result, these technical requirements often increase a firm’s total square footage needs, rather than decrease it.
Accordingly, the specific constraints of automated systems are currently driving sustained interest in new construction. That’s because modern facilities are structurally better equipped to handle AI integration, which explains why rent growth for newer assets remains resilient despite recent increases in overall market vacancies.
Furthermore, there’s continued strong interest in build-to-suit projects designed specifically for automated operations. Consequently, facilities that meet these modern requirements typically command higher rents, secure longer lease terms and maintain higher tenant retention than older, traditional assets.
Even with this interest, the transition to automation remains uneven due to limitations in building characteristics, high retrofit costs and power availability. To that end, access to sufficient power has become a central factor in site selection as grid capacity and the slow pace of utility upgrades often hinder implementation regardless of a tenant’s appetite. Even in prime locations, many older properties are simply not built for retrofitting due to their specific layout constraints or insufficient clearances.
Of course, this transition is expected to be a gradual evolution spanning many years: The pace of adoption is dictated by the replacement cycle of aging warehouse stock and infrastructure readiness, rather than technology alone. In fact, Prologis anticipates that, by 2035, approximately half of modern logistics space will feature some degree of automation, likely favoring modular and flexible systems over fully autonomous sites.
“As automation and optimization become more critical for operations – access to, and availability of power often becomes a focal point in site selection. Look for this to continue to be a key driver for industrial decision making.”
Peter Kolaczynski, Director, Yardi Research
Rents & Occupancy
New Jersey Market Resets After Prolonged Expansion
During the month of March, the national average for in-place industrial rents reached $9.03 per square foot. This figure represents a $0.04 increase from the preceding month and a 5.4% rise in the last 12 months. On a market-specific level, Atlanta maintains its leading position with in-place rents climbing 8.1% year-over-year (Y-o-Y). Next in the rankings for annual growth are Tampa, Fla., at 7.3%; Bridgeport, Conn., at 7.1%; and Miami at 7.0%.
Nationally, the vacancy rate finished at 9.3%, reflecting a 10-basis-point (bps) increase month-over-month and an 80-bps rise throughout the course of the last year. Interestingly, the pricing for newly signed leases in the last 12 months averaged $10.01 per square foot, which is $0.98 cents higher than the national in-place average. This spread between existing and new lease rates has plateaued at approximately $1 in recent months after two years of consistent shrinkage, suggesting that the pressure from the recent supply boom may finally be diminishing.
Yet, despite this trend at the national level, certain markets are still witnessing significant premiums for new industrial space. Namely, the most substantial spread was recorded in Bridgeport, Conn., where new leases cost $5.06 more per square foot than the market’s in-place average. Otherwise, Boston and Miami were the only other major markets to see premiums exceeding $3 per square foot at $3.73 and $3.23, respectively.
Meanwhile, the New Jersey market has entered a period of normalization following several years of exceptional expansion. Here, current in-place rent growth stands at 4.3%, which is among the lowest rates for top-tier markets. At the same time, vacancy in New Jersey climbed to 8.9% as a result of new supply deliveries and a deceleration in tenant decision-making. However, market fundamentals remain positive due to the region’s central location and proximity to the Port of New York and New Jersey. Plus, with a construction pipeline that has tapered off recently, in addition to stabilizing leasing activity, the market appears well-positioned for renewed rent growth in the medium term.
Supply
Phoenix Leads Nationally for Industrial Development as Percent of Stock
Currently, 367.7 million square feet of industrial space is under construction nationally, representing 1.8% of total stock. Within this environment, Phoenix remains one of the most prominent development markets in the country despite a shift from the frantic pace seen at the start of the decade (more than 70 million square feet of industrial projects were started between 2021 and 2022).
Today, Phoenix ranks third nationally in terms of total square footage under development with 18.7 million square feet of industrial space, trailing only Dallas and Houston. That said, when measured as a percentage of existing stock, Phoenix leads all top markets with 4.1%.
In this case, development within Phoenix has been characterized by high geographic concentration and a focus on specific property types. As such, nearly three-quarters of all space delivered since the beginning of 2021 is located within just three submarkets. Leading this group is Phoenix – West, which saw 38 million square feet delivered, accounting for 28.3% of the market’s total deliveries. Peoria, Ariz., followed closely with 36.5 million square feet or 27.2%, while Mesa, Ariz., recorded 25.3 million square feet to represent 18.9% of the total.
Even with the persistent supply boom in the region, infill assets have remained a tight segment of the market. Moreover, most properties recently completed in Phoenix consist of either large-scale, big-box spaces exceeding 100,000 square feet or smaller buildings situated within logistics parks.
Transactions
Atlanta’s Strong Start: Industrial Sales Activity Totals $811 Million in Q1
According to Yardi Matrix data, the industrial sector saw $15.5 billion in transactions during the first quarter of the year with assets trading at an average price of $138 per square foot. In spite of geopolitical instability and an oil price shock pausing anticipated rate cuts, total investment activity remains near the levels recorded at this same time last year.
In that vein, Atlanta totaled $811 million in industrial deals during the first quarter for the second-highest sales volume to date across the nation. Although average sales prices in the metro have dipped slightly compared to early 2025, they remain 13% higher than 2024 levels and have doubled since 2019.
Plus, Atlanta’s prominence as a premier logistics hub is supported by a significant transportation infrastructure advantage featuring one of the world’s busiest airports, as well as an expansive rail network and direct access to several major interstate highways. What’s more, its connectivity is further enhanced by its proximity to the Port of Savannah, Ga. These factors, alongside robust population growth and the availability of relatively inexpensive land, continue to attract third-party logistics providers looking to tap into national supply chains and Southeastern markets.
In particular, activity has been concentrated in the Lawrenceville, Ga., submarket of Gwinnett County, which has surfaced as an unexpected center for investment: In the first quarter alone, Lawrenceville recorded $154.7 million in transactions — a figure that nearly matches the combined sales totals from 2024 and 2025.
Western Markets
California’s Central Valley Industrial Pipeline Jumps 81% Month-Over-Month to 7.8 Million Square Feet
The cost of leasing industrial space continues to be steepest across Western industrial markets as the region fronts the rankings for industrial rents in March with California’s Orange County ($17.79), Los Angeles ($15.86) and the Bay Area ($14.82). In the West, the gap between in-place rents and those signed within the last 12 months exceeds the nationwide average of $1 in four of the nine markets in this region (California’s Bay Area and Central Valley; Portland, Ore.; and Phoenix).
With several large-scale projects breaking ground within the last month— such as Building 11 at Prologis International Park of Commerce (IPC) and two Costco warehouses in Tracy, Calif., — Central Valley’s industrial pipeline recorded an 81% month-over-month (M-o-M) increase. It was the highest monthly jump across major U.S. industrial markets, a surge from 4.3 million square feet to 7.8 million square feet. With that, it finished just behind an unchanged podium consisting of Phoenix (18.6 million square feet); Denver (8.4 million square feet); and Inland Empire, Calif. (8.1 million square feet).
In a 12-month period, Central Valley’s development expansion is even more remarkable: At 128% Y-o-Y, it’s the third-highest percentage increase in total industrial space under construction nationally, behind only Bridgeport, Conn., and Boston. Walmart’s 1.2-million-square-foot fulfillment center and 655,200-square-foot distribution facility developed by Trammel Crow for Home Depot in Stockton, Calif., among the most noteworthy projects under development.
At the same time, vacancy rates remain relatively high compared to the national average across most Western markets, apart from California’s Inland Empire and Los Angeles (both at 8.9%), as well as Orange County (7.2%). Likewise, the most substantial month-over-month reduction in industrial vacancies across Western markets took place in Orange County (-100 bps).
Once again, Los Angeles regains its dominant position in the region for the industrial sales volume indicator, totaling $656 million from the start of the year. That’s a 57% month-over-month increase, which enabled it to overtake Phoenix ($636 million in year-to-date in industrial sales) and crack the national top five for this metric. Otherwise, in terms of sales prices, the Bay Area maintains its lead with an average of $304 per square foot, despite a 21% decline from the prior month. Another Western market with a noteworthy decline in its average industrial sales prices was Inland Empire, Calif., where the year-to-date price per square foot of space fell from $228 in February to $165 in March.
Midwestern Markets
Kansas City, Mo., Sales Volume Jumps 627% in April as Industrial Sales Activity Accelerates Across Midwest
Sales activity has accelerated across several Midwestern industrial markets since February. Month-over-month, Kansas City, Mo., witnessed the highest percentage increase across the region, as well as one of the highest nationwide to rest at $101 million in year-to-date sales following a 627% increase. Next, Columbus, Ohio, totaled $235 million in industrial deals in March for a 225% jump from the previous month, while Chicago’s 183% growth took its sales volume total from $280 million to $792 million. There’s been movement in the average sales price ranking, as well, with Kansas City ($154 per square foot) taking over the first spot from Indianapolis after the former’s 107% increase from the previous month.
Since the start of the year, Chicago has been the only market within the region with industrial vacancies consistently above the national rate. For comparison, vacancies remain stable in St. Louis (6%) with minimal movement in Indianapolis; Kansas City, Mo.; and Detroit. With the exception of the latter, all of these markets have witnessed significant reductions in their average industrial vacancies throughout the course of the last 12 months. St. Louis stands out with a 310-bps reduction, followed by Kansas City (-200 bps) and Indianapolis (-160 bps).
The most significant month-over-month increase in industrial construction across the Midwest took place in Detroit, where the pipeline expanded by 19% to reach 8.9 million square feet in March. Not to be outdone, projects currently in the pipeline in Columbus, Ohio — which continues to outrank Chicago for total square footage of industrial space under construction — account for roughly 3.6% of the total stock for the second-highest share nationally, behind Central Valley, Calif. Then, when factoring in planned projects, the share rises to 5.2% of the total inventory — once more, one of the highest percentages across major U.S. markets.
Meanwhile, rents across the region remain stable with comparatively tight lease spreads. For example, the gap between in-place leases and the 12-month average in the Twin Cities and Detroit was about 1%, whereas Columbus and Indianapolis had double-digit spreads (10% and 12%, respectively). In any case, Kansas City, Mo., remains one of the most cost-efficient options not just in the Midwest, but nationally, as well.
Southern Markets
Houston Vacancy Contracts 70 bps to 5.8%, 2nd-Lowest Rate Nationally
In Nashville, Tenn., the variance between in-place rents and leases signed in the last 12 months rose to 34%, translating to a $2.40 premium. Further east, Miami’s 24% gap resulted in an even more significant $3.20 premium, while Dallas’ premiums in March averaged $2.20. In this region, March lease rates in Miami ($13.52 per square foot) and Baltimore ($9.34 per square foot) were the only ones across the South to finish above the national average. At the opposite end of the spectrum, the $4.41 per square foot rate in Memphis, Tenn., was the lowest across major U.S. markets in the month of March.
Meanwhile, Atlanta joins Dallas in the ranking for the highest volume of year-to-date industrial sales, outranking the likes of Chicago, New Jersey and Los Angeles at the national level. More precisely, Dallas totaled $1.18 billion with average prices of $142 per square foot, while Atlanta reached $811 million after an 89% jump from the previous month. Atlanta also boasted the highest increase in industrial deals year-over-year across the South (268%).
Not to be outdone, Baltimore and Tampa, Fla., are two Southern industrial markets that stand out when it comes to their year-over-year pipeline expansion rates: With 125% and 98%, respectively, both had relatively modest baselines (1.6 to 1.7 million square feet in 2025). On the other hand, Houston’s 47% hike took its pipeline from 14.7 million square feet of industrial space to 21.6 million square feet, or 3.1% of current stock. And, if we include planned projects, the tally rises to 5.4% of stock.
Vacancies also continue to be high across major Southern industrial markets with the likes of Memphis, Tenn.; Miami; Charlotte, N.C.; and Tampa, Fla., all sporting rates above the national average of 9.3%. Conversely, Houston not only remains well below that, but rates here have also gone down another 70 bps in April to land at 5.8%. That’s the second-lowest vacancy average nationally, behind only Kansas City, Mo. Finally, there’s been minimal movement in occupancy numbers compared to the previous months in Nashville, Tenn.; Dallas; and Atlanta.
Northeastern Markets
New Jersey Industrial Sales Volume Hits $784 Million Following 80% M-o-M Increase
Industrial development across the Northeast is proceeding at an even, if more temperate, pace with Philadelphia’s 9.5% M-o-M bump being the only remarkable upwards movement in the region’s pipeline. As of March, roughly 5.1 million square feet of industrial space was under construction in Philadelphia, whereas New Jersey’s pipeline contracted by 21% to rest at roughly 7.2 million square feet. And, despite minimal increases compared to the previous month, Bridgeport, Conn.’s industrial space expanded by a massive 1,001% Y-o-Y, thanks in large part to a massive 3.2-million-square-foot Amazon robotics fulfillment center is under construction on the Waterbury-Naugatuck line. Currently, projects under development in this market make up approximately 2% of total industrial stock.
In this region, Boston and Philadelphia have the highest vacancy rates at 12.2% and 9.4%, respectively. Throughout a 12-month period, these two markets witnessed 190- and 150-bps increases, respectively. On the contrary, vacancies are still below the nationwide average in Bridgeport, Conn., and New Jersey, but both are edging closer to that threshold.
The difference between in-place rents and deals signed in the last 12 months in New Jersey — the most expensive market for leasing industrial space in the Northeast at $12.44 as of March — was relatively small (7%) compared to the consistently wide lease spreads observed across the region. For comparison, Bridgeport, Conn.’s gap extends to 49%, translating to a $5.10 premium on new leases, while Boston’s 31% means a $3.70 premium.
New Jersey also ranks fourth nationally for highest volume of industrial sales to date, behind Dallas, Atlanta and Chicago. In the Garden State, some $784 million worth of assets changed hands since the start of the year, marking an 80% M-o-M. Additionally, average prices hit $292 per square foot for a 14% increase since last year. Philadelphia also ramped up its sales activity in March, increasing its total by 319% to reach $564 million and an average price per square foot of $154.
Economic Indicators
How Competition from Gig & Hospitality Jobs is Challenging Warehouse Staffing
Data from the Bureau of Labor Statistics indicates that warehouse employment has experienced a continuous decline in the last year. As of March, the sector saw a year-over-year decrease of more than 50,000 positions, representing a 2.7% drop in the total workforce.
This downward trend is not the result of a lack of available job openings, but is instead primarily driven by a persistent shortage of workers. Industry surveys highlight the severity of this issue with more than 70% of respondents reporting significant challenges in both hiring and retaining employees. These difficulties are further underscored by an annual turnover rate in the sector that’s estimated to be between 35% and 40%.
It’s worth noting here that the labor shortage is influenced by heavy competition for entry-level workers from the hospitality and gig economy sectors. These alternative industries often appeal to prospective employees because they’re typically less physically demanding and offer greater scheduling flexibility than traditional warehouse roles.
To combat these staffing hurdles, some firms are accelerating their adoption of automation and artificial intelligence. At the same time, there’s a still significant lack of skilled labor capable of supporting these new, tech-centric roles.
So, while AI and automation are becoming more integrated into logistics operations, they’re currently functioning as a supplement to human labor, rather than a wholesale replacement of the workforce.
Methodology
The monthly CommercialCafe national industrial real estate report considers data recorded throughout the course of 12 months and tracks top U.S. industrial markets with a focus on average rents; vacancies (including subleases, but excluding owner-occupied properties); deals closed; pipeline yield; forecasts; and the economic indicators most relevant to the performance of the industrial sector. Listing rate and occupancy information was based on Yardi Research data.
- Average Rents: Provided by Yardi Market Expert, a cutting-edge service that uses anonymized and aggregated data from other Yardi platforms to provide the most accurate rental and expense information available.
- Vacancy: The total square feet vacant in a market, including subleases, divided by the total square feet of industrial space in that market. Owner-occupied buildings are not included in vacancy calculations.
Stages of the supply pipeline:
- Planned: Buildings that are currently in the process of acquiring zoning approval and permits, but have not yet begun construction.
- Under Construction: Buildings for which construction and excavation have begun.
Sales volume and price-per-square-foot calculations for portfolio transactions or those with unpublished dollar values are estimated using sales comps based on similar sales in the market and submarket; use type; location and asset ratings; sale date; and property size.
Year-to-date metrics and data include the time period between January 1 of the current year through the month prior to publishing the report.
Market boundaries in the CommercialCafe industrial report coincide with those defined by the CommercialCafe Markets Map and may differ from regional boundaries defined by other sources.
Fair Use & Redistribution
We encourage and freely grant you permission to reuse, host, or repost the research, graphics and images presented in this article. When doing so, we kindly ask that you credit our research by linking to CommercialCafe.com or this page so that your readers can learn more about this project, the research behind it and its methodology. For more in-depth, customized data, please contact us at [email protected].



Diana Sabau
Senior Content Writer, CRE News & Market Analysis
Drawing on years of intense research in the U.S. commercial real estate market at Yardi Matrix, Diana now applies her expertise as a writer for the CommercialCafe blog. Her articles focus on CRE investment, labor market trends, and technology, and have been picked up by prestigious publications including the New York Times, GlobeSt, The Real Deal, NAIOP, MSN, and Bisnow.