The 40 Most Sustainably Powered US Cities, Ranked


Nearly four decades after President Carter adventurously installed solar panels on the White House, America’s energy transition away from fossil fuels has seen only modest progress. 2007 marked the first year in history when more than half of the world’s population lived in cities, and the U.N. estimated that, by 2030, urban settings will be home to nearly two thirds of the global population. However, it was just in March 2017 that monthly electricity generation from wind and solar exceeded 10% of total U.S. electricity generation for the first time.
As America’s vibrant cities grow at an unprecedented pace, so does the importance of sustainable urban planning, power generation, transport systems, water and sanitation, and waste management. We set out to gauge how U.S. cities fare in terms of sustainability, and how the commercial real estate industry has embraced green building to support these efforts. We ended up with a ranking of 40 ‘sustainably powered’ U.S. cities. Read on to see how we did it and what the results show.
Methodology: Our Scores, Explained
For the purpose of this study, we looked at data on U.S. cities with a 100,000 population minimum, and present the 40 that achieved top scores: Arlington, Va.; Atlanta, Ga.; Austin, Texas; Baltimore, Md.; Boston, Mass.; Boulder, Colo.; Chicago, Il.; Cleveland, Ohio; Columbus, Ohio; Dallas, Texas; Denver, Colo.; Detroit, Mich.; Durham, N.C.; Eugene, Ore.; Hayward, Calif.; Houston, Texas; Indianapolis, Ind.; Knoxville, Tenn.; Lakewood, Colo.; Lancaster, PA; Las Vegas, NV; Los Angeles, CA; Minneapolis, MN; New York, NY; Oakland, CA; Philadelphia, PA; Phoenix, AZ; Pittsburgh, PA; Portland, OR; Reno, NV; Richmond, VA; San Antonio, TX; San Diego, CA; San Francisco, CA; Savannah, GA; Seattle, WA; St. Louis, MO; Tucson, AZ; Washington, D.C.; Yonkers, NY.
The starting point of our research was to learn how each of the 40 cities draws its power. We turned to the Carbon Disclosure Project for details on every municipality’s mix of energy sources (biomass, coal, gas, geothermal, hydro, nuclear, oil, solar, wind), as well as for information on carbon emissions generated by activity in each region. Because no data was available in CDP for Tucson and Dallas, we complemented the set with information sourced from the U.S. Energy Information Administration Electricity Data Browser, and Texas Electricity Ratings, respectively.
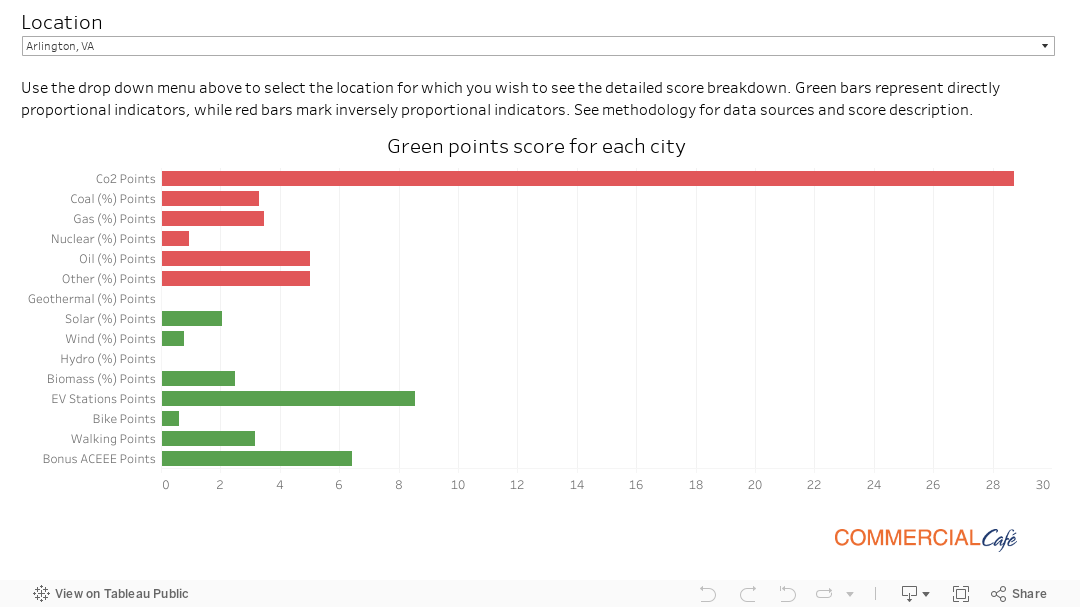
Depending on the indicator, the points were awarded either directly or inversely proportional to the use of each energy source. Directly proportional points (the more use of the resource, the higher the score) between 0 and 5 were attributed for use of hydropower (harnessing the energy of falling water or fast running water), geothermal (thermal power generation, where the heat source is the Earth’s internal heat), solar (direct or indirect conversion of energy from sunlight to electricity), wind (mechanical conversion of the energy of wind into electricity), and biomass (generating energy by burning wood and other organic matter). Between 0 and 5 points were awarded inversely proportionally (the less, the better) for energy generation by use of coal, oil, gas, and nuclear thermal power plants. Similarly, we scored each city inversely proportional to its CO2 emissions, between 0 and 30 points. “Other” represents the “Unknown sources,” as categorized in the CDP database, an indicator for which we awarded inversely proportional scores of between 0 and 5 points.
As cities grow, transportation needs increase along with resource use. With the help of ChargeHub.com, we were able to factor in how many EV charging stations are available in each of the regions analyzed, and we gave directly proportional scores of between 0 and 10 points for this indicator. But not all transport options require fuel—we also looked at commuter statistics regarding Americans who ride their bike or walk to work and back, and awarded directly proportional points, between 0 and 5, according to each of these two indicators, for each city. Every year, the League of American Bicyclists compiles a comprehensive report of bike-rider data, and so we turned to their analysis for numbers on bicycle commuters in the U.S. For data on walking commuters, we looked to the U.S. Census Bureau’s American Community Survey. We awarded bonus points (between 0 and 10, directly proportional) according to each city’s scorecard, as evaluated by the American Council for an Energy Efficient Economy—the ACEEE ranks U.S. cities on their energy efficiency policies and program efforts.
Visit the table at the end of the article for a detailed breakdown of these metrics of urban sustainability.
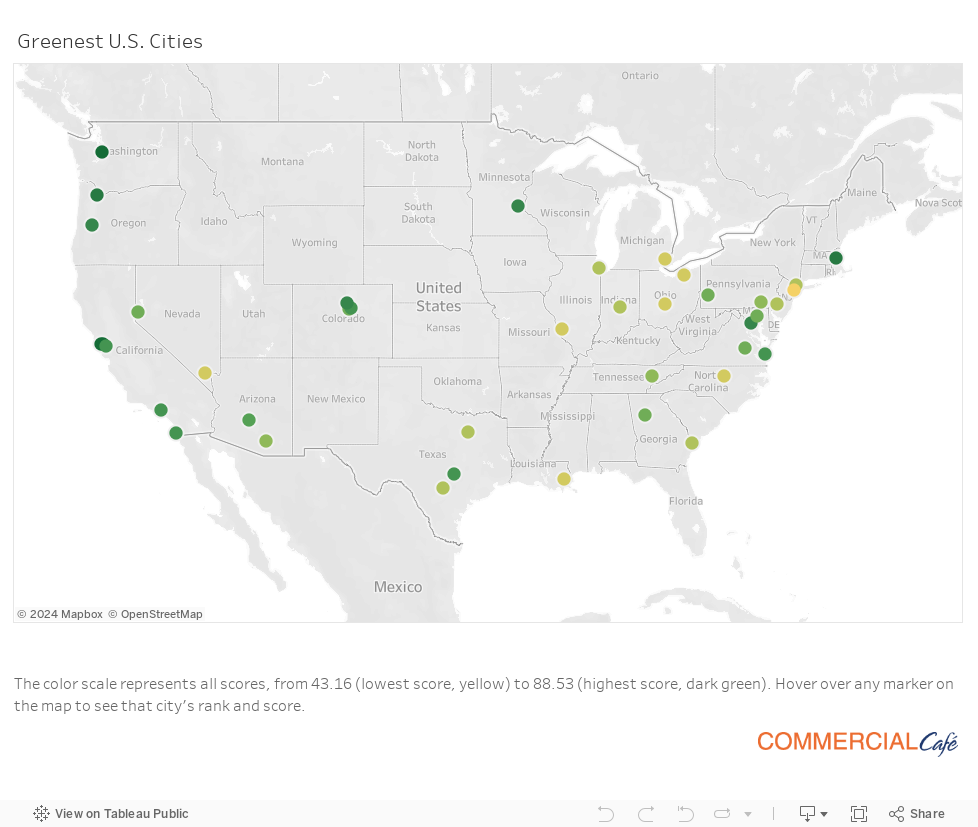
West Coast Home to Greenest US Cities, San Francisco and Seattle Leading the Way
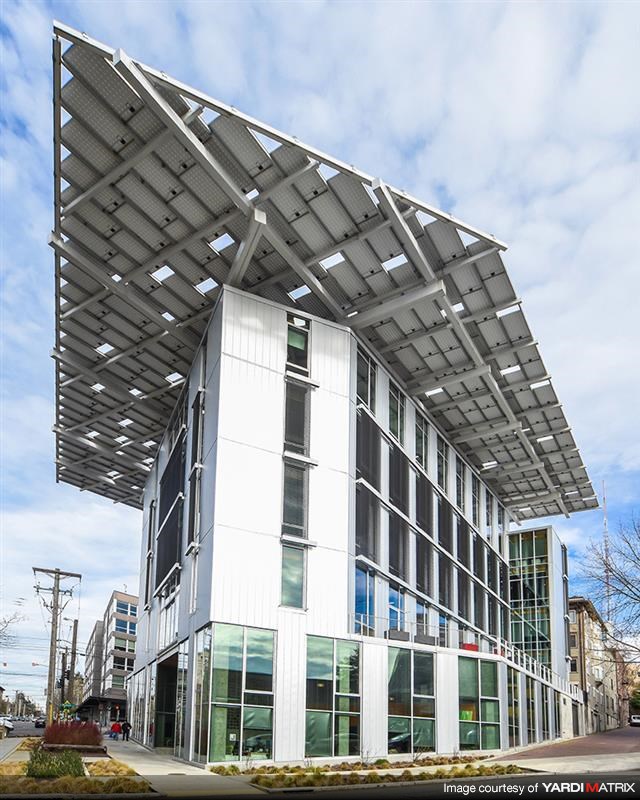
Bullitt Center, 1501 East Madison St., Seattle – designed to be the greenest commercial building in the world, certified “Living Building” in 2015
As the effects of climate change began to hit home, and rising sea levels were recognized as a clear and present danger to coastal settlements, California was quick to take note. The Global Warming Solutions Act of 2006 established a comprehensive program to reduce greenhouse gas emissions from all sources throughout the state, with a target to bring emissions down to 1990 levels by 2020. That target was reached four years early. San Francisco has been visibly on the front lines of embracing greener, cleaner sources of energy, as part of climate change-related positive action policies, so it came as no surprise that Fog City garnered the highest overall score on our list. Together with Oakland, which landed the third-highest score in our ranking, the city of San Francisco filed suit against oil companies Chevron, ConocoPhillips, Exxon Mobil, BP, and Royal Dutch Shell, holding the companies financially accountable for marketing fossil fuels and their use, despite having knowledge of the effects this consumption would have on climate, and having Big Oil pay for much needed infrastructure changes to cope with rising sea levels, such as sea walls.
Seattle, at number two on our list, has a long tradition of green energy, which dates back to January 1905, when the Cedar Falls hydroelectric plant first lit the city’s street lamps. In 2016, the city was over 80% hydro-powered and 4% wind-powered, with the rest including a mix of sources from long-term contracts with the Bonneville Power Administration (BPA), and others. Consistent efforts undertaken by the city to diversify its resource mix in a way that minimizes dependence on market purchases and fossil fuels have paid off. The Pacific Northwest is the lowest carbon-emitting U.S. region, since hydroelectric quenches two thirds of the electricity demand, with nuclear, coal, and gas producing roughly 30%. Even in a region this green, Seattle stands out far ahead of the curve, with only about 7% of electricity coming from coal, gas, and nuclear, combined.
Colorado has been diligently turning its power sources green. According to EIA data, over half of the state’s net 2,536 thousand megawatt-hours of electricity generated in April 2018 was produced from hydroelectric and non-hydroelectric sources. Renewables technology, both harvesting and storage, have advanced far enough that plenty of options have become affordable on a household level. Colorado state legislators recently saluted this progress by granting utility consumers the right to store energy from renewables, free of any discrimination in rates or in connecting to the grid. This is one of the most important steps taken so far, in support of adopting green energy sources in the U.S., and it is, therefore, no surprise to see Boulder and Denver high up in the list of the nation’s most sustainably powered cities.
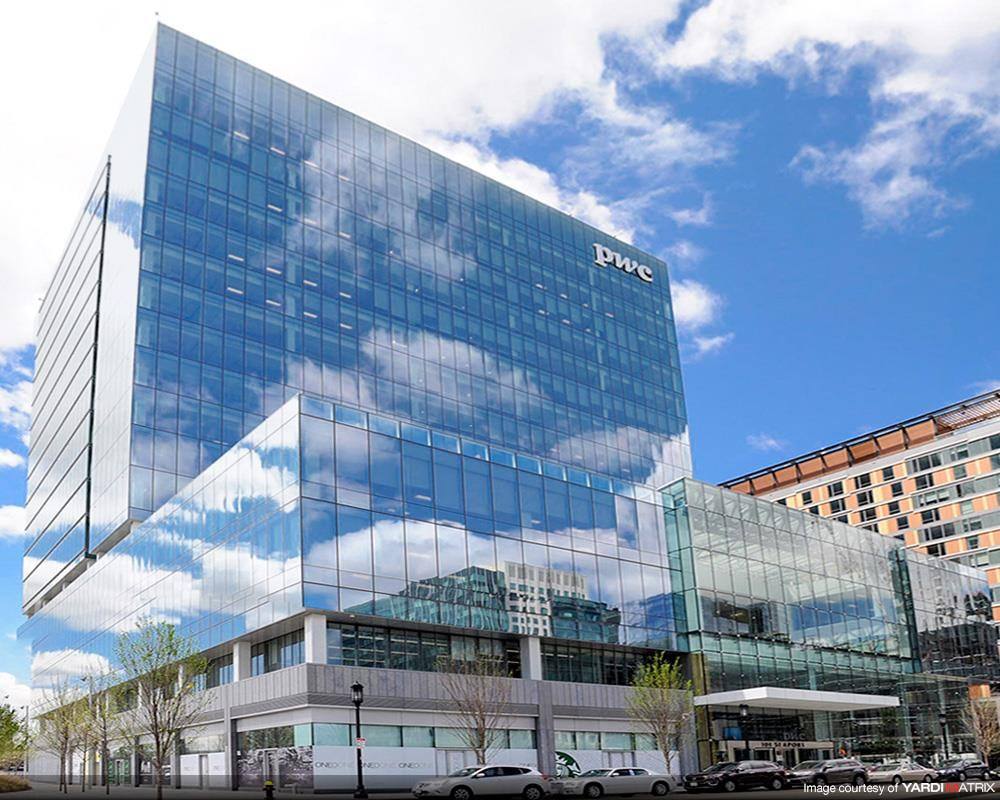
101 Seaport Blvd, Boston – LEED Platinum-certified office building that is part of Skanska USA’s bid to build the most sustainable block in Boston
Of the top 10 green-powered cities in the country, only two are located in the Eastern U.S., namely Boston and Washington, D.C.
Massachusetts’ Renewable Energy Portfolio Standard (RPS) was one of the first programs in the country to require all retail electricity suppliers to provide a certain minimum percentage of kilowatt-hour sales to end-use customers, from Class I renewable sources that were installed after 1997. Adopted in 2002, this minimum standard requirement has grown by merely 1% each year. In March 2018, the Commonwealth’s energy mix was over 70% sourced from natural gas, while nuclear, hydroelectric, and non-hydroelectric renewable resources accounted for just over 26% of the state’s energy mix. A recent analysis conducted by the Northeast Clean Energy Council (NECEC) in partnership with Mass Energy concluded that new policies are needed, along with an increase in yearly RPS growth requirements, if the state is to meet its Global Warming Solutions Act goals of reducing emissions by 80% by 2050.
Last October, the city of Boston, which is even more exposed to the risks of sea level rise as is San Francisco, has followed other Massachusetts municipalities in purchasing a larger amount of clean energy than mandated. Further efforts include various programs that engage the city’s business and residential communities to increase awareness and adopt energy-reducing and green power strategies. One such program, launched in 2010, is Greenovate—aiming to prepare Boston to go carbon neutral by 2050. Greenovate brought every sustainability initiative onto a single communications and engagement platform, helping local administrative departments, organizations, and Bostonians work towards common environmental goals. These efforts have garnered Boston the top ACEEE score for the second time in a row last year, followed by NYC, Seattle, Los Angeles, and Portland.
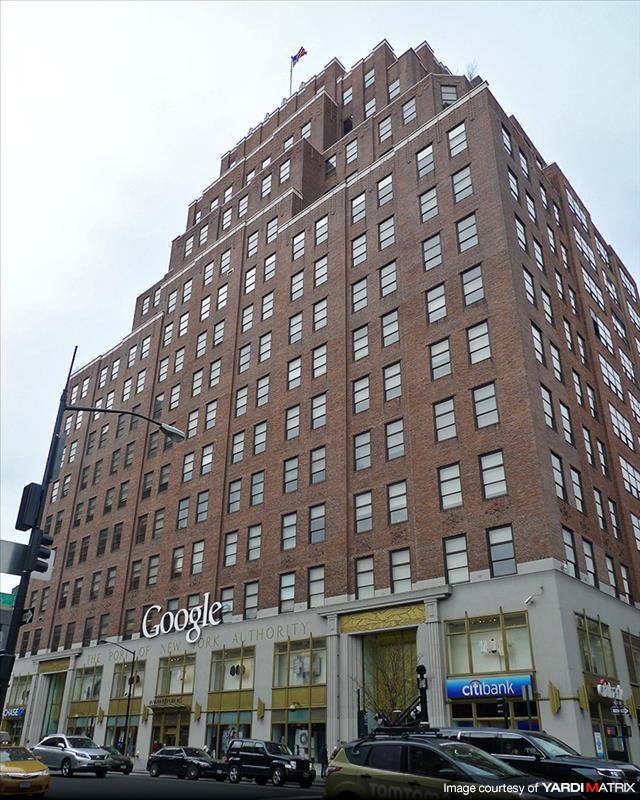
111 Eighth Ave., Midtown Manhattan – Google NYC reduced steam use by replacing 25-year old steam-powered absorption chillers with highly efficient electric models. The company also replaced the building’s 3,338 windows, increased efficiency of lighting controls, upgraded building management systems, and adapted all new office space to meet at least LEED Silver requirements
New York City got the second-best scorecard from the ACEEE in 2017, which reflects the intense efforts the city has undertaken to upgrade and advance its systems and resources towards sustainability. It does, however, have a lot of ground to cover. On our 40-city list, NYC landed the last spot. In the face of increasingly frequent and intense storms, the vulnerabilities of New York’s aging infrastructure have become impossible to ignore. A recent report published by the Center for an Urban Future details the outstanding issues that hobble the Big Apple’s efforts towards greener energy. For example, the city’s outdated and leak-prone water delivery system causes an estimated loss of roughly 24% of the city water flow to the end-consumer. NYC is increasingly reliant on natural gas for heat and electricity. Con Edison and National Grid operate and manage some of the oldest gas distribution networks in the country—their combined 6,300 miles of gas mains that serve the five boroughs are between 53 and 57 years old on average, and experienced roughly 5,800 leaks in 2012, according to Adam Forman, Research and Communications Associate at the Center for an Urban Future.
Of the many sustainability initiatives rolled out by the local administration, perhaps the most notable is the NYC Carbon Challenge. This voluntary leadership initiative has built public-private partnerships between the NYC Mayor’s Office and leaders in the private, institutional, and non-profit sectors, which have committed to reducing their greenhouse gas emissions by at least 30% over 10 years. Current challenge participants encompass roughly 500 million square feet of real estate, and account for more than 9% of citywide building square footage.
As per the Challenge Progress Report released in April, commercial buildings account for roughly 30% of New York City’s GHG emissions. SL Green Realty Corp., NYC’s largest commercial building owner, has enrolled eight properties in the program, and committed to reducing the emissions of each by at least 30% below 2011 to 2014 levels. Among entities that met their goals early and expanded their voluntary challenge even further are Google NYC, which reduced its GHG emissions by 36.5%, and its energy use intensity by 32.7% between 2013 and 2015, Credit Suisse, which reduced its carbon intensity by 40% over the course of just three years, and BlackRock, which managed to cut down its emissions by 36% in just five years.
The CRE Sector is Doing Its Part, as Cities Embrace LEED Technology
We turned to Yardi Matrix to check out how much of the existing commercial real estate stock is LEED-certified, as well as how much new green building is currently underway. We only looked at office buildings equal to or larger than 50,000 square feet, and multifamily properties of over 50 units, both existing and currently under construction, and put together a list of the 10 cities that boast the largest inventory share of LEED-certified buildings.
Our nation’s capital climbs to the top of this chart, both in terms of having 20% of existing buildings LEED-certified, and having 42 LEED buildings under construction. In 2017, the U.S. Green Building Council recognized the administration’s persistent efforts to turn Washington D.C. into a smart and sustainable city, and awarded the first LEED Platinum City certificate in the world. In addition to each government building being powered by 100% renewable energy, roughly 65% of D.C. neighborhoods are walkable, and over half of residents walk, use a bike, or employ public transport for their work commute.
San Francisco’s performance with respect to green office and multifamily buildings matches the city’s progress in terms of employing renewable energy sources to power the needs of its inhabitants. Coming in a close second, S.F. boasts just under 20% LEED-certified inventory, and is home to 21 LEED projects currently under construction.
Rounding out the top three here is Chicago, with nearly 13% of existing office and multifamily properties LEED-certified, and 23 more green buildings in the works. Illinois’ largest metropolis landed the 30th spot on our Sustainably Powered Cities list, mostly due to its high carbon emissions, and its rather high ratio of coal and natural gas-fired electricity generation. The Mayor’s office recognizes buildings as the number one source of greenhouse gas emissions in Chicago, and has rolled out the Retrofit Chicago program, which aims to “save green by going green.” Including municipal, commercial, and residential buildings, the project has so far increased the energy efficiency of roughly 54 million square feet of the city’s buildings and is looking to expand.
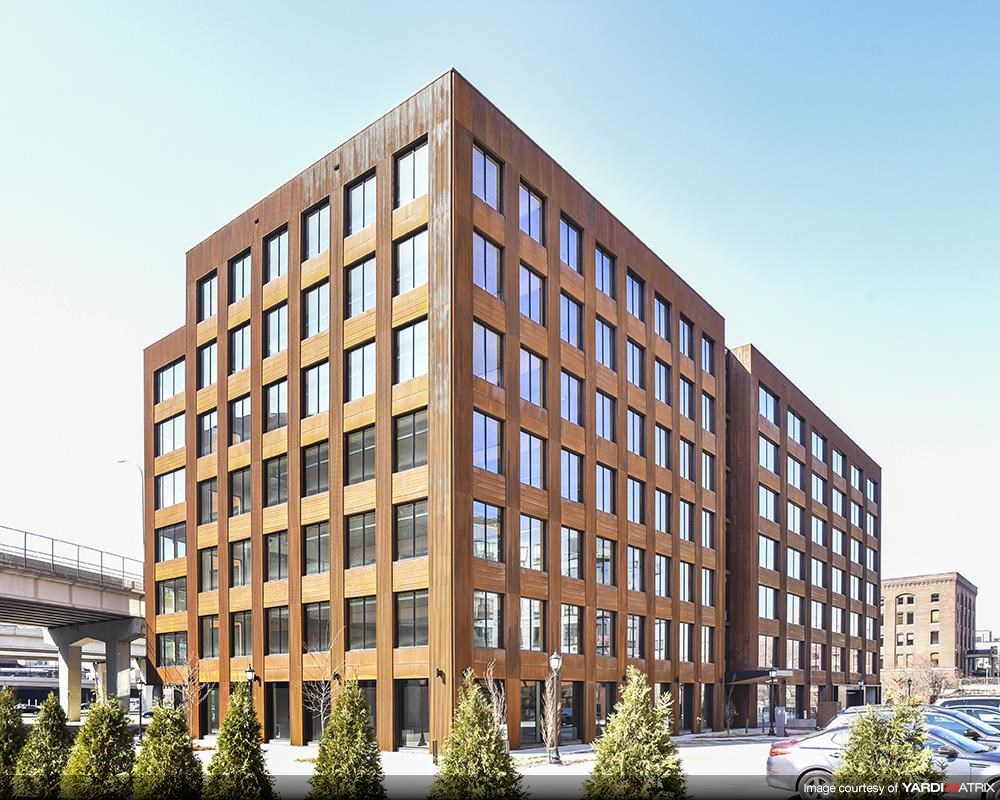
T3 Minneapolis, 323 Washington Avenue North – the first major U.S. office building to be constructed of wood in the last 100 years fetched $87 million earlier this year
Administrative efforts will be focused on energy and transport: a $2.6 billion grid modernization project is under way, which will also integrate new, renewable, sources of power. Roughly 100 miles of better bike lanes have been created, and the bike sharing program was expanded to 5,000 bikes. There are plans to create the city’s first fleet of electric buses, and over 80% of taxis on the road are low-emission vehicles.
In seeking alternatives that increase comfort and investor appeal, as well as energy consumption efficiency, commercial real estate developers are advancing innovation and technology in new builds. Hines bet on the only structural material that comes from a renewable source, and put forth the T3 project (Timber, Transit, and Technology), which resulted in a state-of-the-art, mostly timber office property in Minneapolis‘ North Loop. The Texas-based developer has plans for two more timber office properties—the T3 West Midtown in Atlanta, and T3 Goose Island in Chicago, which is to be erected on the site of a shuttered lumberyard.
Detailed Sustainability Scores per City
The interactive chart below offers a breakdown of the points we awarded each of the 40 cities. Use it to check out your region of interest and how it compares to others:
Property images courtesy of Yardi Matrix.


Ioana Ginsac
Senior Content Writer, Industry News & Reports
Ioana is a content writer who has been covering all-things-CRE (and more) for several Yardi network publications since 2017. You will find her byline regularly in industry news and market reports, but also on articles covering sustainable development, green urbanism, and innovation, all of which she has been passionately learning about for more than a decade. Her work has been referenced by publications including AmericanInno, Bisnow, BusinessInsider, Commercial Property Executive, Curbed, Fast Company, Forbes, GlobeSt.