Central Business Districts Feel the Brunt of Rising Office Distress


Key Takeaways:
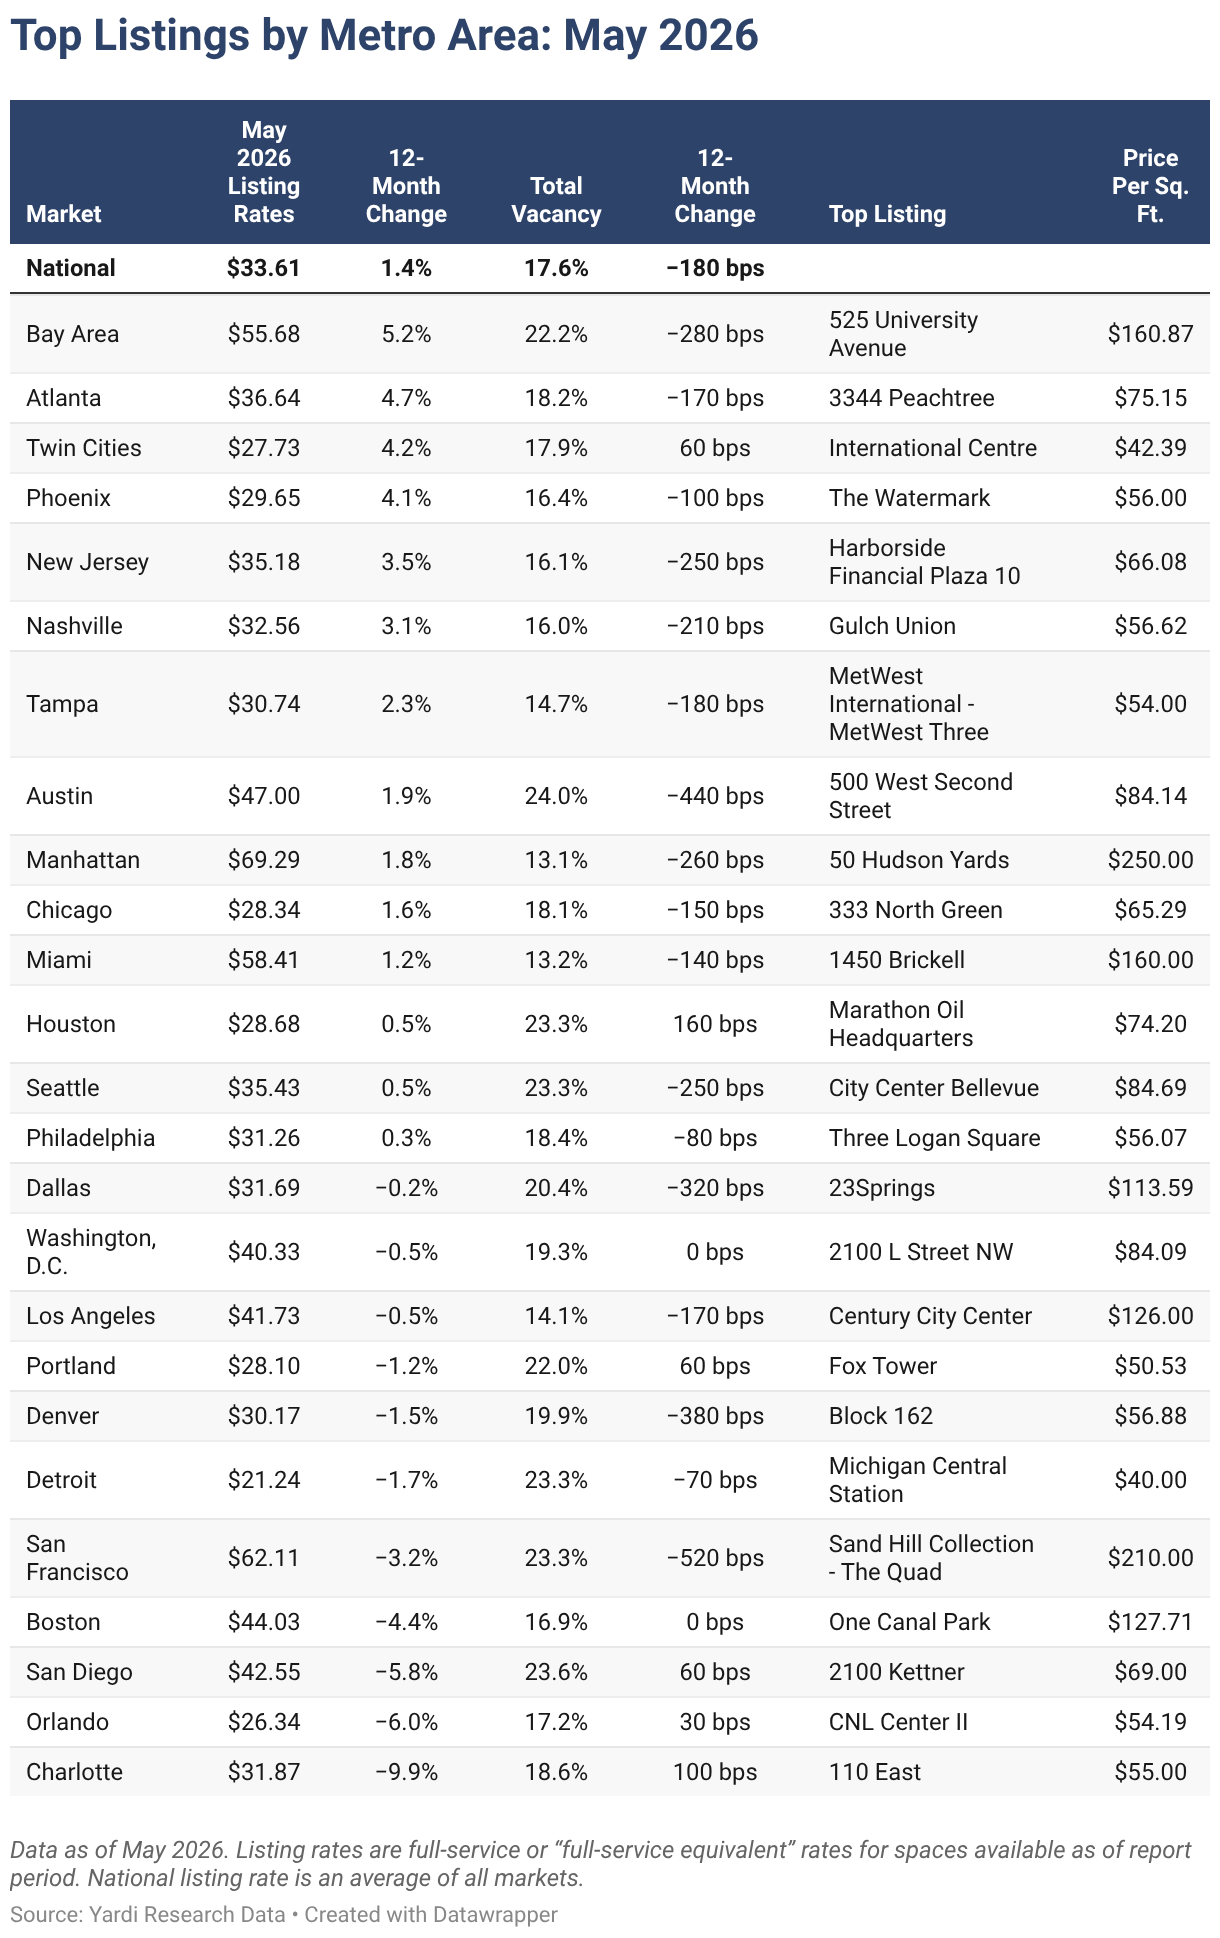
- In May, the national office vacancy rate was 17.6% following a decrease of 180 basis points (bps) year-over-year (Y-o-Y).
- The national office listing rate averaged $33.61 per square foot last month, which was 1.4% lower than values recorded in May 2025.
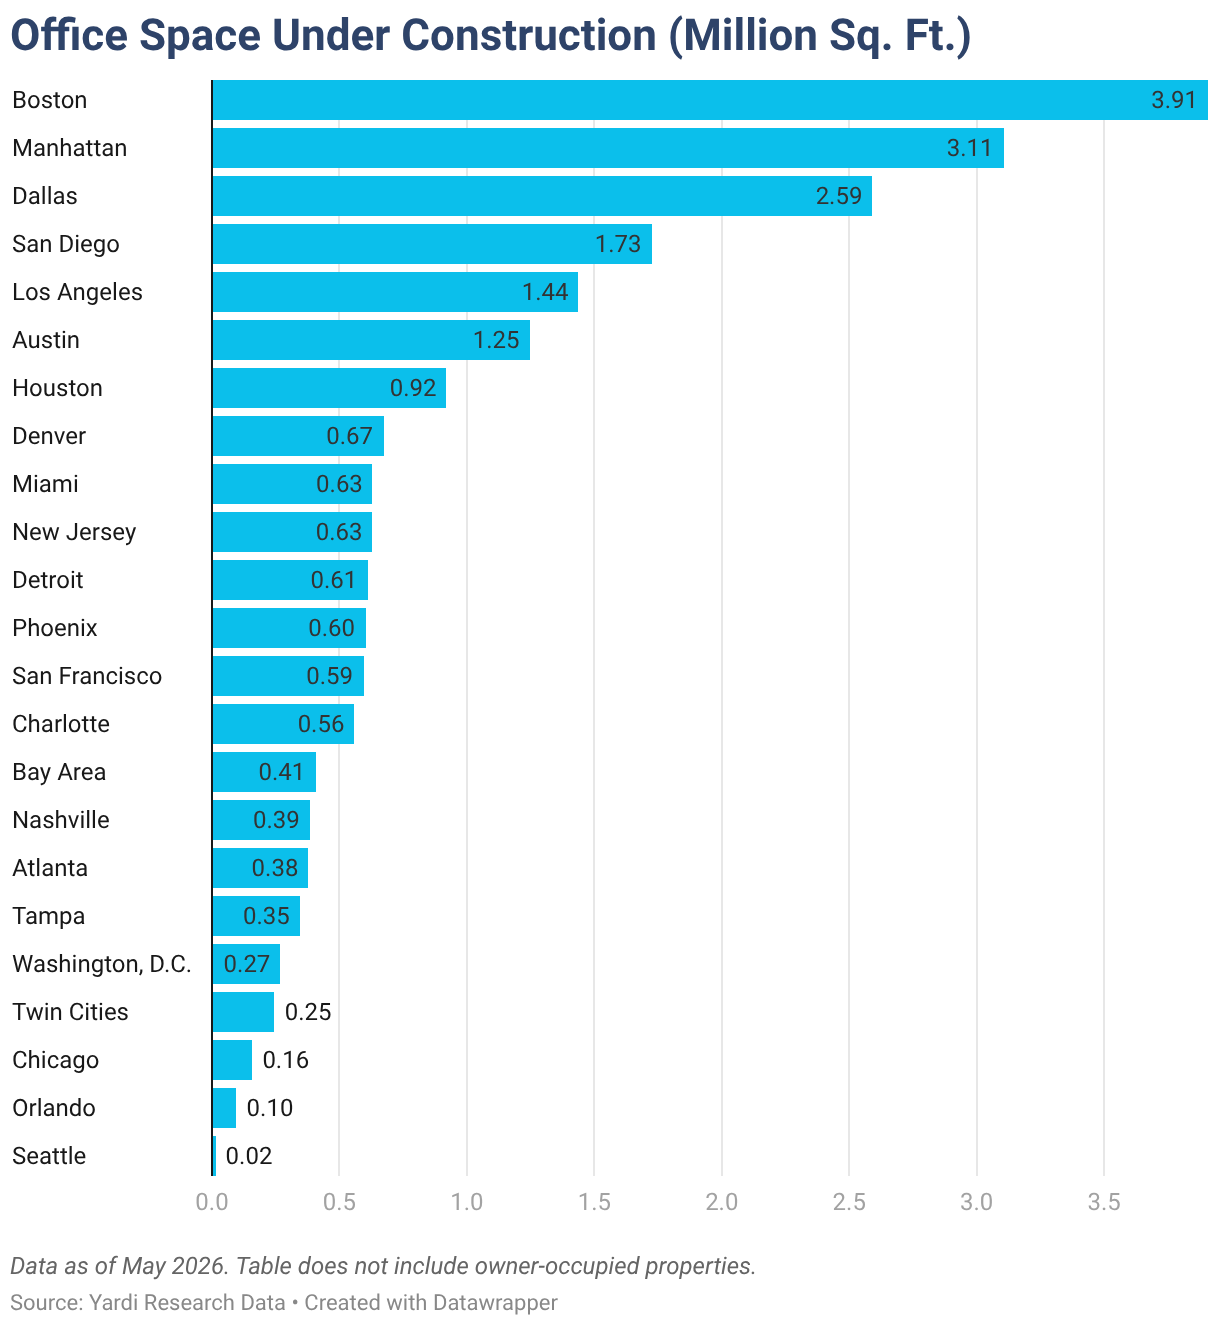
- Nationally, the modest office supply pipeline inched up last month to nearly 28.73 million square feet of office space under construction.
- With close to $3.7 billion in deals closed since the start of the year, Manhattan, N.Y., topped the list for sales. It was followed by San Francisco ($2.3 billion) and the Bay Area ($1.7 billion).
- Miami and Manhattan, N.Y., averaged the lowest vacancy rates in May among the nine large U.S. office markets where vacancy was below the national average.
- Western and Northeastern U.S. markets had most of the leasing rates that were above the national average, while Southern and Midwestern markets claimed some of the most affordable office asking rates in May.
- Boston; Manhattan, N.Y.; and Dallas had the most active construction pipelines and were the only markets where more than 2 million square feet of new office space was in development last month.
Trends & Industry News
Valuation Pressures Mount for CBD Properties
The commercial real estate sector is experiencing a pronounced division between property types with deep discounts and mounting distress heavily concentrated among assets that cannot adapt to evolving tenant demands. Specifically, out of more than 800 million square feet of space traded nationally since 2024, distressed transactions climbed to 19.4% — a sharp increase from the 6.2% recorded between 2021 and 2023.
This strain is particularly acute in commercial business districts (CBDs), where distressed assets accounted for 34.6% of transacted square footage since 2024, as compared to 24.5% in broader urban environments and just 12.1% in suburban markets. Furthermore, the average scale of a distressed sale has doubled from roughly 100,000 square feet prior to the pandemic to approximately 200,000 square feet since 2024, thereby revealing that larger properties lack the flexibility required to navigate major demand shifts.
Consequently, as flight to quality consolidates market demand into a limited pool of properties, buildings in central city cores are struggling to retain value. As an example, among properties in CBDs with multiple historical sale prices for comparison, 73% sold at a discount since 2024. For comparison, discount rates reached 48% for urban assets and 42% for suburban buildings.
Seattle provides a clear example of these compounding pressures. Here, the urban core has been hit by the dual effect of hybrid work schedules and sweeping technology sector layoffs. For instance, in the city’s CBD, the 44-story U.S. Bank Center building is set to be sold for $280 million, representing a substantial, 54% price drop compared to its 2019 transaction price.
“The destruction of value that we have discussed for years is showing through in the sales data. It’s not every transaction, but it is significant. With this decrease cost in acquisition comes opportunity – whether that is conversions to apartments, repositioning to best-in-class office and coworking, or full-on redevelopment and revitalization projects.”
Peter Kolaczynski, Director, Yardi Research
Notably, these localized market pressures persist despite the national vacancy rate dropping to 17.6% — a 230-bps decline from its peak in March of last year. However, this downward trend does not reflect a meaningful increase in physical office utilization. Instead, data from Kastle’s Back-to-Work Barometer indicates that office attendance has hovered around 55% for the last few years, thus establishing hybrid work as a widely accepted norm.
Looking forward, a historically low construction supply pipeline will help alleviate inventory pressures throughout the coming years. Even so, to capture remaining growth, property owners will need to prioritize asset flexibility to counter uncertainties from inflation and AI adoption, which will continue to drive both the ongoing flight to quality and the expansion of coworking spaces.
Listing Rates & Vacancy
San Francisco Vacancies Decline as Market Stabilizes
The national average full-service equivalent listing rate for office space was $33.61 per square foot last month after a dip of 1.4% Y-o-Y. Similarly, the national vacancy rate dipped 180 bps compared to the previous year to rest at 17.6% at the close of May.
Along the same lines, of the 25 largest markets that we analyzed, 17 saw decreases in their respective vacancy rates as compared to May of last year.
San Francisco led the list with a 520-bps drop in year-over-year office vacancies to bring the rate down to 23.3% in May. This significant improvement marks a steady decline since the market’s vacancy rate peaked at 29.3% in January 2025.
The reversal also directly aligns with a stabilization in office employment following consecutive years of job losses: Due to its dense concentration of tech companies, the San Francisco metro area was disproportionately affected by the layoffs that commenced in 2022. At the same time, the information sector in tech is uniquely positioned to gain from the ongoing expansion of artificial intelligence.
Furthermore, AI-driven advancements are creating positive economic spillover effects into neighboring industries, including finance and professional and business services. As such, this technological tailwind has successfully halted the decline in local office employment, ultimately driving down commercial vacancy rates across the market.
Transactions
Portland Prices Slowly Recover Following Prolonged Post-COVID Slump
In May, year-to-date office sales added up to a little more than $23 billion across 1,025 transactions, while sale prices averaged $213 per square foot. Additionally, nearly halfway through the year, a total of 11 of the top 25 metros analyzed for this report saw overall sales in excess of $500 million during the first five months of 2026.
The Portland, Ore., market, in particular, has seen significant pricing corrections with 53% of office transactions since 2024 closing at discounted rates relative to their previous purchase prices. This pricing pressure is clearly reflected in historical valuation shifts: The market’s average sale price plummeted to $91 per square foot in 2025, representing a 73% drop from peak values recorded in 2020. Although pricing showed a modest recovery in 2026 to an average of $119 per square foot, overall valuations remain significantly depressed compared to historical highs.
For example, in April, Central City Concern purchased a 108,000-square-foot, low-rise office building located at 121 NW Everett St. The property was acquired from HMH for $11 million — a transaction that represents a steep, 77% discount compared to the $47.3 million price tag that the asset commanded back in 2015.

Supply
Austin, Texas, Office Pipeline Halved Over the Past Year
As of May, roughly 28.73 million square feet of office space was under construction in the U.S. markets we tracked for this report. According to Yardi research data, this represented roughly 0.4% of stock. Also as of May, developers have delivered 9.9 million square feet of office space.
In Texas, Austin’s under-construction office supply pipeline shrank by more than 50% during the last 12 months, even as developers broke ground on more than 600,000 square feet of new workspace during that same timeframe. Despite this contraction, the market maintains one of the largest development pipelines among the nation’s top 25 metropolitan areas: Currently, 1.2 million square feet of office space is actively under construction, which accounts for 1.3% of Austin’s existing inventory.
Yet, in recent years, the metro has found it difficult to absorb its incoming inventory pipeline, even as it experiences resilient office employment numbers and a steady influx of corporate relocations. In fact, although Austin’s office vacancy rate dropped by 440 bps in the last year, average vacancies still hover at 24% — the highest figure recorded across the country’s top 25 metros. While the reduction in new construction activity marks a positive shift toward rebalancing the market, fully absorbing the existing inventory will be a lengthy process, thus ensuring that operational challenges persist for the foreseeable future.
Western Markets
San Francisco Tops Lease Rates, San Diego Leads Office Construction
Vacancy rates were above the national average of 17.6% in May in the majority of the Western U.S. markets that we surveyed for this report. As a matter of fact, with the exception of Los Angeles (14.1% vacancy) and Phoenix (16.4%), all markets in this group averaged vacancy rates higher than 19% last month.
Specifically, San Diego office space vacancy was the highest in the region, averaging 23.6% in May. Next, San Francisco was second with vacancy averaging 23.3% last month. Plus, office space in San Francisco topped the regional list for leases: Asking rates here averaged a little more than $62 per square foot in May, which was almost double the national average of $33.61.
Then, neighboring Bay Area office space in California was the second-priciest in the region last month with asking rates averaging nearly $55.70 per square foot — the only other Western U.S. market on our list where average rates surpassed $50 per square foot last month.
Not far behind, San Diego (#3) and LA (#4) each averaged more than $40 per square foot — the only other markets in the region to do so — and closed out the standout block of California markets occupying the top four spots on the list for rents.
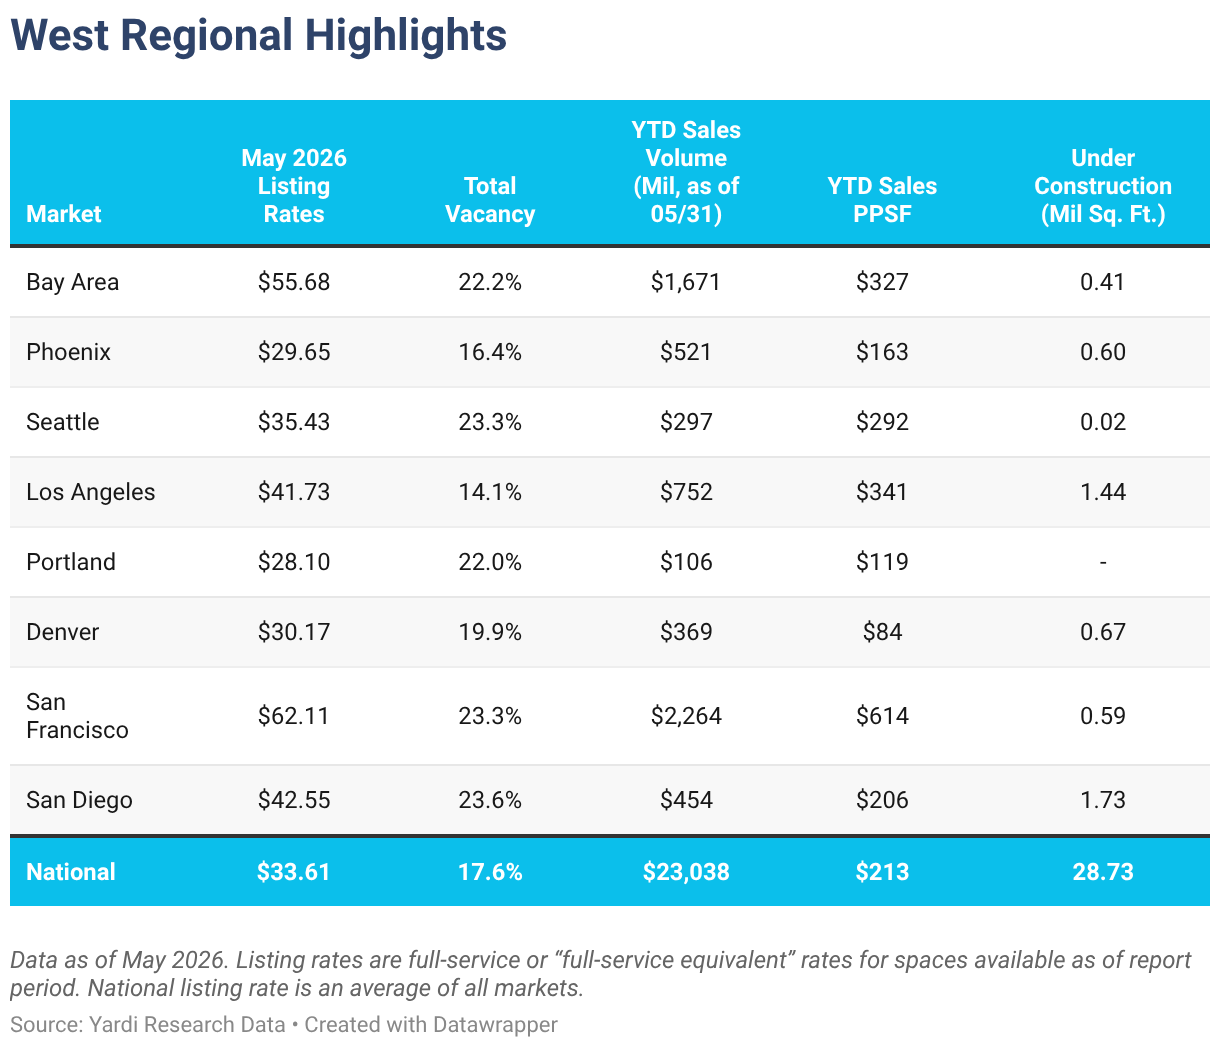
Otherwise, Portland, Ore.; Phoenix; and Denver were the only large markets in the Western U.S. where office asking rates were below the national average in May. Each averaged around or less than $30 per square foot.
Meanwhile, when looking at office sales in the region, data showed that northern California markets held a comfortable lead. More precisely, San Francisco — which saw nearly $2.3 billion in sales close during the first five months of the year — took the top spot, followed by the neighboring Bay Area, where year-to-date transactions approached $1.7 billion.
Further south, Los Angeles commanded the third-highest sales total in the region so far this year ($752 million). It was followed by sales of Phoenix office space, which added up to $521 million since the start of the year through May. San Diego and Denver were the only other Western U.S. markets to see office sales surpass $300 million during the first five months of the year.
Granted, high-profile assets in gateway markets continue to command top-tier prices. Namely, San Francisco office sales closed through May averaged $614 per square foot, which was the highest in the Western U.S. and the second-highest nationwide thus far.
California markets also led the region in terms of development in May: San Diego had a little more than 1.7 million square feet under construction, followed by Los Angeles office space under development that totaled more than 1.4 million square feet. Together, they accounted for more than 58% of the nearly 5.5 million square feet currently in development across the largest markets in the region.
Midwestern Markets
Office Sales in Chicago Surpass $800 Million, Twin Cities Market Maintains Lowest Vacancy
The top Midwestern U.S. office markets we looked at for this report remained some of the most affordable in the country in May, in terms of both average listing rate and for-sale price per square foot.
In this region, asking rents for Detroit office space were the most accessible with rates here averaging $21.24 per square foot. Next, the average asking rate for office space in Minneapolis; St. Paul, Minn.; and the wider Twin Cities metro submarkets rested at $27.73 per square foot. At the same time, occupancy levels in the Minnesota market last month also kept vacancy at 17.97% to make it the closest large market in the Midwest to approach the national average of 17.6% last month.
Unsurprisingly, Chicago office space was the region’s priciest for leasing in May with asking rents averaging $28.34 per square foot. Additionally, the Windy City’s occupancy levels averaged an 18.1% vacancy rate, which was also relatively close to the national average.

Likewise, the highest regional office sales total so far this year was also in Chicago: By the start of June, the largest office market in the Midwest had seen $826 million worth of office space change hands since the beginning of the year. Then, at quite a distance, office sales in the Twin Cities followed in second place with a total of $405 million through May 2026.
Other than those, development in the region remained quite slow last month with a combined total of a little more than 1 million square feet of office space under construction in May across the Midwestern U.S. markets we analyzed.
Southern Markets
Dallas Dominates YTD Sales & Construction, Miami Tops Leasing Rates
In the South, Miami; Austin, Texas; and Washington, D.C. remained the region’s top three markets for asking rents and were the only Southern U.S. markets to see full-service equivalent listing rates averaging more than $40 per square foot in May.
At the opposite end of the ranking, office space in Orlando, Fla., had the lowest asking rent average in the region and was one of only two markets in this group to average less than $30 per square foot last month. The other was Houston.
Moreover, a look at year-to-date office sales showed that nine of the 10 Southern U.S. markets we analyzed for this report recorded totals higher than $300 million through last month. First, Dallas had the highest year-to-date sales total as office transactions here amounted to nearly $1.4 billion last month. Next, sales of Washington, D.C. office space added up to nearly $1.2 billion through May, followed by Miami ($873 million).

Then, looking at leasing data, office space in Miami had the highest average full-service equivalent listing rate in the region in May at $58.41 per square foot. Not to be outdone, office space in Austin, Texas, asked an average of $47 per square foot, followed by Washington, D.C. — the only other market in this regional group to see lease rates average more than $40 per square foot last month.
One other market in the region also rested above the national average last month: Asking leasing rates for office space in Atlanta approached $37 per square foot.
Notably, Texas’ Austin, Houston, and Dallas had the highest vacancy rates in the region in May 2026 and were also the only ones to exceed 20%. Conversely, Miami and Tampa, Fla., had the highest rates of occupancy and were among the four Southern U.S. markets with vacancy below the national average last month. The other two were Nashville, Tenn., and Orlando, Fla.
As for construction, data showed that Texas markets carried more than half of the office pipeline in the region. In May, nearly 2.6 million square feet of office space was in development in Dallas; 1.25 million square feet was under construction in Austin; and Houston’s pipeline totaled 920,000 square feet. Combined, these three Texas powerhouses accounted for nearly 64% of development in the region and nearly 17% of the national pipeline.
Northeastern Markets
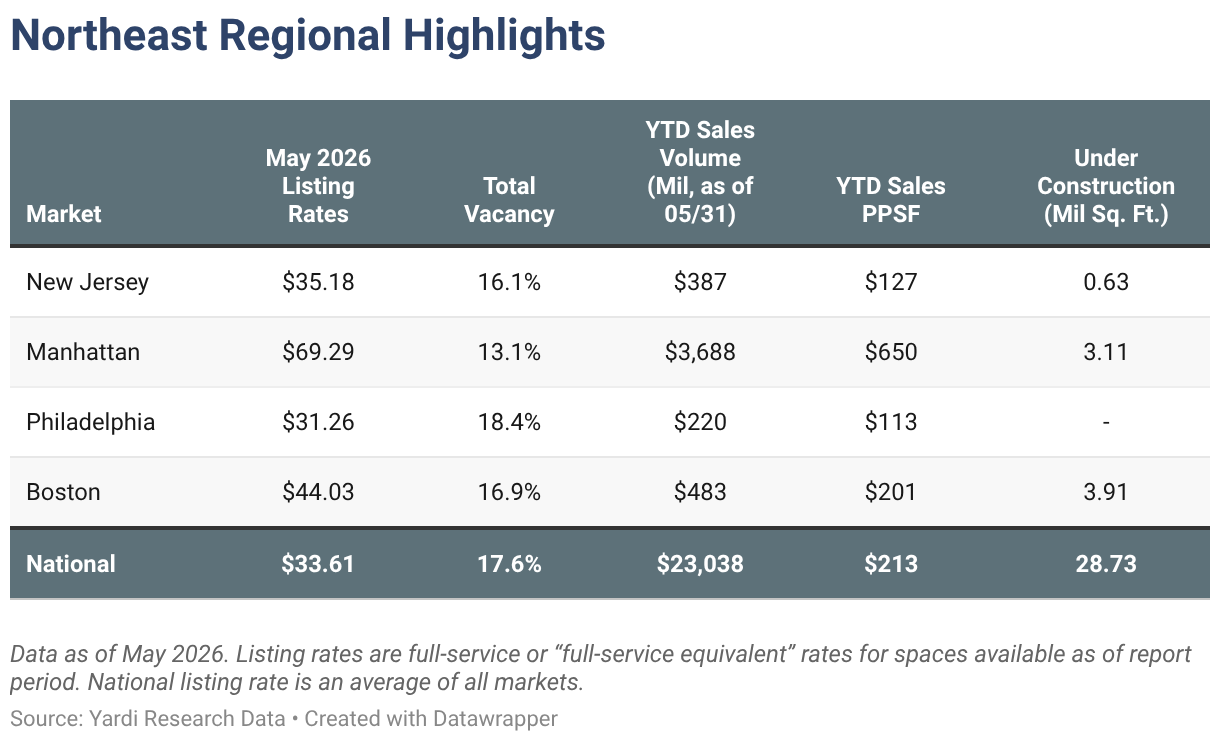
Boston Pipeline Closes in on 4 Million Square Feet, YTD Sales Approach $4 Billion in Manhattan
In May, Manhattan, N.Y., had the highest average listing rate in the region at $69.29 per square foot. For comparison, asking rents for Philadelphia office space averaged slightly above $31 per square foot, making it the only Northeastern U.S. office market to ask less than the national average of $33.61 per square foot last month.
Looking at construction, two of the four largest office markets in the Northeast had more than 3 million square feet of new office space in development. Together, they accounted for a little more than 24% of the national pipeline last month. Boston led supply in the region as office projects in development here totaled more than 3.9 million square feet. Then, the Manhattan, N.Y., office space pipeline was the second-largest in the region last month with 3.11 million square feet under construction. With that, these two Northeastern U.S. markets accounted for about 24% of the country’s total pipeline of approximately 28.73 million square feet last month.
As you might expect, an analysis of office sales showed that transactions in Manhattan, N.Y., amounted to the largest sales total since the start of the year in both the region and the country at nearly $3.7 billion. Meanwhile, transaction activity in Boston during the first five months of the year totaled $483 million in year-to-date office sales. At a distance, sales of New Jersey office space added up to $387 million since the start of the year through May.
Office-Using Employment
New York & Austin, Texas, Stand Out in Office Employment Growth
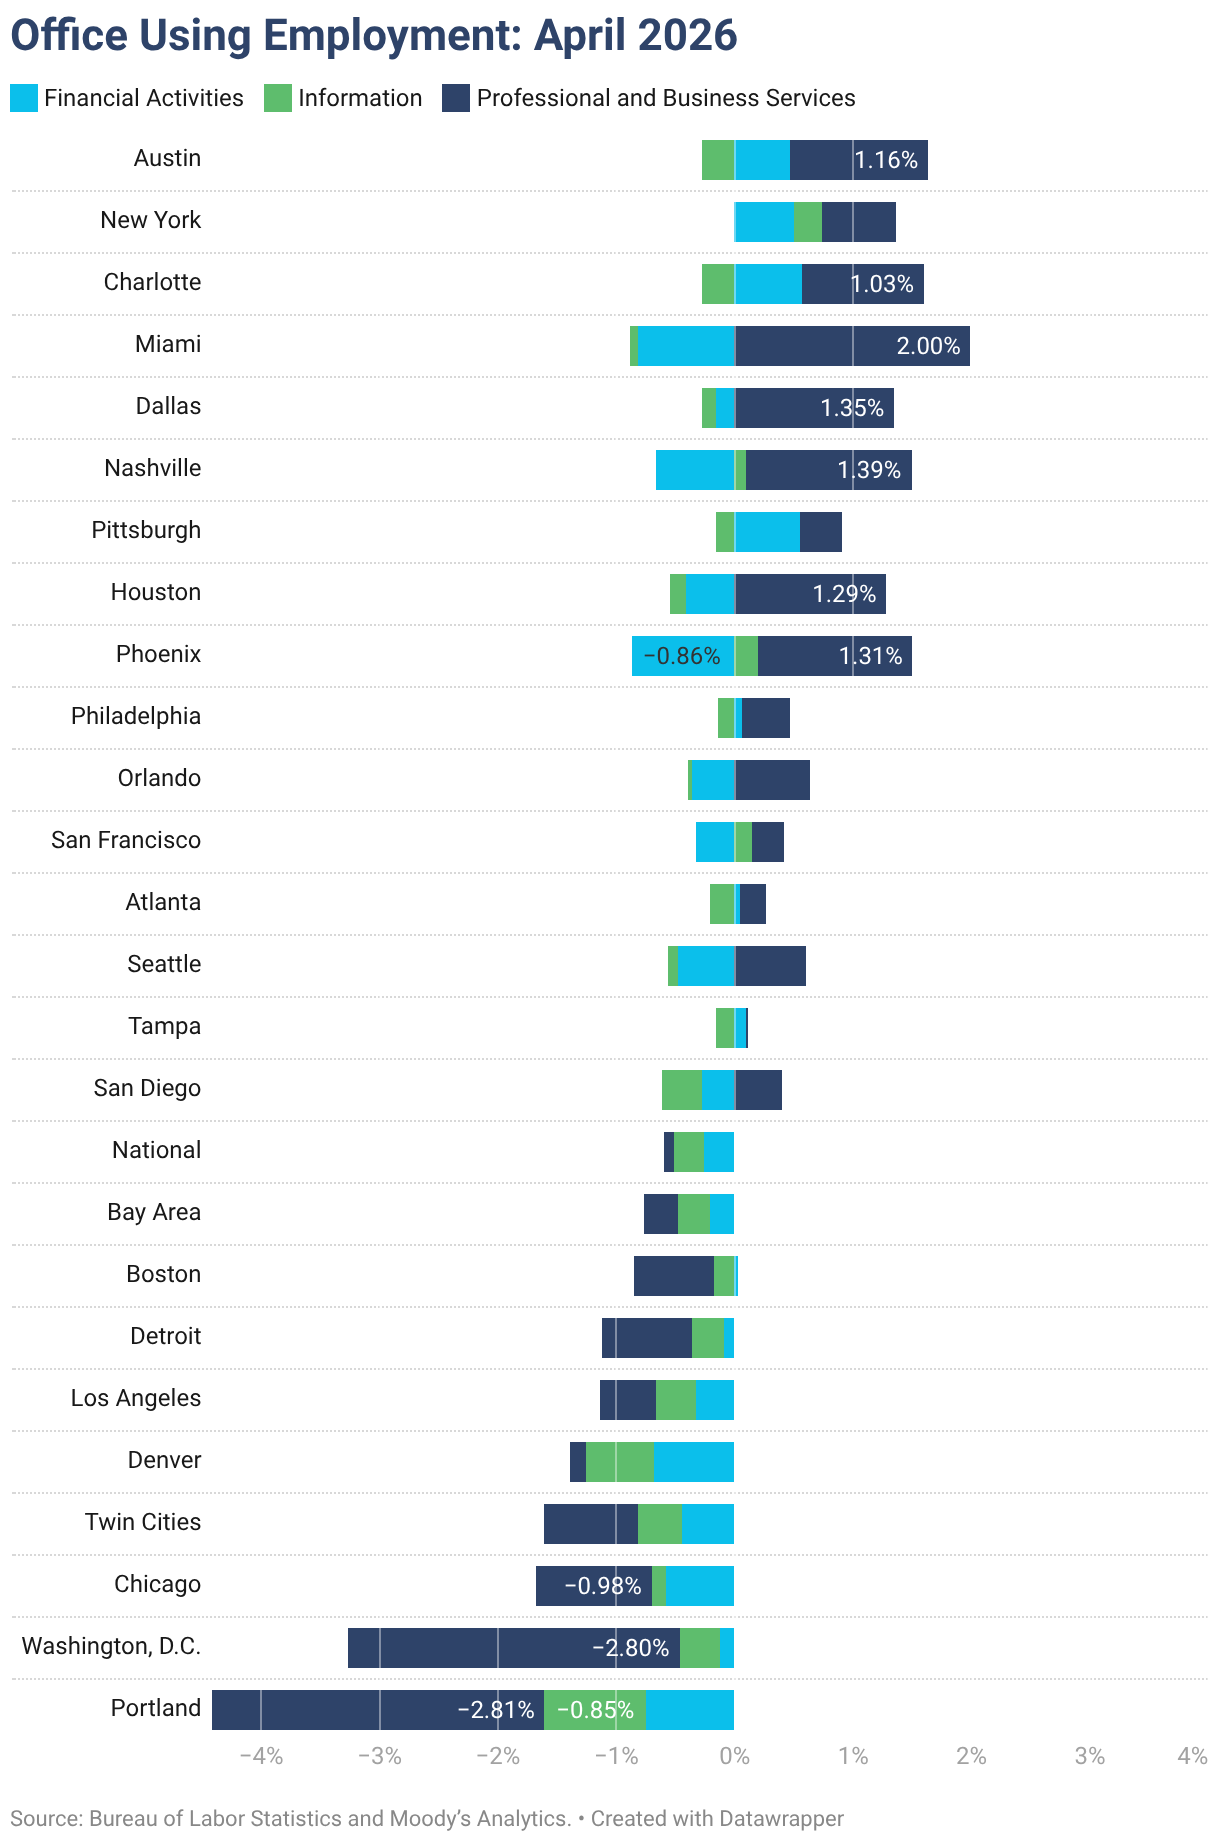
According to data from the Bureau of Labor Statistics, office-using sectors of the labor market experienced a net loss of 18,000 jobs in May. This monthly contraction was driven by the financial activities sector, which shed 22,000 positions, alongside the information sector’s loss of 2,000 jobs. Conversely, the professional and business services sector recorded a gain of 6,000 jobs. On an annual basis, national employment in office-using sectors decreased by 170,000 positions for a 0.5% drop, even as total non-farm employment across the country grew by 0.3% during the same timeframe.
At the metropolitan level, New York leads the nation’s major markets in office employment expansion after recording a 1.4% Y-o-Y increase as of April — a growth rate matched only by Austin, Texas. This regional expansion has been fueled by job additions within the finance and information sectors: The metro area’s dense concentration of financial institutions has benefited from a booming stock market with recruitment also rising within tech companies that are leaning on professionals to resolve some of the logistical challenges of AI implementation. These employment gains are further compressing Manhattan’s relatively low vacancy rate, which stands at 13.1%.
Methodology
This report covers office buildings that are 25,000 square feet or larger. Listing rate and occupancy information was based on Yardi Research data.
Listing rates are full-service rates or “full-service equivalent” for spaces that were available as of the report period.
Vacancy refers to the total square feet vacant in a market (including subleases) divided by the total square feet of office space in that market. Owner-occupied buildings are not included in vacancy calculations. For reporting purposes, A and A+/trophy buildings were combined.
Stages of the supply pipeline:
Planned — Buildings that are currently in the process of acquiring zoning approval and permits, but have not yet begun construction.
Under Construction — Buildings for which construction and excavation have begun.
Office-Using Employment is defined by the Bureau of Labor Statistics as including the sectors information, financial activities, and professional and business services. Employment numbers are representative of the metropolitan statistical area and do not necessarily align exactly with CommercialCafe market boundaries.
Sales volume and price-per-square-foot calculations for portfolio transactions or those with unpublished dollar values were estimated using sales comps based on sales that were similar in terms of the market and submarket; use type; location and asset ratings; sale date; and property size.
Market boundaries in the CommercialCafe office report coincide with markets defined in the CommercialCafe Markets Map and may differ from regional boundaries defined by other sources.
Fair Use & Redistribution
We encourage and freely grant you permission to reuse, host, or repost the research, graphics and images presented in this article. When doing so, we kindly ask that you credit our research by linking to CommercialCafe.com or this page so that your readers can learn more about this project, the research behind it and its methodology. For more in-depth, customized data, please contact us at [email protected].


Ioana Ginsac
Senior Content Writer, Industry News & Reports
Ioana is a content writer who has been covering all-things-CRE (and more) for several Yardi network publications since 2017. You will find her byline regularly in industry news and market reports, but also on articles covering sustainable development, green urbanism, and innovation, all of which she has been passionately learning about for more than a decade. Her work has been referenced by publications including AmericanInno, Bisnow, BusinessInsider, Commercial Property Executive, Curbed, Fast Company, Forbes, GlobeSt.