October 2025 Industrial Report: Tax & Tariff Policies Promise to Transform Manufacturing


Key Takeaways:
- Manufacturing construction has slipped from recent all-time highs, but nevertheless remains elevated as companies process the effects of The One Big Beautiful Bill Act and stagnating electric vehicle sales.
- Average in-place rents for industrial space rested at $8.72 per square foot at the end of September — $0.06 higher month-over-month and up 6.1% annually.
- The national industrial pipeline totals 340.5 million square feet with 186.1 million square feet of new construction starts in 2025.
- Year-to-date industrial sales totaled $52.5 billion at the end of September, higher than 2024 figures thanks in part to the delayed effect of three interest rate cuts in late 2024.
- Los Angeles vacancies rested at 8.3% to mark a 90-basis-point contraction year-over-year.
- Several high-profile portfolio sales in Kansas City, Mo., nearly doubled the market’s year-to-date sales volume between August and September.
- Southern markets are seeing consistent rent growth, showcasing the region’s durable demand.
Manufacturing is at a crossroads, with provisions in The One Big Beautiful Bill Act (OBBBA) promising to substantially impact manufacturers and domestic goods production. With manufacturing comprising a growing share of industrial investment in recent years, the entire sector may see far-reaching consequences, our U.S. industrial market report shows.
Trends & Industry News
One Big Beautiful Bill to Reshape Manufacturing Trends
Passed into law over the summer, the OBBBA includes sections aimed at stimulating the domestic manufacturing sector, including 100% bonus depreciation for equipment and facilities as well as research and development cost expensing. These measures promise to drive immediate investment by freeing up money and driving manufacturing innovation, while other sections of the new tax code — such as reshoring incentives and targeted interest deductibility — may spur the sector in the long-term according to our industrial property outlook.
At the same time, the OBBBA also brought an end to tax credits for production and purchases of electric vehicles (EVs), in addition to cutting funding for green energy — both sectors that have been at the forefront of the manufacturing boom in recent years. Simultaneously, electric vehicle sales are waning, leading some manufacturers to reassess their exposure to the sector. These shifts have also led to a drop in manufacturing development spending compared to the recent all-time highs driven by the Chips & Science Act, although manufacturing development is still more than three times higher than it was in 2022.
“The continued opportunity of secondary and supportive development that’s necessary to optimize large manufacturing facilities has been a constant across the last two major policy initiatives.”
Peter Kolaczynski, Director, Yardi Research
Other factors also have their say in the direction of manufacturing and industrial real estate as a whole. For instance, the supply chain bottlenecks that tested the industry in the earlier part of the decade are still fresh in the minds of manufacturers and logistics operators, maintaining the attractiveness of localized supply chains as companies choose risk mitigation over cost-effectiveness. In the same vein, large manufacturing facilities will continue to drive secondary development through the multiplier effect, with suppliers and downstream companies often following suit in the wake of large manufacturing development. Vertically integrated facilities will likely become the standard for supply chain optimization, while also being a driving force in industrial development.
Rents & Occupancy
Years-Long Rent Growth Cools in Port Markets
In recent years, major port markets and adjacent locations witnessed substantial industrial rent growth, including double-digit annual gains in high-demand locations such as Los Angeles, the Inland Empire and New Jersey.
So far, this year brought a reversal to this trend: The most pronounced rent growth in 2025 took place in either second-tier ports or logistically significant inland nodes with accelerated population growth. Specifically, Philadelphia industrial real estate continued to lead other port markets in terms of in-place rent growth, climbing by 8.7% annually. Atlanta and Miami followed closely with 8.5%. The Inland Empire (7.6%) and New Jersey (7.4%) also posted solid growth numbers, although they fell short of the eye-watering numbers seen in recent years.
In September, the average national industrial vacancy rate rested at 9.5%, climbing significantly throughout the last year. Markets continue to absorb the unprecedented 2.7 billion square feet of space delivered so far this decade — a 13.1% expansion of national stock — and vacancies are feeling this downward pressure.
New lease premiums followed suit as market conditions continue shifting toward an occupier market: Leases signed in the last 12 months averaged $10 per square foot, which was only $1.28 higher than the national average in-place rent. For comparison, last September, the lease spread stood at $2.20 and has shrunk considerably since then as tenants have gained the upper hand in lease negotiations.
At the same time, some markets held onto significant new lease premiums, with new leases in Bridgeport, Conn. commanding an average of $5.13 more per square foot compared to in-place leases in the market. Tampa ($4.56 per square foot), Miami ($3.80), Philadelphia ($3.25) and Nashville ($3.00) are also seeing significant lease spreads, our U.S. industrial market report shows.
Supply
Denver Pipeline Remains Healthy Despite Vacancy Worries
At the end of September, there was 340.5 million square feet of industrial space under construction at a national level, which is equivalent to a 1.7% expansion of current stock. Year-to-date, completions total 219.4 million square feet of space, while new construction starts add up to only 186.1 million square feet, meaning that the national pipeline is continuing to contract.
Even as some markets continue to expand, our industrial property market report underscores that this construction may not be in the same category as the speculative developments of 2021-2023. For example, the Denver industrial space pipeline currently totals 8.7 million square feet of space (3.1% of stock) despite rising vacancies in the market, but the sizable amount of space underway does not pose as much of an issue as it seems. That’s because a significant share of the pipeline is made up by owner-occupied or build-to-suit facilities, such as PepsiCo’s 1.2-million-square-foot bottling plant near Denver International Airport. What’s more, a significant portion of the Denver pipeline is due to the 3.5-million-square-foot robotics fulfilment center being developed for Amazon in Loveland, Colo. The warehouse has seen several delays since it broke ground in early 2022 as Amazon reevaluated its logistics needs nationally. Now, there are reports saying that the warehouse exterior has been completed, but operations have yet to begin.
Transactions
Third-Party Logistics Boom Elevates Atlanta Sale Prices
Industrial transactions totaled $52.5 billion nationally at the end of September. Properties traded for an average of $142 per square foot, up from the $130 per square foot recorded in our September 2024 industrial real estate report.
Notably, the three interest rate cuts at the end of 2024 brought the benchmark rate down by 100 basis points (bps), pushing industrial sales volume up as difficulties in accessing credit were somewhat eased. Accordingly, total industrial sales volume grew by 15% in 2024 compared to 2023, and sales thus far this year also stand above those of 2024. As more sales data is collected and published, 2025 sales are certain to eclipse those from the previous year for the highest total since the 2022 high-water mark.
Several markets saw rising sales volumes year-over-year, contributing to the yearly national increase. Conversely, Atlanta’s sales volume slipped slightly compared to 2024, but average prices spiked by almost one-third to reach $140 per square foot. With strong logistical advantages — such as one of the world’s busiest airports, an extensive rail network, high road freight capacity and proximity to the growing Port of Savannah — industrial space in Atlanta has quickly become a favorite for third-party logistics providers. As such companies rely on metro Atlanta to expand their capabilities in the Southeast, the market is experiencing a wave of high-profile deals. In fact, it achieved the eighth-largest year-to-date sales volume nationwide through a large number of smaller sales in logistics parks rather than a single large transaction inflating sales numbers.
Western Markets
Los Angeles Vacancies Stabilize
As one of the Western markets with the most robust demand, industrial real estate in Los Angeles experienced record-low vacancy rates in the 2021-2023 boom cycle. After deliveries picked up, a period of protracted vacancies came next, peaking at nearly 10% in late 2024. Now, a year down the line, the market seems to be at a point of equilibrium with the average vacancy rate sitting at 8.3% — down 90 bps annually and 30 bps from last month. Granted, vacancies are still up year-over-year in other Western markets, ranging from +40 bps in the Inland Empire, Calif., to +490 bps in California’s Central Valley.
Average in-place rents continued their upward trajectory in Orange County, reaching $17.09 per square foot at the end of September for a $0.07 increase month-over-month and $1.36 year-over-year. This means that the market maintained the title of priciest industrial market nationwide, maintaining a lead over fellow Western markets Los Angeles ($15.59 per square foot) and the Bay Area ($13.99 per square foot). It’s worth noting that downward rent pressure in Los Angeles was particularly pronounced with leases signed in the last 12 months being $0.71 cheaper, on average, compared to in-place leases.
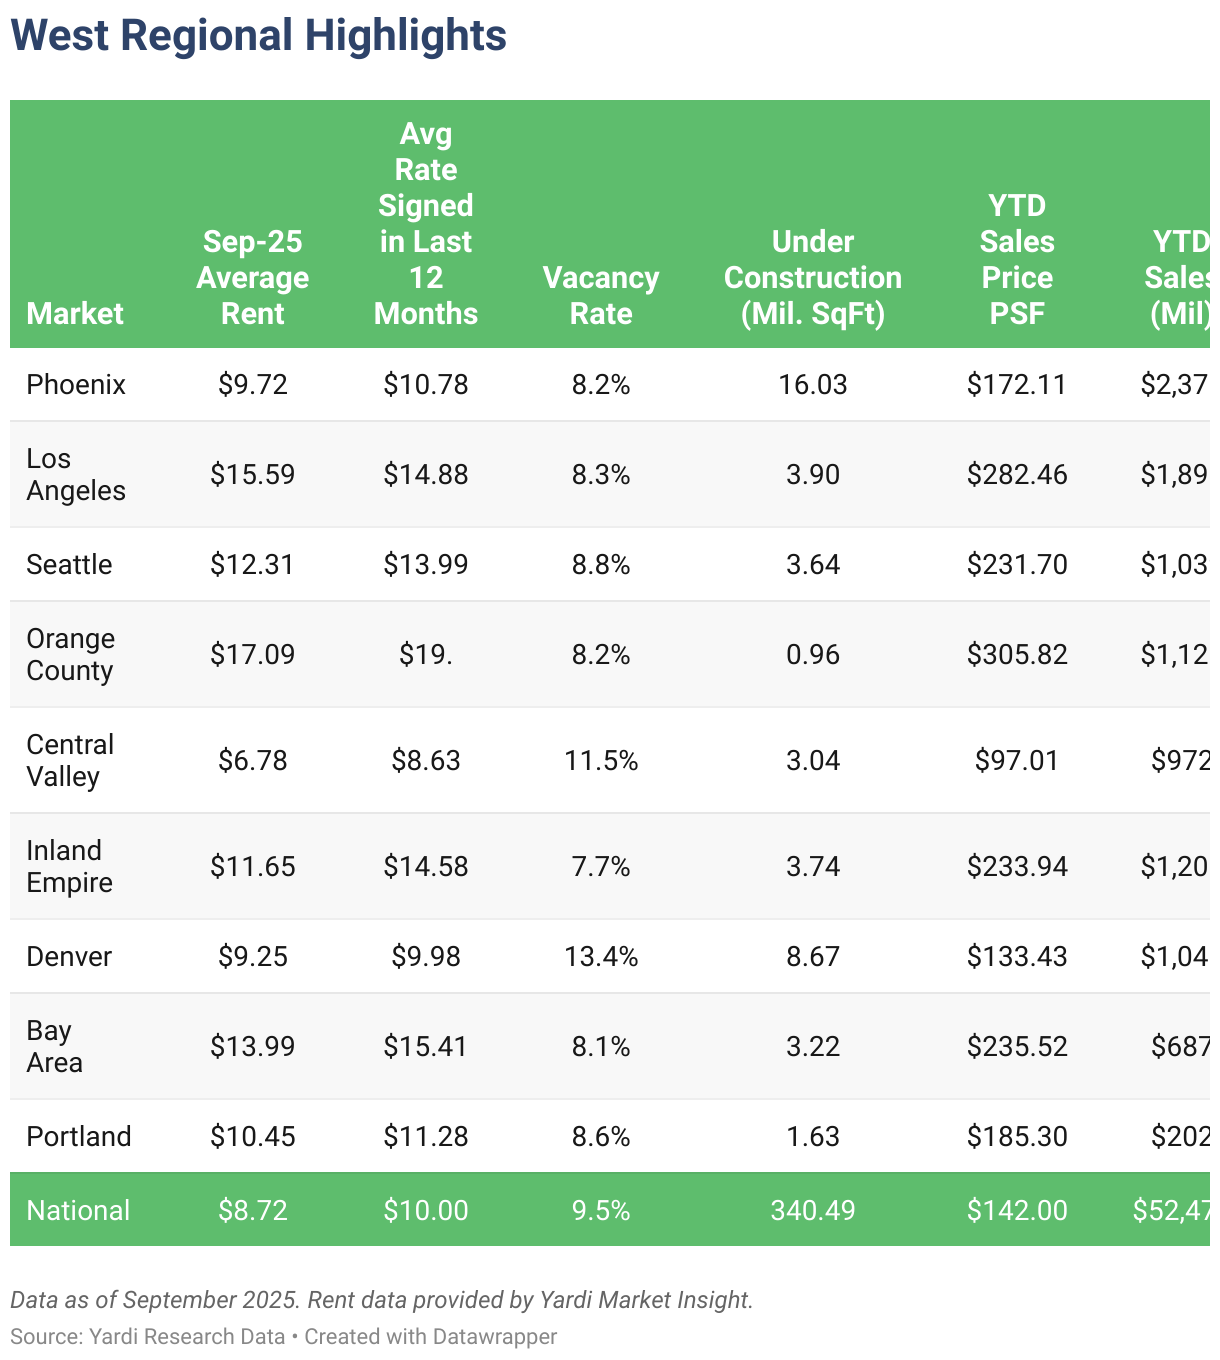
In September, year-to-date industrial sales in Orange County surpassed $1 billion, making it the one of six Western markets to exceed that mark. That said, the largest regional sales volumes were recorded in Phoenix ($2.4 billion), Los Angeles ($1.9 billion) and the Inland Empire ($1.2 billion). However, the largest year-over-year increase in sales was recorded in California’s Central Valley, where the $972 million in transactions recorded so far represent a 123% increase compared to September 2024.
Construction across the West Coast remains muted amid market uncertainty. Space under construction in Portland totals 1.6 million square feet, which is down one-third compared to last year. And, while Orange County’s pipeline is 23% higher compared to year-ago amounts, it still totals less than 1 million square feet. However, the 8.7 million square feet currently being built in Denver — 15% more compared to last year — will expand the market by an estimated 3.1% for the second-largest inventory increase in the Western U.S. and the third-largest nationwide.
Midwestern Markets
Kansas City Sales Spike as Regional Prices Stay Affordable
Industrial construction in the Minneapolis-St. Paul area continues to pick up, driven by comparatively low vacancies and the metro’s logistics desirability. Current projects total 6.5 million square feet, making for the third-largest pipeline in the Midwest and representing a 250% spike compared to last year’s pipeline. Construction in Indianapolis is also up by 140% annually, while the increase in Cincinnati is 120%. It’s worth noting here that select inland logistics hubs are seeing construction rebound as vacancies balance out, which is consequently leading to a new wave of logistics facilities. The remaining markets saw stagnating or decreasing pipelines. These ranged from the 1% increase in Chicago industrial space construction to a 61% construction slowdown in Kansas City, despite the market’s ongoing tightening in terms of vacancies.
Investment activity in Kansas City also spiked in September. A series of sales — including the off-market purchase of Logistics Park Kansas City and a seven-building portfolio deal in Johnson County — brought the market’s total sales to $675 million, which was almost double the amount in August and several magnitudes larger than last year’s sales figures in the same timeframe. In terms of average sale prices, the Midwest is still the most affordable region, with five markets averaging less than $100 per square foot in year-to-date transactions.
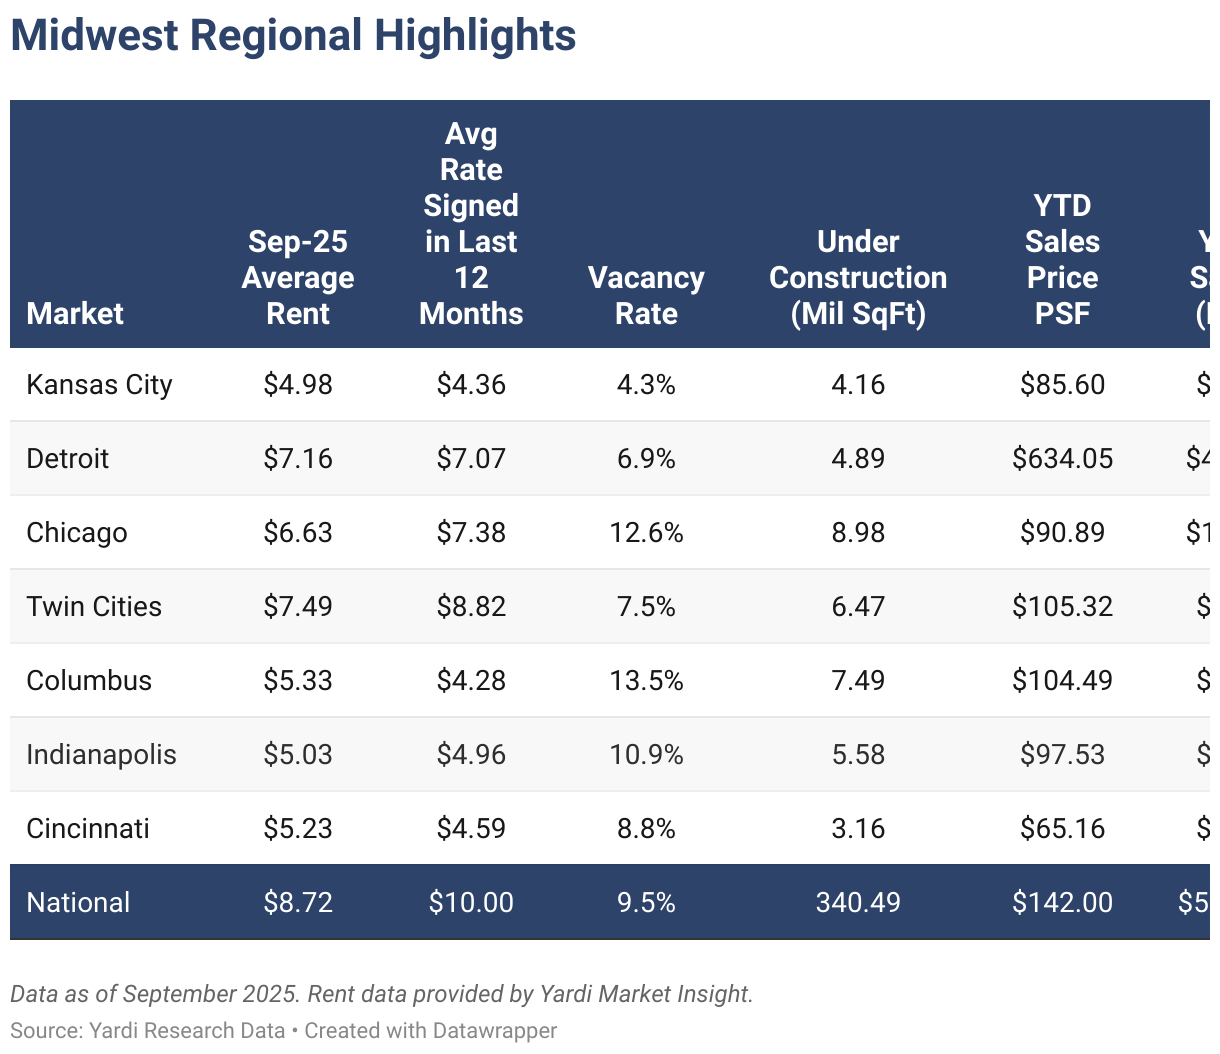
As industrial real estate finds its footing in the wake of oversupply conditions, some markets are already seeing rising occupancy rates. St. Louis leads the way for vacancy contraction, with the rate plummeting from 8.2% in September 2024 all the way to 6.7% at the end of last month. Across the state, Kansas City saw a similar 90-basis-point drop, reaching 4.3% and maintaining its title as the tightest industrial market nationwide. Elsewhere in the Midwest, vacancy rates ranged between 7.5% in the Twin Cities (up 140 basis points annually) and 13.5% in Columbus (up 840 basis points annually).
However, several Midwestern markets continue seeing sluggish rent growth into the end of the year. Namely, St. Louis industrial real estate has one of the slowest rent growth rates among all major U.S. industrial markets at 2.8%, increasing to just over $5 per square foot in the span of a year. Rent gains in Indianapolis were also modest, averaging out 3.1% over the last year. Rent growth in Detroit and Kansas City was also low at 2.7% and 3.3%, respectively. Speaking of Kansas City, it’s still the most affordable Midwestern market in absolute terms as well as the second-most affordable nationwide with an average in-place rent of $4.98 per square foot.
Southern Markets
Region Sees Sustained Rent Growth
Investors continued their pivot from existing properties to new developments in several Southern markets. In particular, Houston’s industrial pipeline now totals more than 18.2 million square feet of space, up 91% on the year, while year-to-date sales in the market stand at $1.8 billion, marking a decrease from the $2.1 billion at the same point in 2024. Sales volume for industrial space in Memphis is also down 32%, while the amount of space underway in the market climbed by 24% in the same time span. Further south, Tampa, Fla., and Atlanta saw similar shifts in demand, indicating another potential period of expansion for the region that benefits from a conjunction of e-commerce growth, population inflows, and development of advanced manufacturing sites and data centers.

Mounting demand for industrial space in the South was also reflected in the region’s strong rent growth numbers: Several markets recorded increases above the national average of 6.1%, with industrial space in Miami and Atlanta leading the way at 8.5% year-over-year. Dallas-Fort Wort also saw rents growing by around 7.4% annually, showcasing the sustained interest shown by occupiers looking to secure space in critical logistics hubs.
Vacancy rates remained mixed regionally. At one end of the spectrum, Houston recorded a vacancy rate of 6.4% at the end of September — a regional minimum and the third-lowest rate nationally — after a 70-bps drop since last year. Conversely, several markets still contend with vacancy rates in the low double-digits: Memphis (12.5%, up 400 bps Y-o-Y), Charlotte (11.2%, up 710 bps), Miami (11.1%, up 630 bps) and Tampa (10.6%, up 30 bps).
Northeastern Markets
New Lease Spreads Continue Widening
Transaction activity continues at an elevated pace in the Northeast. Sales volume in Boston totaled $872 million at the end of September, which is more than double the amount recorded year-to-date in September 2024. On average, sale prices in the region also climbed from $156 per square foot to $171 per square foot in the same period. Meanwhile, transactions of industrial properties in Philadelphia amount to $851 million year-to-date (up 24% annually), whereas those in New Jersey total $2.2 billion (up 26% annually).
New lease spreads continue to highlight the desirability of Northeastern port markets for occupiers. The region’s markets still claim some of the highest new lease premiums nationwide. In particular, leases for industrial space in Bridgeport signed in the last 12 months are $5.13 more expensive per square foot compared to in-place leases, while the delta sits at $3.25 per square foot in Philadelphia and $2.83 in New Jersey. Additionally, leases signed in the last 12 months in Philadelphia average $11.8 per square foot, which is 14% higher compared to leases signed in the 12 months prior to that. New leases in Bridgeport are also 11% more expensive compared to those signed in the previous year. Boston is the region’s only market to see drops in recent rents.
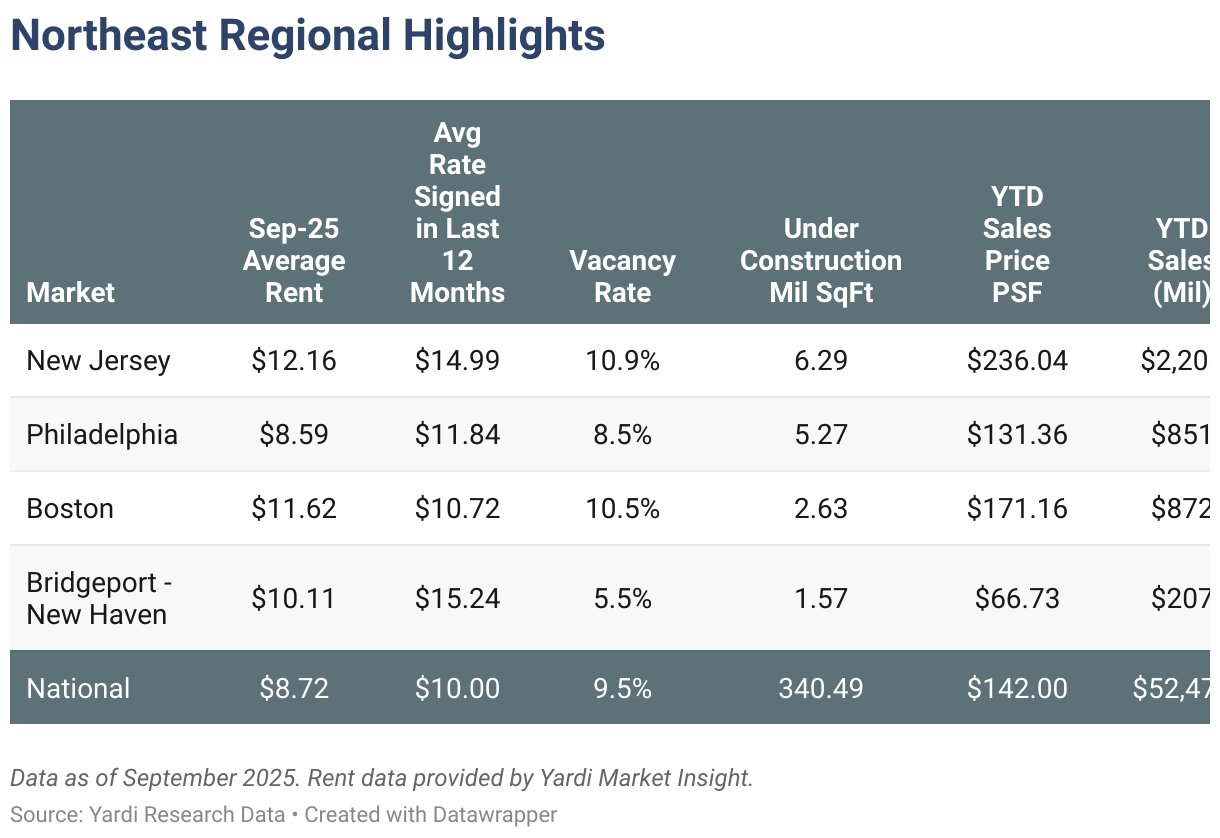
The tightest Northeastern market at the end of September was Bridgeport, with vacancies resting at 5.5% after a 170-bps annual increase. Even after this sizable hike, the market still has the second-lowest vacancy rate in our study. Philadelphia came next with a rate of 8.5% — loosening by 240 basis points on the year — while vacant industrial space in New Jersey amounted to 10.9% to place among the 10 major markets with the highest vacancy rates nationwide.
Low construction activity regionally is contributing to rent crunch conditions. The region’s largest pipeline in New Jersey totals just under 6.3 million square feet of new stock, or a modest market expansion of around 1%. Not far behind, Philadelphia’s pipeline stands at 5.3 million square feet — an expansion of 1.1% — while Boston and Bridgeport have smaller construction pipelines at 2.6 million and 1.6 million square feet, respectively.
Economic Indicators
Producer Prices Dip Slightly in Last Data Set Before Government Shutdown Pause
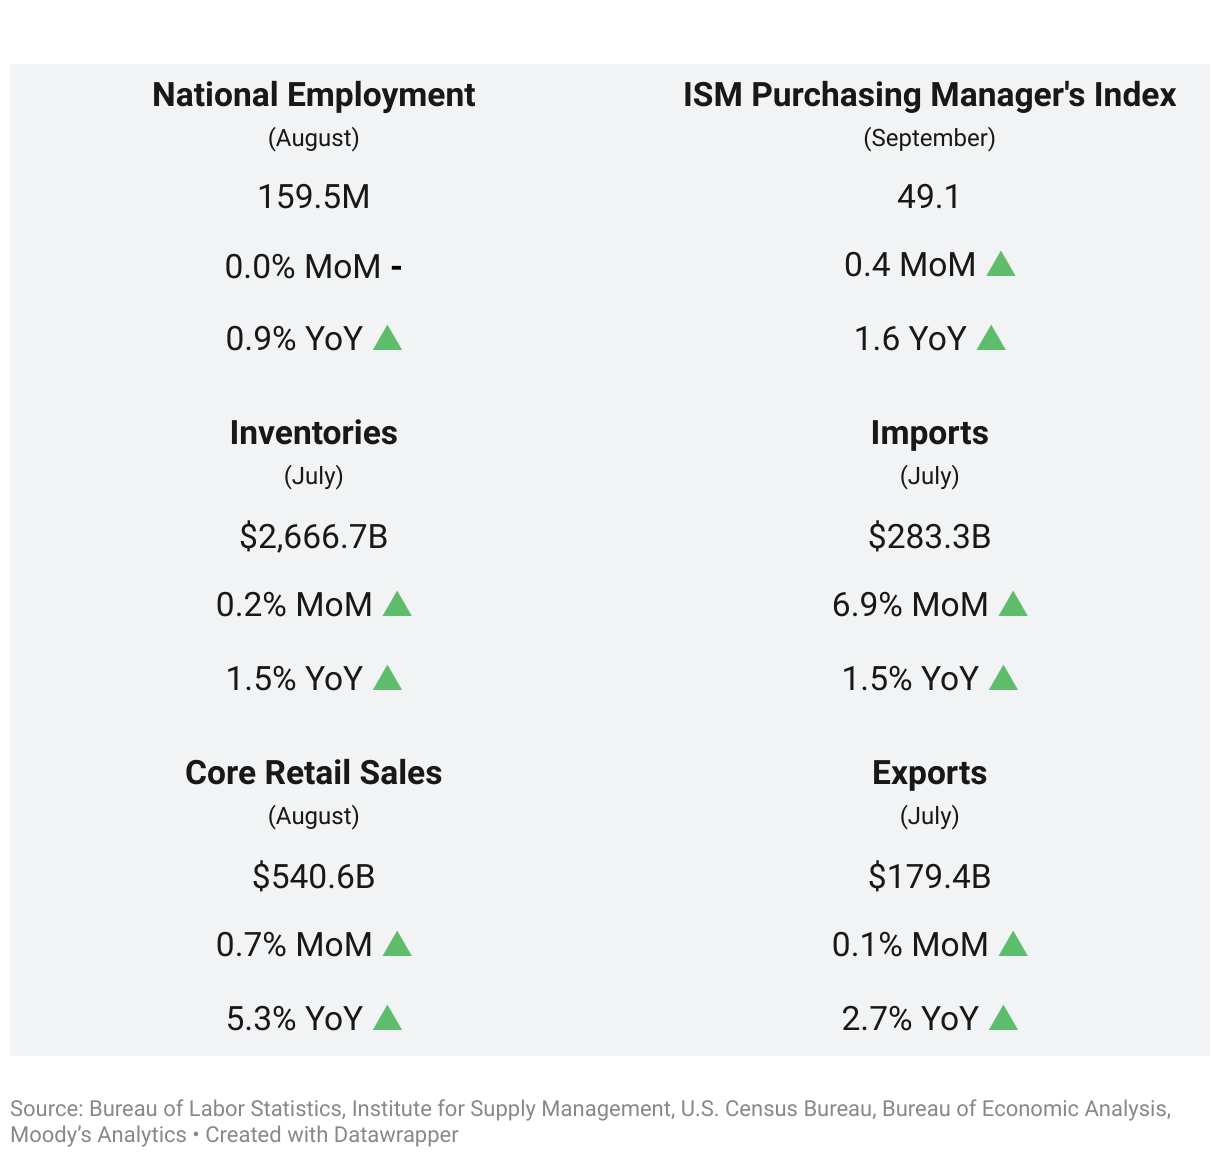
The Bureau of Labor Statistics’ Producer Price Index (PPI) decreased slightly by 0.1% in August to bring the year-over-year figure to a 2.6% increase. To be precise, the goods portion of the index rose by 0.1%, increasing by 2.2% Y-o-Y. Meanwhile, services dropped by 0.2% for an annual rise of 2.9%. The decrease in producer prices comes as welcome news after the red-hot increase of 0.7% in July, which marked the largest hike in more than three years.
The August PPI may be the last available reading for a while due to the government shutdown as most data sets published by the BLS are delayed. What’s more, a delay in the flow of data will make decisions more difficult for the Federal Reserve, as well as on Wall Street, as they both closely track economic indicators. That’s because the PPI is not only a leading indicator alongside the more closely followed consumer price index, but also one of the key indicators tracked by the Fed when determining interest rates.
Methodology
The monthly CommercialCafe national industrial real estate report considers data recorded throughout the course of 12 months and tracks top U.S. industrial markets with a focus on average rents; vacancies (including subleases, but excluding owner-occupied properties); deals closed; pipeline yield; forecasts; and the economic indicators most relevant to the performance of the industrial sector. Listing rate and occupancy information was based on Yardi Research data.
- Average Rents: Provided by Yardi Market Expert, a cutting-edge service that uses anonymized and aggregated data from other Yardi platforms to provide the most accurate rental and expense information available.
- Vacancy: The total square feet vacant in a market, including subleases, divided by the total square feet of industrial space in that market. Owner-occupied buildings are not included in vacancy calculations.
Stages of the supply pipeline:
- Planned: Buildings that are currently in the process of acquiring zoning approval and permits, but have not yet begun construction.
- Under Construction: Buildings for which construction and excavation has begun.
Sales volume and price-per-square-foot calculations for portfolio transactions or those with unpublished dollar values are estimated using sales comps based on similar sales in the market and submarket, use type, location and asset ratings, sale date and property size.
Year-to-date metrics and data include the time period between January 1 of the current year through the month prior to publishing the report.
Market boundaries in the CommercialCafe industrial report coincide with those defined by the CommercialCafe Markets Map and may differ from regional boundaries defined by other sources.
Fair Use & Redistribution
We encourage you and freely grant you permission to reuse, host, or repost the research, graphics, and images presented in this article. When doing so, we kindly ask that you credit our research by linking to CommercialCafe.com or this page so that your readers can learn more about this project, the research behind it and its methodology. For more in-depth, customized data, please contact us at [email protected].


Lucian Alixandrescu
Senior Content Writer, CRE Industry Reports & Studies
Lucian is a senior content writer for CommercialCafe, specializing in commercial real estate research and data-driven reporting since 2019. With deep expertise in industrial real estate, office markets, demographics, and economics, he produces comprehensive market studies and insights on national and regional CRE trends. He also reports on adjacent subjects such as population shifts and the job market. His reports have been cited by and featured in The New York Times, Forbes, NBC, Bisnow, The Business Journals, and Yahoo Finance. Lucian holds a background in language and literature studies and brings more than 5 years of previous freelance writing experience to his commercial real estate journalism.