Bay Area, San Francisco Q3 2019 Office Sales: SF Office Sales Double Y-o-Y


Executive Summary
- Google shells out $1 billion for Sunnyvale office complex in Q3’s top deal
- Bay Area office sales volume increases 35% from Q2; average price per square foot stays above $500
- San Francisco office sales volume sees best quarter in 5 years, growing 106% from Q2 and 124% year-over-year (Y-o-Y)
- 18 projects completed in Q3; Chase Center office space set to open in December
The San Francisco and Bay Area office markets have recovered from their sluggish Q1 and Q2, witnessing the best quarterly sales volume in five years.
The Bay Area saw $2.9 billion change hands in 23 office deals. Average prices once again climbed above the $500 mark, resting at $531 per square foot. In total, 4.5 million square feet were traded in the deals—a 6% decrease from the last quarter and 23% less than Q3 2018 totals.
San Francisco office deals came up to $2.6 billion this quarter, with median prices landing at $770 per square foot. The 16 assets sold in Q3 2019 add up to 3.3 million square feet, the largest amount traded since Q4 2016.
The largest deal alone—the purchase of Yahoo!’s Sunnyvale Complex by Google—brought in $1 billion. Additionally, 18 office projects were delivered between July and September, and five others are scheduled for Q4 2019. Read on to find out more details about how the San Francisco and Bay Area office markets fared this quarter.
Google Bets $1bil on Silicon Valley, Buys Yahoo! Sunnyvale Complex from Verizon
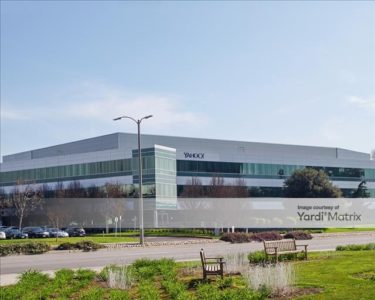
Yahoo! Sunnyvale Complex – Building A, 701 1st Ave., Sunnyvale, CA
Google paid top dollar for the Yahoo! Sunnyvale Complex in Q3’s biggest deal. The tech giant paid $1 billion for several Sunnyvale properties, including the headquarters of web service provider Yahoo!. The campus—situated at 700-701 1st Ave., 1350 North Mathilda Ave., and 589 West Java Drive in the Moffett Park neighborhood—were previously acquired by Verizon in 2017 as a part of its acquisition of Yahoo!. Commercial real estate firm CBRE helped broker the deal. This transaction continues Google’s Silicon Valley expansion, after it acquired HCP’s Britannia Shoreline Technology Park in November 2018 for another $1 billion.
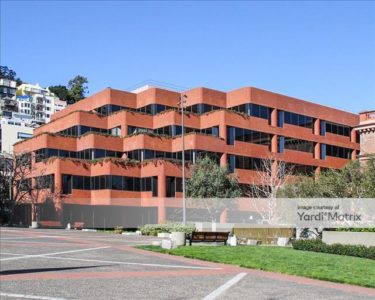
Levi’s Plaza, 1255 Battery St., San Francisco, CA
The second-largest deal saw the Levi Strauss & Co. headquarters and Levi’s Plaza change hands; a partnership headed by Gerson Bakar & Associates sold the property to developer Jamestown for $826 million. Situated along San Francisco’s Embarcadero waterfront, the 863,000-square-foot property is 99% leased to Levi Strauss until 2022. Atlanta-based Jamestown also has Ghirardelli Square, another San Francisco waterfront property, in its portfolio.
Other major deals include the sale of the Zynga headquarters to Beacon Capital Partners, and the acquisition of the San Francisco property at 600 California Street by coworking powerhouse WeWork.
Bay Area Sees Sustained Interest, 36% Quarter-Over-Quarter Growth in Total Sales Volume
It was a busy quarter for the Bay Area office market, which saw more than $2.9 billions in total sales volume in just 23 transactions–a 35% increase in volume from Q2’s $2.1 billion, which was spread over 30 deals. This means that Q3 2019 was the best quarter in five years in terms of office transactions; but, it also shows that large sums of money are being traded in a smaller number of significant deals.
On the other hand, the total square footage of the properties sold was 4.5 million–less than Q2’s 4.8 million and significantly below Q3 2018’s 5.8 million. Combined with the relatively low number of deals, this shows that the available inventory is more highly valued. After stumbling last quarter, average prices per square foot climbed to $531—marginally lower than they were around this time in 2018. Admittedly, this quarter’s prices were propped up by the prime price Google paid for the 617,000 square feet of office space in Sunnyvale.
Overall vacancy rates in the Bay Area ended Q3 at 14.3%. Class C office space saw the least vacancy at just 9.5%. Class A and B followed, at 13% and 15.6% vacancy, respectively. Coworking offices and other non-traditional types of office space reached 2.7 million square feet in the Bay Area, or 1.4% of the total office inventory.
While office lease costs dipped below $59 per square foot in the first part of Q3, they later climbed back up to near-Q2 levels towards September. Along the same lines, rent costs for Class A office space reached $59.21 at the end of this quarter, a small increase from the $59.16 recorded in June, but a 13% increase when compared to prices from September 2018. Prices for Class B offices dipped below $39 per square foot, while the steady rise of Class C office rents witnessed since Q4 2018 eventually petered out at $28 per square foot.
San Francisco Office Sales See Best Quarter in 5 years with 124% Y-o-Y Growth in Traded Volume
Office space in San Francisco appears to be in high demand, with more than $2.6 billion sales volume spread out over 16 transactions this quarter. This more than doubled the sum traded in Q2 and was a whopping 124% increase in comparison to Q3 2018.
Close to 3.3 million square feet of office space changed ownership between July and September–the most since Q4 2016. Average prices per square foot landed at $770, below the spike recorded in Q1 this year, but still well above prices registered in Q3 2018.
As far as vacancy, San Francisco office spaces had an overall vacancy rate of 7.6% this quarter. Trophy office space is in high demand, as vacancy rates for Class A+ offices were only 2.3%. Vacancy for both Class A and Class C finished the quarter around 6.5%, while Class B was slightly higher at 10.3%. Out of the total inventory in San Francisco, over 3.9 million square feet—or 2.6% of the total—is non-traditional, such as coworking office space.
Lease rates passed the $75 per square foot mark in September 2019. Average rent for trophy office space dropped $3 from the previous month to $110 per square foot, but are still much higher than they were in September 2018. While lease rates for Class B initially climbed to $55 per square foot in August, they later fell back below $54 by September. Class C office space was leased for around $30 per square foot on average in September—$2 below August rates, but on par with those of September 2018.
18 Major Projects Delivered in San Francisco & Bay Area in Q3; 15 Others Scheduled for Q4
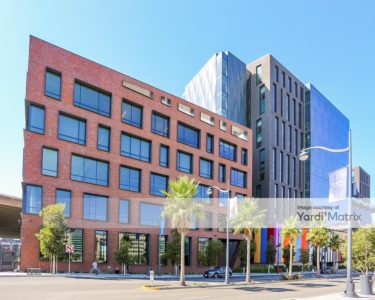
The Exchange on 16th, 1800 Owens Street, San Francisco, CA
In Q3, 14 properties were added to the San Francisco inventory, and four more were completed in the Bay Area. The Exchange on 16th alone added 750,000 square feet of office space to the San Francisco office market. The LEED Platinum-rated complex consists of four connected buildings and has been fully leased to cloud storage service Dropbox.
Over in the Bay Area, the Moffett Towers II Buildings 3-5 were completed, totaling more than 1 million square feet of new office space. Situated at the former Lockheed Martin site in Sunnyvale, this complex also received a LEED Platinum rating. It includes an outdoor amphitheater and 3,403 parking spaces.
The office pipeline for Q4 is equally crowded. The Chase Center in San Francisco is poised to add 680,000 square feet of space to the market’s inventory, in addition to its sports arena. Another mixed-use project scheduled for a December launch is the Uptown Station in Oakland, which is set to contain 404,000 square feet of rentable office space between its second and eighth floors. Moreover, 13 other major projects are poised to open their gates in Q4 2019 in San Francisco and the Bay Area.
Methodology
For this report, we relied on Yardi Matrix data to analyze all office transactions that closed in the San Francisco and Bay Area markets during the third quarter of 2019 (July through September). Only those with price tags equal to or larger than $5 million were selected. Our research, based on sales data recorded through November 5, 2019, includes completed office buildings that are equal to or larger than 25,000 square feet.
Regarding mixed-use assets, only properties with more than 50% office space were considered. Portfolio deals were counted as single transactions, while distressed sales were excluded altogether. To ensure that the trends and comparisons presented in our report were valid, we also excluded “ownership stake,” “ground lease,” “controlling interest,” “portfolio” and “undisclosed” deals from our calculation of the average price per square foot.
Vacancy rates and lease rates were extracted from Yardi Matrix data as of November 1, 2019. To calculate the percentage of non-traditional office space out of total inventory, we used data from the Yardi Matrix Special Report of October 2019.
Although we have made every effort to ensure the accuracy, timeliness and completeness of the information included in this report, the data is provided “as is,” and neither CommercialCafe nor Yardi Matrix can guarantee that the information provided herein is exhaustive.
Property images courtesy of Yardi Matrix.


Lucian Alixandrescu
Senior Content Writer, CRE Industry Reports & Studies
Lucian is a senior content writer for CommercialCafe, specializing in commercial real estate research and data-driven reporting since 2019. With deep expertise in industrial real estate, office markets, demographics, and economics, he produces comprehensive market studies and insights on national and regional CRE trends. He also reports on adjacent subjects such as population shifts and the job market. His reports have been cited by and featured in The New York Times, Forbes, NBC, Bisnow, The Business Journals, and Yahoo Finance. Lucian holds a background in language and literature studies and brings more than 5 years of previous freelance writing experience to his commercial real estate journalism.