Here Today, Gone Tomorrow: Fastest Declining Jobs in the US


Recently, we looked at the fastest-growing jobs in the U.S. between 2009 and 2018, using data from the Bureau of Labor Statistics (BLS). This time, we decided to look at the other end of the job market, to find out which professions are in decline and by how much.
Our research measured job decline in terms of the percentage decrease in the total number of employees within an occupational category. While not all waning professions are suffering because of increasing automation in the workplace, many of them are vulnerable to it. Consequently, we also added information about each occupation’s risk of automation.
Keep reading for more details about the declining jobs by state and nationally. Learn more about our methodology here.
Phone Operator Jobs Down by 77% Since 2009
Here are the 10 jobs that witnessed an over 50% decline in the number of workers in the last 10 years.
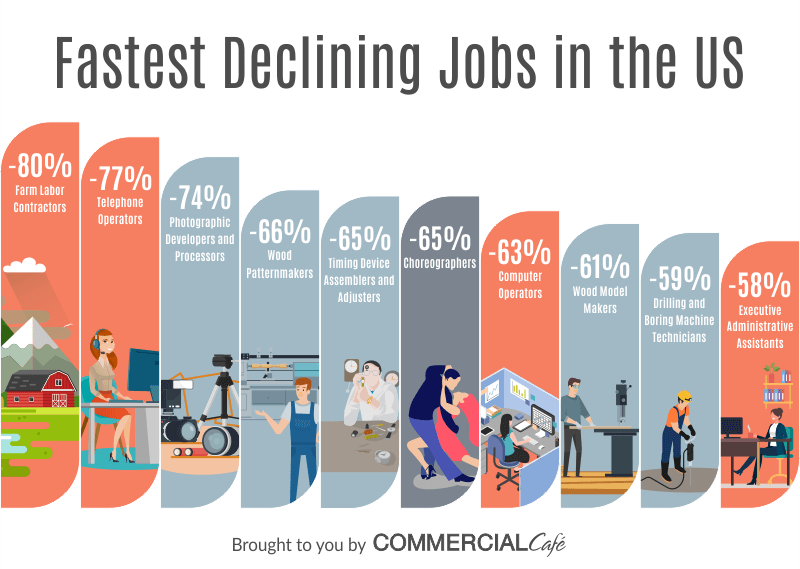
At the top of the list of fastest-declining jobs in the U.S. are farm labor contractors. They hire and transport agricultural workers for farm and food processing activities. There were roughly 1,000 such jobs in 2009―but after an 80% drop―the current number rests at just 200. Throughout the last decade, the number fluctuated, but it never fell below the 700 mark until two years ago, when it took a 74% dive.
Several factors might be contributing to this decline. A 2019 survey by the California Farm Bureau Federation found that 37% of farmers had switched to crops that required less human labor due to employee shortages. The survey also found that 56% of farmers considered mechanization and labor-saving technologies for their operations, which would further reduce the need for farm labor contracting―even though 61% of respondents also reported having hired a farm labor contractor to help recruit workers.
Choreographers are in sixth place, tied with timing device assemblers and adjusters in terms of their occupations’ percentage of decline. Previously, choreographers could aspire to work full-time for a theater or dance company, avoiding the infamous day job that many arts graduates need to take to afford to pursue their vocation. However, since the recession, some companies―such as the Dance Theater Workshop and the Bill T. Jones/Arnie Zane Dance Company have merged―while some like the Trey McIntyre Dance Project have disbanded. Moreover, funding for the arts has not rebounded and, for many choreographers, the only alternative that offers a modicum of financial and professional stability is to become tenured faculty members. Consequently, their numbers have dropped by 65% since 2009, currently resting at nearly 5,100.
Some occupations suffered smaller losses in terms of percentage. But when there are a large number of people employed within the field, job losses have a considerable influence on the labor market. For instance, there are currently 570,530 workers employed as executive secretaries and administrative assistants; this is down by 58% since 2009, when there were nearly 1.37 million.
There are also fewer jobs for computer operators. A decade ago, there were roughly 94,730 employees with that job description. By 2018, the number had decreased by roughly 60,000, reaching only 34,700.
Illinois Boilermaker Jobs Fell by 96%, the Highest Nationwide Percentage Drop
Below is a map of the continental US that highlights each state’s fastest declining occupation between 2009 and 2018. Hover over the states for more details.
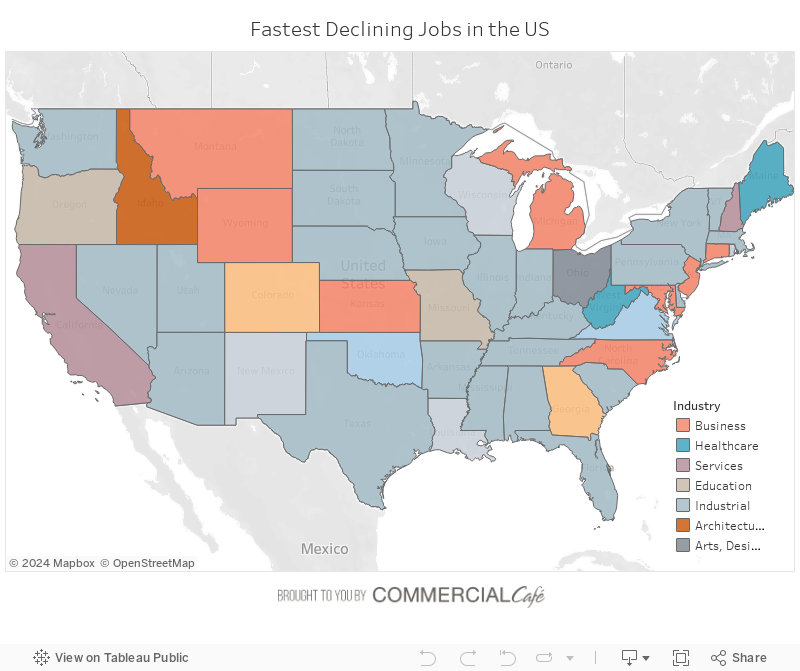
Unsurprisingly, in most U.S. states―from the Midwest to the South and North Pacific―the fastest declining occupations are in the industrial sector. The greatest drop in terms of percentage for industrial jobs was in Illinois, where the number of boilermakers within the state fell by 96%―going from 1,910 workers in 2009 to just 80 in 2018. While the process of making boilers has been mostly automated, employees are still needed for tasks that require precision and finesse. They are also largely responsible for maintenance and repair of the boilers. In the last decade, Illinois boilermakers’ mean income has also decreased from $73,000 to roughly $69,000.
Similarly, in Massachusetts there were 610 avionics technicians 10 years ago, earning an annual mean wage of $62,594. But, in the last decade, the total number of workers in this field decreased by 95%. The silver lining is that their income has grown by $7,596 since the financial crisis.
Various jobs in the business sector have also witnessed significant net losses in Connecticut, Kansas, Maryland, Michigan, Montana, New Jersey, North Carolina and Wyoming. For instance, the number of workers in telemarketing positions in Montana went from 1,110 in 2009 to just 70 in 2018. That 94% drop was accompanied by dwindling incomes. In terms of real dollar value, the current mean wage of $24,090 is $4,748 less than the salary employees received a decade ago.
Proofreaders & Copy Marker Jobs in Maryland Declined by 83%, but Their Earnings Went Up by 31%
While some business sector occupations are losing workers at significant rates, some of these declining jobs have seen important income gains. Proofreaders and copy markers’ earnings in Maryland have jumped by roughly $13,000 since the recession, currently averaging $54,780. Order clerks in Wyoming had a $31,146 wage in 2009; nearly a decade later, after a 28% bump, those employed in this occupation earn nearly $40,000 on average.
The table below details the fastest declining occupation in each state, including the percentage of decline and the total number of jobs lost in the 10-year period.
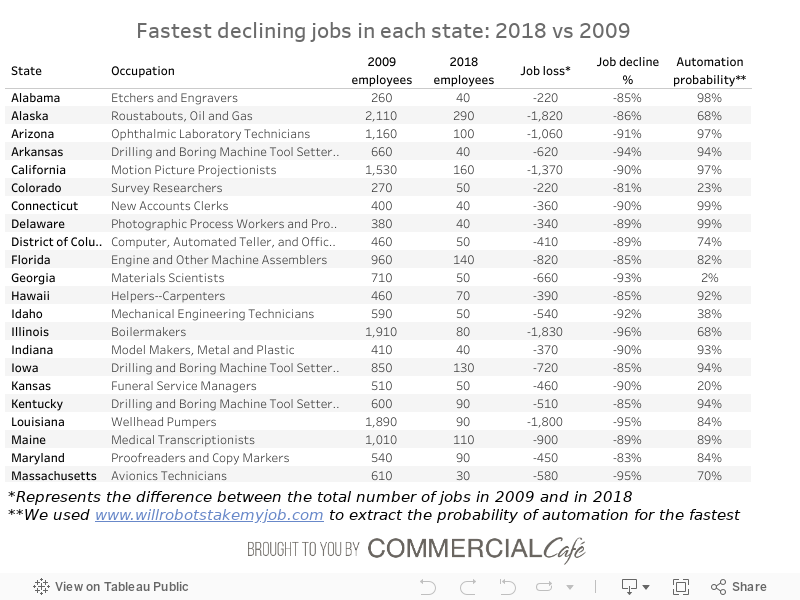
Since 2009, there has been a 90% decrease in the number of projectionists in California―from 1,530 to just 160. The fate of the motion picture projectionist has been tied to the evolution of the public’s consumption preferences and technical innovation. In the 1940s, there were roughly 31,000 projectionists nationally, and the profession was listed as the highest-paid industrial job in California. As audiences shifted toward television and cinemas switched to digital versions as opposed to film rolls, the projectionist’s skills became less relevant. In fact, in many multiplexes, it is often the theater manager who has taken on these tasks. According to the U.S. Department of Labor, projectionist jobs are expected to decline by a further 10% by 2026. The automation probability for this job is 97%, as estimated by Carl Benedikt Frey and Michael Osborne in their 2013 study on the impact of future computerization on US labor.
In Pennsylvania, chemical plant and system operators are the fastest declining occupation, with a 92% decrease between 2009 and 2018. There are currently 160 workers overseeing and operating machine systems and various processes in chemical plants across the State of Independence. Their incomes have increased by roughly $4,400 or 7.4% in the last decade, currently reaching an annual mean salary of $63,170.
The reasons for this job’s decline are manifold. First, these positions have an 85% probability of automation, and chemical plant and system operator jobs are projected to decline by 11.5% nationally by 2026, according to BLS data. Second, as the pressure to move beyond petrochemicals and toward more environmentally friendly alternatives increases, many graduates opt for safer, more accessible and more lucrative jobs in the tech industry.
Despite High Automation Risk for Many Jobs, Churn Rate Is Lowest Since 1850
The maps below are interactive. You can select one or multiple industries on the right. The top map shows the percentage of occupations from the selected industries within the 48 continental states. The bottom map displays the number of employees for your current selection.
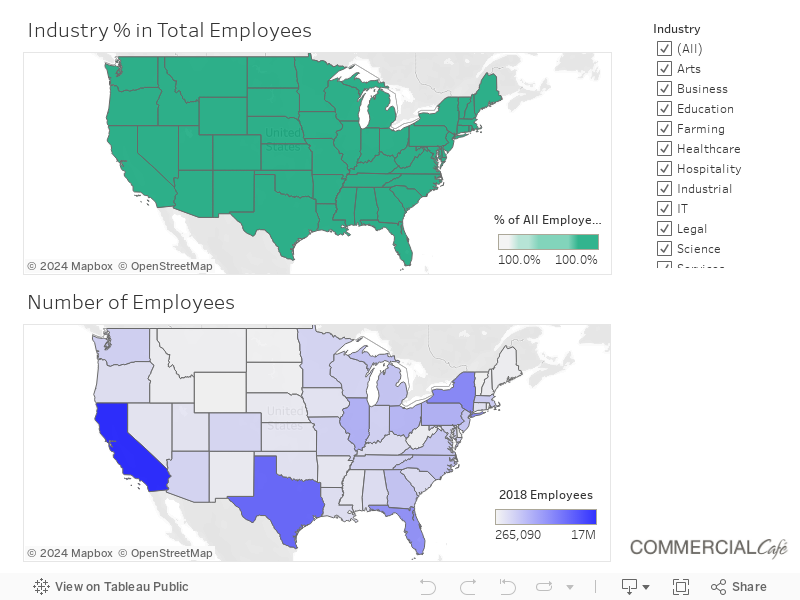
Given the uneven distribution of jobs from various industries across the states, the decline of jobs within the hospitality industry is going to be felt more in certain places than others. For example, in Nevada, the hospitality industry represents 14% of the job market. In California and Texas, there are nearly 1.6 million and 1.2 million employees, respectively, holding hospitality industry jobs―than in places like Utah or Wyoming.
Healthcare industry jobs have the largest share of the job market in West Virginia―at 17.1% and 117,000 employees―followed by Maine and Pennsylvania with 16.5%. But in terms of number of healthcare industry employees, the top three states are California, New York and Texas.
The job market has been seen important changes in past decades, and the decrease of many occupations was accelerated by the previous financial crisis. But, how significant is the current shift compared to past periods of economic transformation?
According to a study by the Information Technology and Innovation Foundation, the difference between jobs added in growing occupations and jobs lost in declining fields―also known as the churn rate―is the lowest in American history. The highest disparity on record was 50% between 1850 and 1870, dropping to 25% between 1920 and 1980. In the 1990s, it fell to 20%, then to 14% in the 2000s. The churn rate was just 6% during the first half of the 2010s. The share of jobs disappearing as a result of technological innovation is also the lowest it has been since the 1950s and 1960s.
Methodology
Using data from BLS Occupational Employment Statistics, we looked at the highest percentage drops for each continental U.S. state between 2009 and 2018.
For the top 10 fastest declining jobs in the U.S., we included occupations that had a decrease of at least a 50% in the last decade. All jobs falling under the “All other” category were also excluded due to lack of details (such as “Social Sciences Teachers, Postsecondary, All Other”).
The state-level list of the fastest declining jobs excludes occupations falling under the “Miscellaneous/All Other” category (such as “Miscellaneous Mathematical Science Occupations” in California and “Miscellaneous Construction and Related Workers” in Michigan).
We used www.willrobotstakemyjob.com to extract the probability of automation for the fastest declining jobs. The site is based upon Carl Benedikt Frey and Michael Osborne’s 2013 report, “The Future of Employment: How susceptible are jobs to computerisation?”
Annual mean earnings cited are per data from the Bureau of Labor Statistics. The wages are adjusted for inflation.


Diana Sabau
Senior Content Writer, CRE News & Market Analysis
Drawing on years of intense research in the U.S. commercial real estate market at Yardi Matrix, Diana now applies her expertise as a writer for the CommercialCafe blog. Her articles focus on CRE investment, labor market trends, and technology, and have been picked up by prestigious publications including the New York Times, GlobeSt, The Real Deal, NAIOP, MSN, and Bisnow.