Manhattan Office Sales Close Q4 2018 at Just $3.5B


Executive Summary
- sales volume drops 24% y-o-y to $3.5B in Q4
- average prices rise 11% y-o-y to $813 per square foot
- Terminal Stores sells for $880M in largest Q4 deal
- 55 Hudson Yards complete, 30 Hudson Yards on track for Q1 delivery
The Manhattan office sales market concluded Q4 2018 without the usual billion-dollar highlights. Though a higher number of sales closed compared to the previous quarter, the total dollar volume dropped 19% and the biggest transaction fetched a price tag of just $880 million. With Chinese buyers long out of the picture and other Asian investors such as Unizo selling off assets at a loss, record billion-dollar deals are no longer the quarterly norm. That’s not to say that the market is losing its appeal to investors–office construction is picking up the pace, with 9 projects totaling 4.7 million square feet of new space expected to come online in the first quarter of 2019. Moreover, while in terms of sales there were fewer highlights than usual this past year, when it comes to leasing office space, Manhattan recorded its highest yearly lease volume since 2001.
We used Yardi Matrix data to look at how the Manhattan office market fared in terms of sales during Q4 2018 (see ‘Methodology’). Read our findings below:
Office Sales Volume Drops 24% Y-o-Y to $3.5B
Manhattan office sales ended 2018 with a 24% year-over-year drop in total dollar volume, closing Q4 at $3.5 billion. This significant drop in sales is the result of seasonality and the absence of the billion-dollar deals we’ve grown accustomed to in this market. The largest 2 transactions of Q3 2018 topped the $1 billion mark, bringing the total sales volume up more than $4 billion. By comparison, while more sales closed during Q4, the largest deal of the quarter fetched $880 million, bringing the dollar volume down 19% compared to the previous quarter.
Japan-based Unizo Holdings sold three of its Manhattan properties in Q4–440 Ninth Ave., 370 Lexington Ave. and The Plant at 321 W. 44th–amounting to a total loss of $30 million for the company. Crain’s New York views this loss to be the result of optimistic and unrealistic ‘assumptions of rental growth and further price appreciation,’ which led investors to bet big on Manhattan assets and acquire properties at record prices. The $269 million sale of 440 Ninth Ave. was the only profitable one for Unizo, bringing in a $58 million profit, while the sale of 370 Lexington led to a $57 million loss, and the sale of The Plant brought about a $13 million loss in investments.
Average Prices Up 11% Y-o-Y to $813 per Square Foot
The average price per square foot for office buildings trading in Manhattan rose 11% year-over-year and 18% compared to Q3 2018, resting at $813 per square foot at the end of December. The final quarter of 2018 recorded the second-lowest Q4 price in five years, ‘topped’ only by the $729 average of Q4 2017. Overall, while the market is prone to yearly or even quarterly fluctuations, prices have been on a slightly downward path from 2015 onwards. As experts continue to try to gauge the future of the U.S. real estate market and figure out whether the industry is heading for another bubble, it will be interesting to see how prices will evolve throughout 2019. For now, even with price tags slipping, Manhattan is still one of the most appealing markets for both national and offshore office investors.
Terminal Stores Sells for $880M in Top Q4 Deal
The largest office deal of the quarter was Normandy Real Estate Partners’ and L&L Holding’s $880 million acquisition of the Terminal Stores property in Chelsea in October. The joint venture purchased the million-square-foot property from Waterfront New York and GreenOak Real Estate Advisors, for a price tag of $834 per square foot.
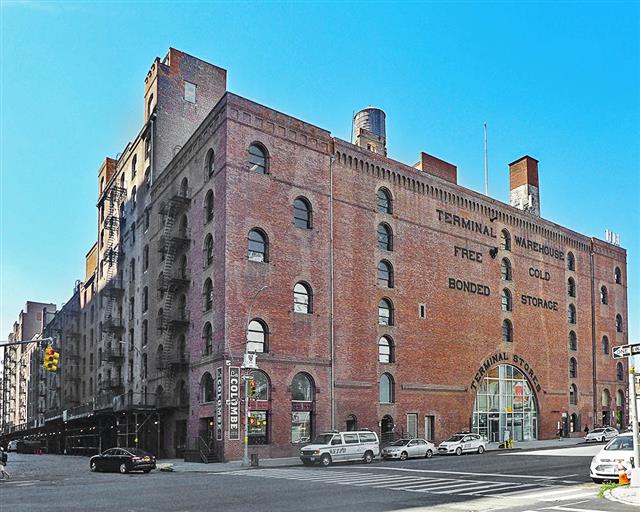
Terminal Stores, NYC (courtesy of Yardi Matrix)
Completed in 1891 as an industrial building, the property was converted to self-storage in 1984, and then to office space in 2012. Terminal Stores currently features 274,295 square feet of rentable Chelsea office space, as well as 527,491 square feet of self-storage space, 168,791 square feet of industrial space, and 84,399 square feet of retail, per Yardi Matrix data. The October sale of Terminal Stores was subject to a $652 million loan funded by Blackstone Group, Goldman Sachs, and Apollo Bank, due in 2020.
The second-largest transaction of Q4 2018 was the $701 million sale of 425 Lexington Ave. to Vanbarton Group in November, a deal that fetched a little more than $1,000 per square foot. Situated in Turtle Bay, the property consists of 686,634 square feet of Manhattan office space and 13,400 square feet of retail, and is subject to a 96-year unsubordinated net ground lease held by Reiss-Greenwald Enterprises, expiring in 2077.
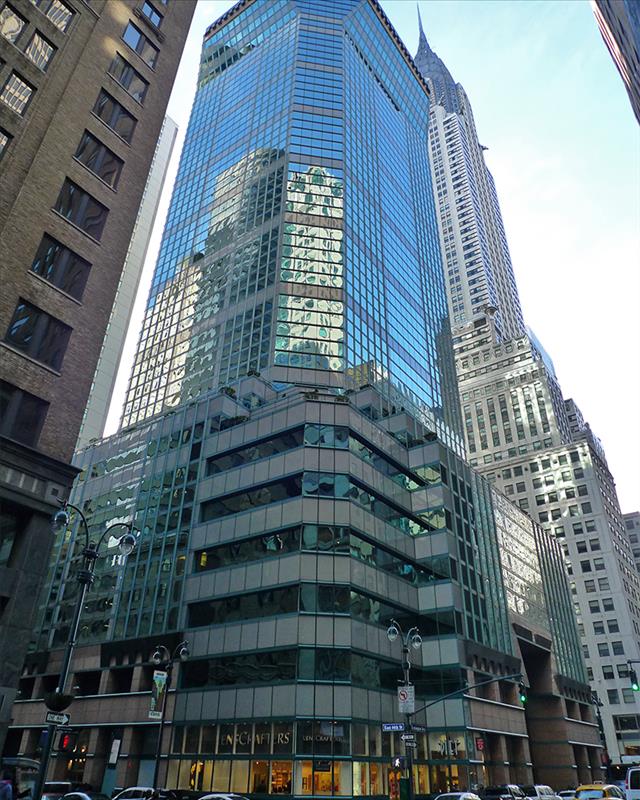
425 Lexington, NYC (courtesy of Yardi Matrix)
30 Hudson Yards Set to Bring 2.6 MSF of Office Space to Market in Q1
Following a lackluster Q3 in terms of completed projects, Q4 2018 saw three new office developments totaling 1.6 million square feet of space come online in Manhattan. The largest delivery of the quarter was the 1.3 million-square-foot 55 Hudson Yards at 550 W. 34th St. in Chelsea. The 51-story, Class A+ building is owned by Mitsui Fudosan America and is subject to a 30-year PILOT ground lease held by the New York City Industrial Development Agency, expiring in 2044. Managed by Related Cos., with CBRE handling the leasing efforts, 55 Hudson Yards is already home to a number of high-profile tenants, including HealthCor Management and Mount Sinai, according to Yardi Matrix data.
The first three months of 2019 are expected to be much busier, with 9 projects totaling 4.7 million square feet of office space on schedule for Q1 delivery. The largest project in the Q1 pipeline is another Hudson Yards staple–the 2.6 million-square-foot 30 Hudson Yards is scheduled for delivery this month. The 90-story spec tower already has a few major tenants lined up, including Wells Fargo, Oxford Properties, Related Cos., and building owner Time Warner.
By Ioana Neamt
Methodology
We used detailed Yardi Matrix data to analyze all office transactions with price tags equal to or exceeding $5 million to close in Manhattan during the fourth quarter of 2018. Our analysis, based on data recorded up until January 14, 2019, includes completed office buildings equal to or larger than 50,000 square feet that changed owners during the quarter. In the case of mixed-use assets, only properties featuring over 50% office space were taken into account. We counted portfolio deals as single transactions and excluded distressed sales altogether.
To make sure the trends and comparisons presented in our analysis are valid, we excluded portfolio, partial interest and ground lease deals from our calculation of the average price per square foot.
While every effort was made to ensure the timeliness and accuracy of the information presented in this report, the information is provided “as is” and neither CommercialCafe nor Yardi Matrix can guarantee that the information provided is complete.
Property images courtesy of Yardi Matrix.


Contributor
Our contributor content includes articles written by guest authors who are professionals in a variety of relevant fields and have contributed their expertise and detailed understanding of a range of topics, including: PropTech; real estate marketing tools and strategies, commercial real estate trends evolution; work-life balance management guidance and resources; workspace management and design; and more.