Chinese Investors Missing from Manhattan Q4 2017 Office Buyers List


Executive Summary
- Q4 sales volume up 85% y-o-y
- Average price per sq. ft. rests at $729, marking 16% drop from 2016
- SL Green, RXR close the largest office deal of Q4
- Chinese investors absent from Q4 office buyers list
- Manhattan closes the year with just 1 new office delivery
After hitting a five-year low during the third quarter of 2017, the New York office market gained back some steam in Q4, but not enough to bring the year to previous levels. In fact, 2017 turned out to be the weakest year in terms of office sales activity since 2013, with the yearly sales volume marking a 43% drop compared to 2016. The last three months of the year also seemed to confirm what industry experts had predicted for a while: given the increased scrutiny exerted by Beijing on outbound investments, Chinese buyers are disappearing from the U.S. office limelight. Read on to see how sales in the Manhattan office market fared during the final months of 2017, and find some insight on overall sales activity throughout the whole year.
Q4 Manhattan Office Sales Volume Up 85% Y-o-Y
Following a historically slow Q3, which saw just six office deals close for a little more than $990 million, the Manhattan office market had a busier fourth quarter. According to detailed Yardi Matrix data, the last three months of 2017 saw 10 office sales close for a total of $4.6 billion — a whopping 365% growth compared to the previous quarter and 85% above Q4 2016. However, while Q4 saw a recovery in quarterly sales activity, overall, 2017 marked a five-year low in terms of dollar volume for the market. A total of 32 office transactions closed during the year for $11.4 billion — the lowest sales volume since 2013 and well below the levels recorded in 2016.
Even so, the year-to-year decrease in sales volume doesn’t necessarily imply that the market has lost its appeal to investors, but is rather a result of dwindling supply and intense competition for high-quality assets. Demand, at least for now, seems to still be strong, as prices remained high throughout 2017.
Average Prices Close Q4 at $729 per Square Foot
Average prices for Manhattan office space continued a downward trend in Q4 2017, dropping 16% year-over-year and 11% compared to the previous quarter. Resting at $729 per square foot at the end of December, the average price per square foot for Manhattan assets marked the lowest Q4 since 2013, when buildings traded at an average of $465 per square foot.
Even with a slow couple of quarters, average market prices closed the year at $784 per square foot, a number just slightly below 2015 numbers. What this trend shows is that, despite a slowdown in terms of the number of deals closed and total dollar volume in 2017, office properties in Manhattan remain relatively expensive. Consequently, as long as investors (be they national or foreign) remain willing to pay top dollar to own office property in Manhattan, the market will continue to attract capital and be a top destination for office investment.
Largest Sale of Q4: SL Green, RXR Nab Worldwide Plaza for $840M
The largest office transaction of Q4 2017 closed in October, when SL Green and RXR Realty purchased a 48.7% ownership stake in Worldwide Plaza. The partnership shelled out $840 million to acquire the partial stake from New York REIT, which had paid $702 million to buy a 49.9% interest in the asset from George Comfort & Sons just a few months before.
The 49-story Worldwide Plaza is located at 825 8th Avenue and incorporates 2 million square feet of Clinton-Hell’s Kitchen office space, as well as 120,000 square feet of retail. The Class A tower, which was completed back in 1987, was cosmetically renovated in 2012 and is now LEED Gold-certified.
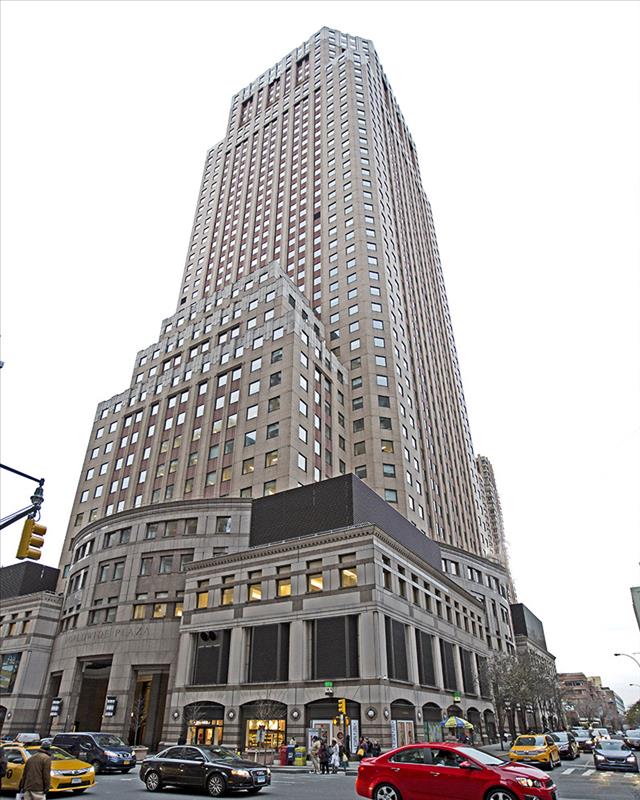
Worldwide Plaza, Manhattan
Clampdown Effect: No Chinese Investors on Q4 Buyers List
The largest Manhattan sale of the entire year closed in Q2, when Chinese investor HNA Group paid Brookfield Properties $2.2 billion for the 45-story tower at 245 Park Ave. At roughly 1.74 million square feet of Central Midtown office space, the sale worked out to nearly $1,276 per square foot. By comparison, Chinese investors were conspicuously absent from the buyer roster in Q4, which was to be expected, as Beijing increased its scrutiny of offshore real estate investments in 2017.
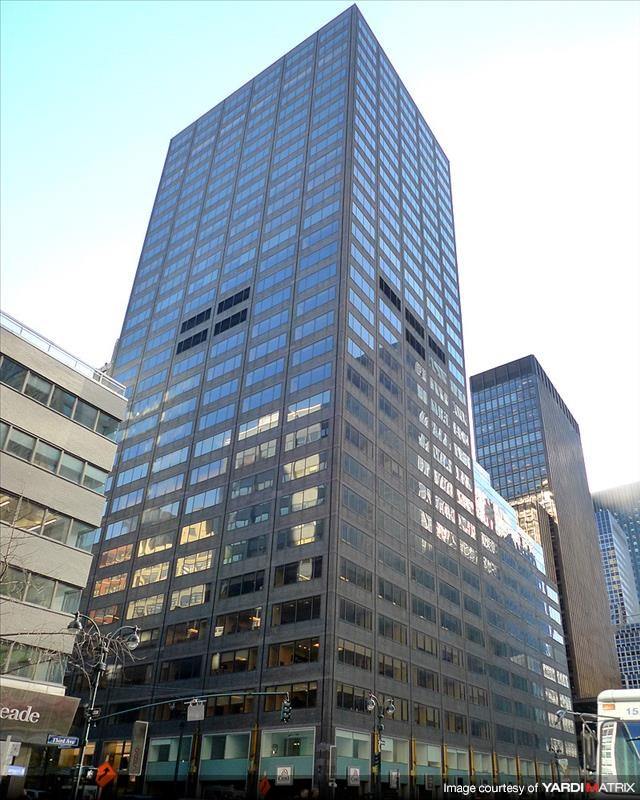
685 Third Avenue, Manhattan
There were only two office deals closed by Asian buyers in the year’s fourth quarter, and neither one of those buyers was from China: Japan-based Unizo Holdings acquired the Turtle Bay office property at 685 3rd Avenue for $468 million, while Bahrain-based Investcorp opted for Garment District office space and paid $157 million for the building at 229 W. 36th Street.
Manhattan Office Construction Pipeline Dries Up in 2017
As delivery dates for new office projects kept being pushed back from one quarter to the next (as was the case with One Soho Square and the Verizon Building), the fourth quarter of 2017 turned out to be a stale one. No new office developments were finalized on the Manhattan market during Q4; in fact, according to our data, the 230,000-square-foot Bridge at Cornell Tech was the only new office delivery exceeding 50,000 square feet to come online in 2017. The six-story, Class A office condo project is located at 11 E. Loop Road and includes 230,000 square feet of Roosevelt Island office space. The asset is fully leased to Cornell University, managed by Forest City Realty Trust, and is subject to a 65-year unsubordinated net ground lease held by The City of New York. The university in turn provided a 65-year sublease to Forest City Realty Trust, according to Yardi Matrix.
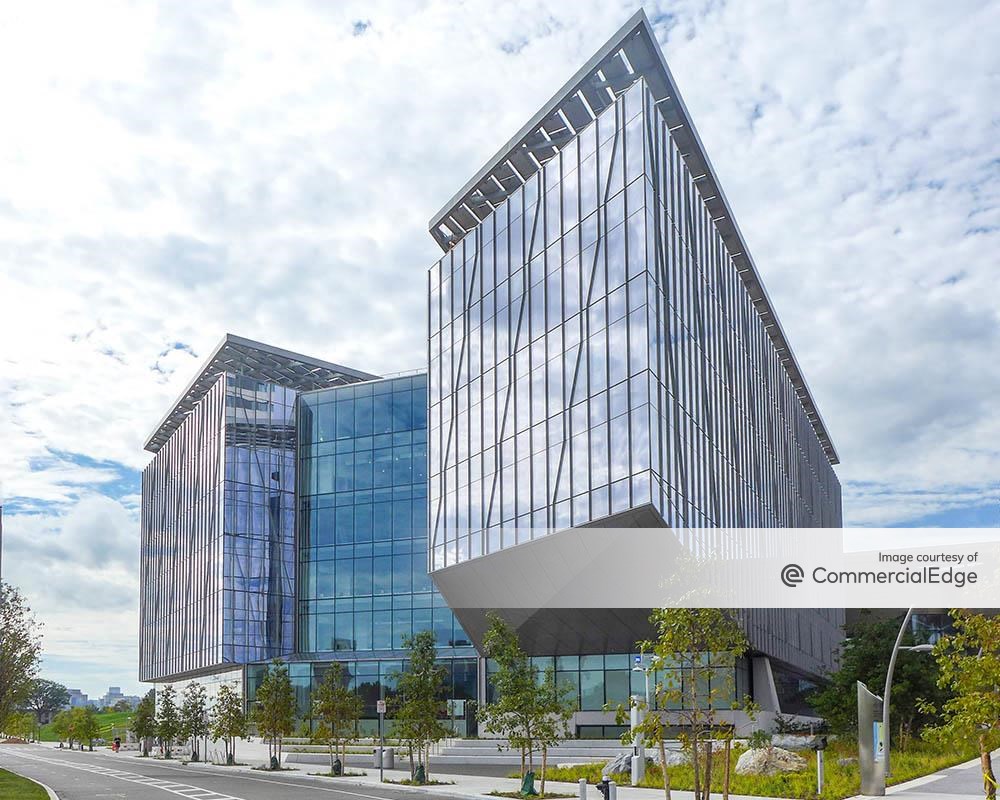
Bridge at Cornell Tech, located at 11 East Loop Road on Roosevelt Island, New York, NY
Methodology
We used detailed Yardi Matrix data to analyze all office transactions with price tags equal to or exceeding $5 million to close in Manhattan during the fourth quarter of 2017 (October through December). Our analysis, based on data recorded up until January 1st, 2018, includes completed office buildings equal to or larger than 50,000 square feet that changed owners during the quarter. In the case of mixed-use assets, only properties featuring over 50% office space were taken into account. We counted portfolio deals as single transactions and excluded distressed sales altogether.
To make sure the trends and comparisons presented in our analysis are valid, we excluded portfolio, partial interest, and ground lease deals from our calculation of the average price per square foot.
Want to see what other top office markets have to offer? Select any location from those linked below to check out the local listings!
By Ioana Neamt


Contributor
Our contributor content includes articles written by guest authors who are professionals in a variety of relevant fields and have contributed their expertise and detailed understanding of a range of topics, including: PropTech; real estate marketing tools and strategies, commercial real estate trends evolution; work-life balance management guidance and resources; workspace management and design; and more.