When discussing trophy office buildings trading on the U.S. commercial real estate market, what usually gets mentioned is the price tag. You’ll find there is no shortage of rankings and top deal lists based on sale prices–we, for instance, have compiled a list of the top 50 office deals to close in the U.S. in 2016. Yet those who work in this sector are far more interested in the long-term opportunity. Often times, buyers fork over huge amounts of money on commercial property because they believe that particular asset will provide long-term gains and is a solid value-add investment. After a while, depending on market fluctuations, they decide if they want to continue to hold it or sell it at a higher price.
We know it’s a tricky subject–there are many variables involved in the trading of commercial real estate, and the office sector is an especially challenging one. Deciding to sell a property after holding it for a few years depends on, and is impacted by, many factors: timing, the state of the market, fluctuations on the stock market, oil prices, building occupancy, tenants and lease terms, renovations and expenses, to name just a few. It’s not an easy task trying to calculate the actual, real profit made from the sale of an office building.
Keeping that in mind, we came up with a list of the 15 highest resale gains for U.S. office buildings. In compiling the list, using in-depth Yardi Matrix office data, we excluded portfolio and minority stake deals, and we also left out buildings that were completely renovated between sale dates. We did take into account office buildings that underwent minor or cosmetic renovation work, after researching the renovation costs in the press (see ‘Methodology’).
Check out the full list below and keep reading to find out more details on the top three sales:
Russell Investments Center, Seattle – $325M resale gain (2012)
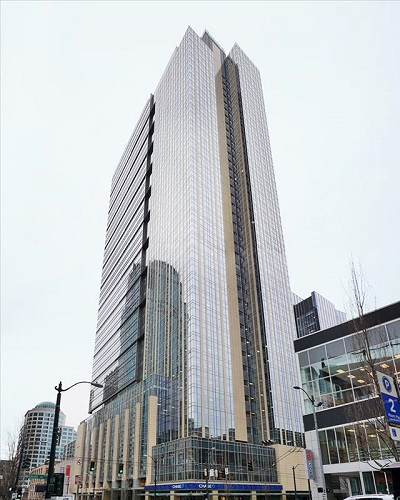
Russell Investments Center, Seattle (Yardi Matrix)
The Emerald City landed the top spot on our list of 15 most ‘profitable’ office deals, with the $480 million sale of the Russell Investments Center at 1301 2nd Ave. in the Seattle CBD. Northwestern Mutual Real Estate Investors gained $325 million from the sale of the 42-story, 886,000-square-foot office tower to Commonwealth Partners in 2012. Northwestern had acquired the asset from JP Morgan Asset Management in 2009, for a price tag of $115 million. The LEED Platinum-certified tower was completed in 2006, includes 3,500 square feet of retail and is home to Chase Bank, CoStar Group, JPMorgan Chase, Zillow Group and Nordstrom, among others.
1 Kendall Square, Cambridge, Mass. – $306M resale gain (2016)
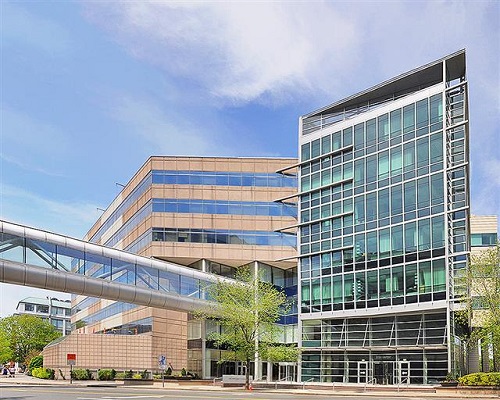
One Kendall Square, Cambridge, Mass. (Yardi Matrix)
The 669,689-square-foot One Kendall Square campus in Cambridge, Mass., has changed hands multiple times since 2001, and its value has gone up with each sale. Lincoln Property Co. paid $192 million for the property back in 2001. DivcoWest got a hold of the property in 2014, when it paid $395 million to acquire it from Rockwood Capital. By comparison, Alexandria Real Estate Equities shelled out $725 million to acquire it from DivcoWest in the fall of 2016. The $306 million gain made by DivcoWest thus lands the five-building office and lab complex the second spot on our list.
550 Madison Ave., Manhattan – $300M resale gain (2016)
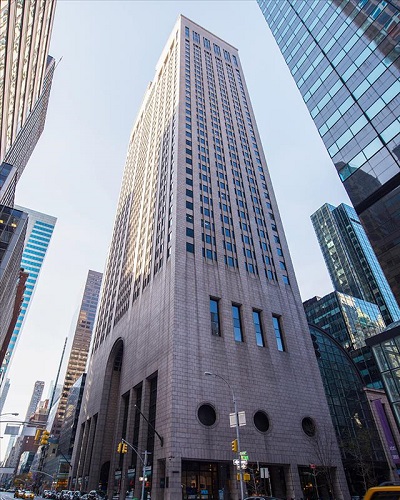
550 Madison Ave., Manhattan (Yardi Matrix)
The former home of Sony Corporation of America, located at 550 Madison Ave. in Manhattan’s Plaza District, has also gone through various ownership changes during the years.
The 827,686-square-foot tower was acquired by Sony Corporation of America in 2001, for a price tag of $236 million, or $284.53 per square foot. Twelve years later, Sony sold the 37-story high-rise to The Chetrit Group for $1.1 billion, or $1,329 per square foot–quite the profitable deal, as Sony recorded an $804 million gain from the sale.
The Chetrit Group didn’t stay on as owner for very long. In 2016, the New York City development firm sold the building to Saudi conglomerate Olayan Group, for a price tag of $1.4 billion–a $300 million gain for Chetrit. This latest trade of 550 Madison Ave. lands the third spot on our list of highest office resale gains.
Maximizing Profit–Is Timing Everything?
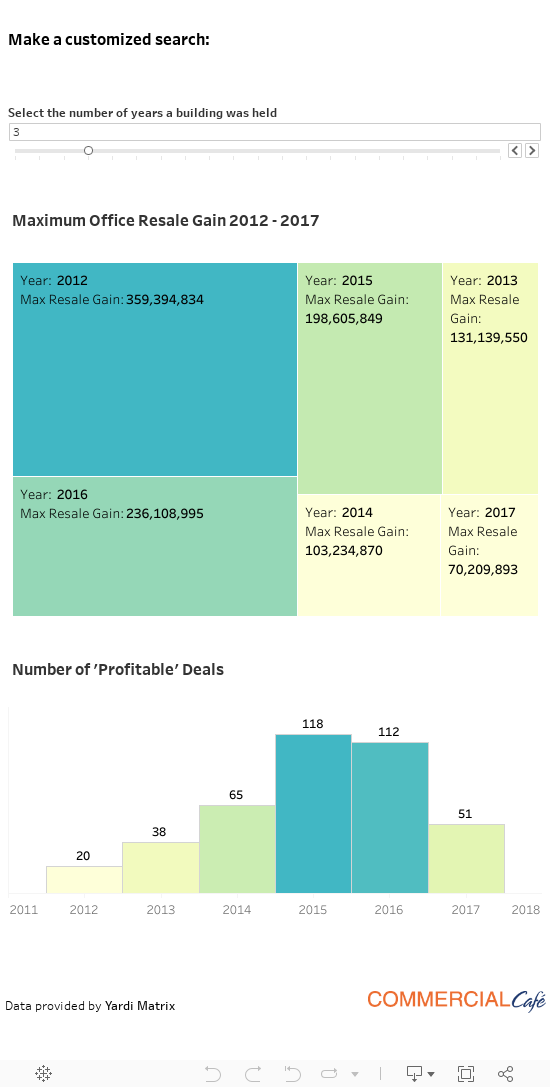
It’s clear that the resale potential or value of an office asset depends on a variety of factors, and it takes a trained eye to ‘feel’ the market and time such a sale to maximize gain. Relying on the same methodology that we used to compile the list of top 15 resale gains, we devised a tool that lets you see the maximum potential resale gain that could have resulted from these sales, depending on the number of years the property is held. For example, some buildings on our list were held for two years before they were sold again. With this tool, you can customize your search and see what the maximum resale gain would’ve been, had the asset been held for a different number of years. Both graphs below will show personalized results, based on the number of years you select. Check it out:
Methodology
– Data source: Yardi Matrix;
– Property type: office;
– Only single-asset deals were taken into consideration;
– We excluded: completely renovated buildings, portfolio sales, unrecorded deals, and minority stake transactions.
– Resale year: 2012-2017 range;
– We took into consideration solely the buildings that were held for up to 3 years;
– **Some properties underwent cosmetic renovation work between the two sale dates – renovation costs were taken from the following sources:
- Russell Investments Center** – http://www.seattletimes.com/business/russell-center-sold-for-480m/;
- One Kendall Square** – https://realestate.ipe.com/news/investors/divcowest-properties-to-offload-one-kendall-square/10014294.fullarticle;
- 530 Fifth Avenue** – http://nypost.com/2014/06/19/general-growth-rxr-in-595m-deal-for-530-fifth-ave/;
- 575 Lexington Avenue** – job filings on http://a810-bisweb.nyc.gov;
- One South Wacker** – http://www.us.jll.com/united-states/en-us/case-studies/88/one-south-wacker-the-return-of-prominence-to-a-storied-landmark;
- 123 William Street** – job filings on http://a810-bisweb.nyc.gov;
- 21 Penn Plaza** – job filings on http://a810-bisweb.nyc.gov;
- 200 South Wacker Drive** – http://www.chicagobusiness.com/realestate/20120622/cred03/120629930/zell-venture-to-revamp-200-s-wacker-add-roof-deck;
– *Where the previous purchase was a partial stake deal, only the majority stakeholder is shown. For the same cases, the ‘Resale Gain’ column value also factors in the majority stake percentage.
By Ioana Neamt


Contributor
Our contributor content includes articles written by guest authors who are professionals in a variety of relevant fields and have contributed their expertise and detailed understanding of a range of topics, including: PropTech; real estate marketing tools and strategies, commercial real estate trends evolution; work-life balance management guidance and resources; workspace management and design; and more.