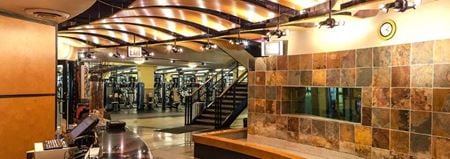
Central Chicago, Chicago, IL Office Spaces for Rent
Find the best Central Chicago, Chicago, IL office space among 2,032 for rent listings currently on the market.
-
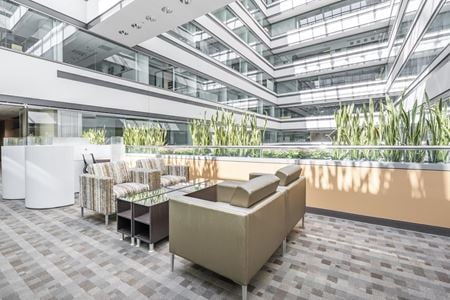 203 North LaSalle Street Suite 2100, Chicago, ILServices
- Virtual Office
- Open Workspace
- Private Office
- Dedicated Desk
Amenities -
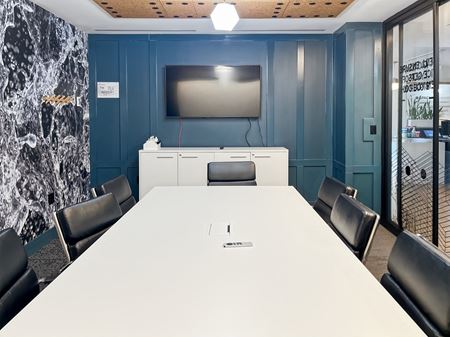 332 South Michigan Avenue #900, Chicago, ILServices
- Virtual Office
- Open Workspace
- Private Office
- Dedicated Desk
Amenities -
 1 North State Street, Chicago, ILServices
- Virtual Office
- Open Workspace
- Private Office
- Dedicated Desk
Amenities -
 230 West Superior Street STE 300, Chicago, ILServices
- Meeting Room
- Private Office
Amenities -
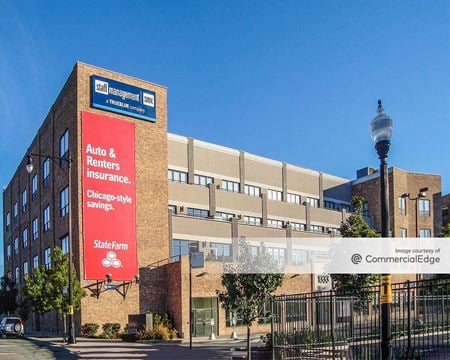 1333 North Kingsbury Street, Goose Island, Chicago, ILProperty
- Office
- 100,000 SF
Availability- 1 Space
- 25,045 SF
Year Built- 1961
For Lease Contact for pricing -
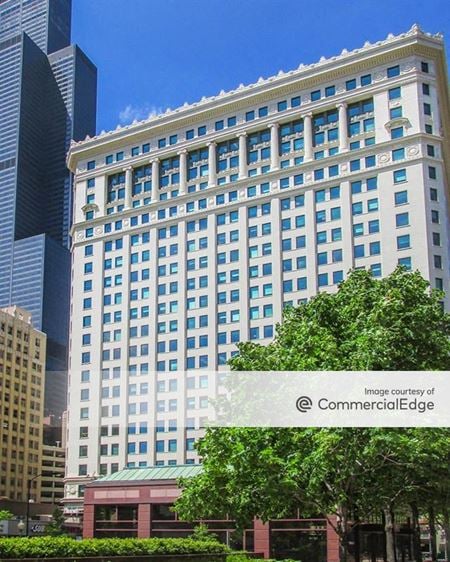 175 West Jackson Blvd, Chicago Loop, Chicago, ILProperty
- Office
- 1,452,390 SF
Availability- 2 Spaces
- 22,155 SF
Year Built- 1911
For Lease Contact for pricing -
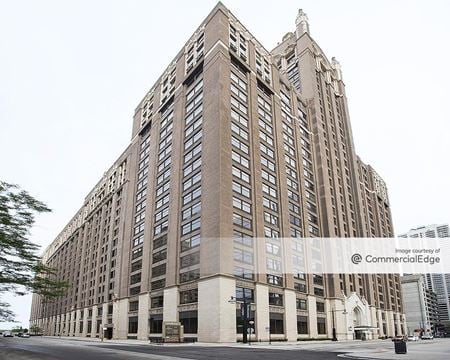 680 North Lake Shore Drive, Streeterville, Chicago, ILProperty
- Office
- 600,000 SF
Availability- 26 Spaces
- 107,923 SF
Year Built- 1923
For Lease Contact for pricing -
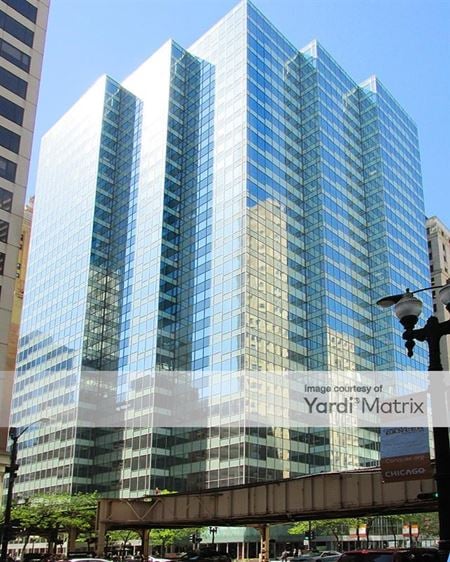 200 North LaSalle Street, Chicago Loop, Chicago, ILProperty
- Office
- 643,323 SF
Availability- 4 Spaces
- 77,509 SF
Year Built- 1985
For Lease Contact for pricing -
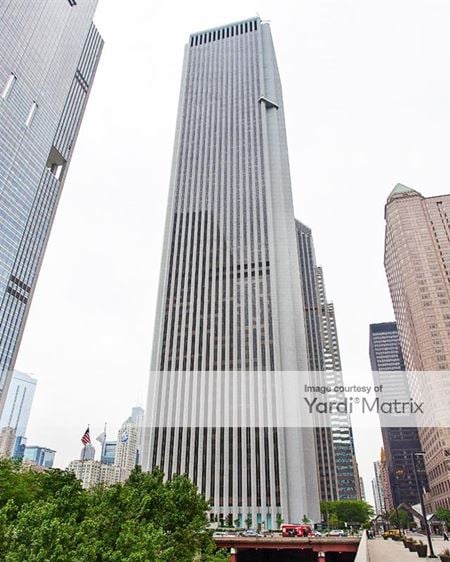 200 East Randolph Street, Chicago Loop, Chicago, ILProperty
- Office
- 2,687,933 SF
Availability- 2 Spaces
- 5,607 SF
Year Built- 1972
For Lease Contact for pricing -
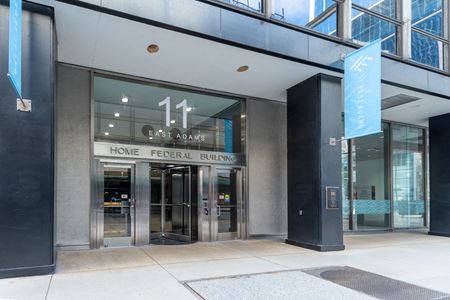 11 East Adams Street, Chicago Loop, Chicago, ILProperty
- Office
- 160,793 SF
Availability- 27 Spaces
- 85,960 SF
Year Built- 1960
For Lease- $19.75 - $28.00/SF/YR
-
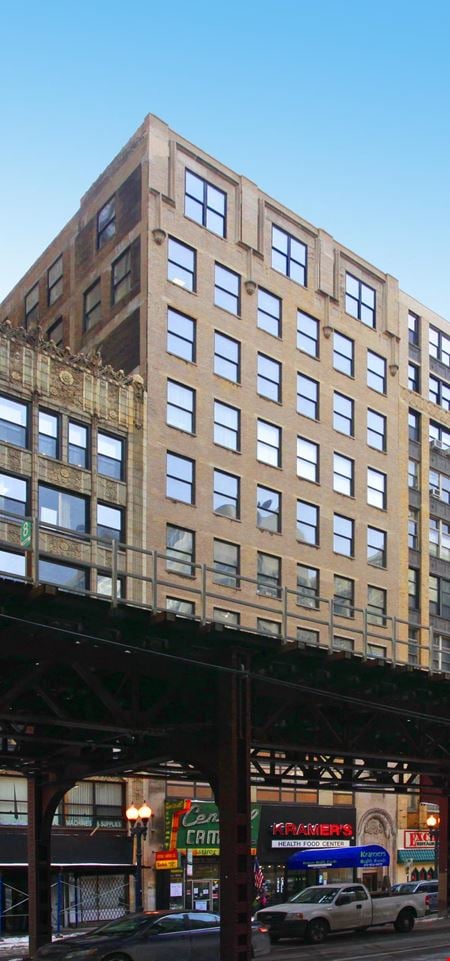 228 S Wabash, Chicago Loop, Chicago, ILProperty
- Office
- 84,000 SF
Availability- 6 Spaces
- 15,795 SF
Year Built- 1930
For Lease- $19.00 - $240.00/SF/YR
-
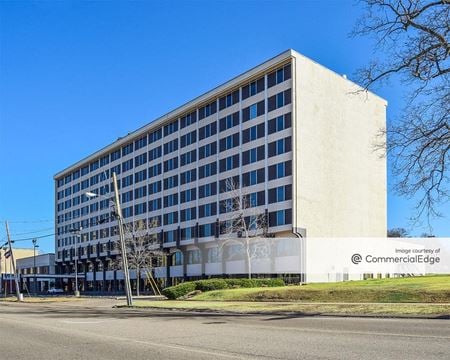 750 North State Street 6th & 7th Floor, Chicago, IL
750 North State Street
Life Time WorkServices- Meeting Room
- Private Office
- Dedicated Desk
Amenities -
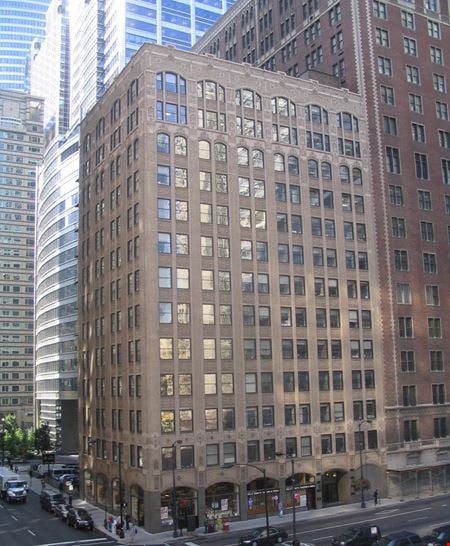 309 West Washington, Chicago Loop, Chicago, ILProperty
- Office
- 93,610 SF
Availability- 7 Spaces
- 22,976 SF
Year Built- 1928
For Lease- $26.00 - $27.00/SF/YR
-
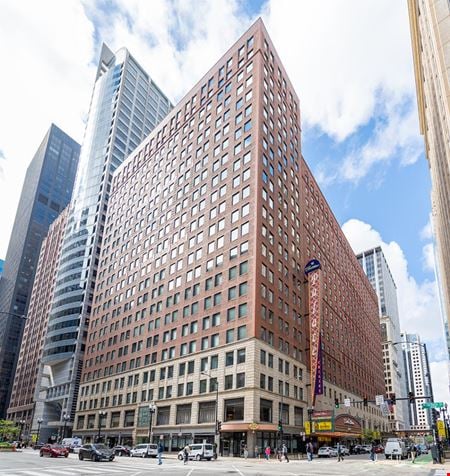 134 North LaSalle Street, Chicago Loop, Chicago, ILProperty
- Office
- 201,767 SF
Availability- 31 Spaces
- 74,204 SF
Year Built- 1926
For Lease- $23.00 - $50.00/SF/YR
-
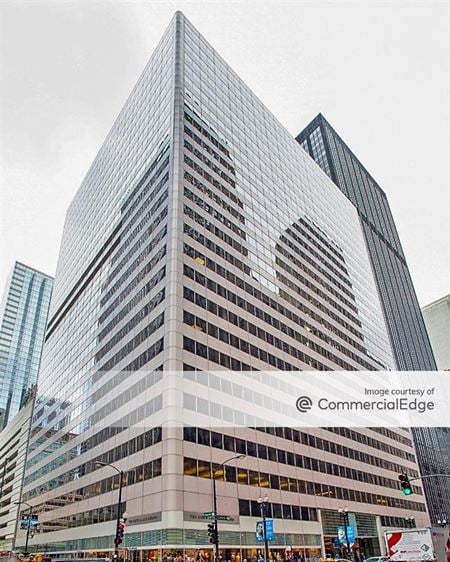 2 North LaSalle Street, Chicago Loop, Chicago, ILProperty
- Office
- 713,030 SF
Availability- 2 Spaces
- 9,700 SF
Year Built- 1979
For Lease Contact for pricing -
29 East Madison Street, Chicago Loop, Chicago, ILProperty
- Office
- 236,151 SF
Availability- 33 Spaces
- 49,158 SF
Year Built- 1906
For Lease- $23.00 - $27.00/SF/YR
-
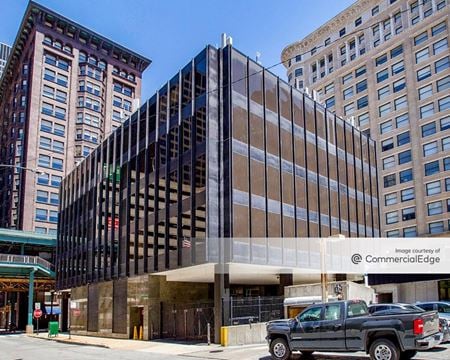 55 West Van Buren Street, Chicago Loop, Chicago, ILProperty
- Office
- 44,170 SF
Availability- 1 Space
- 1,285 SF
Year Built- 1970
For Lease Contact for pricing -
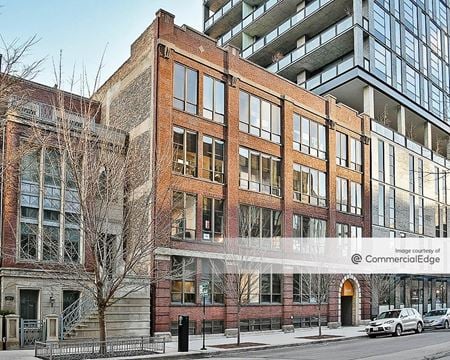 420 West Huron Street, River North, Chicago, ILProperty
- Office
- 34,000 SF
Availability- 10 Spaces
- 11,791 SF
Year Built- 1918
For Lease- $35.00 - $186.00/SF/YR
-
 448 North La Salle Drive, Chicago, IL
448 North La Salle
WeWorkServices- Virtual Office
- Event Space
- Meeting Room
- Private Office
- Dedicated Desk
Amenities -
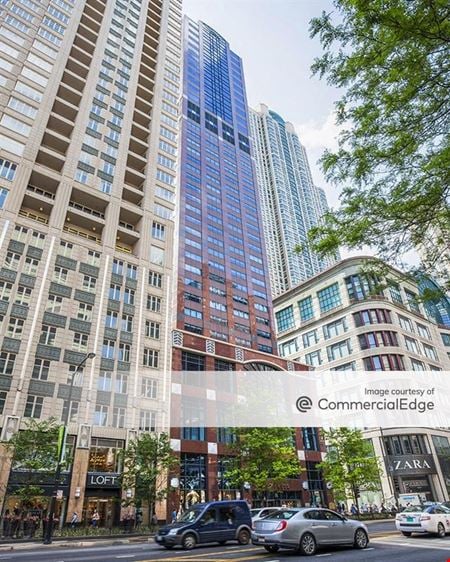 676 North Michigan Avenue, Near North Side Chicago, Chicago, ILProperty
- Office
- 470,000 SF
Availability- 5 Spaces
- 18,346 SF
Year Built- 1990
For Lease Contact for pricing -
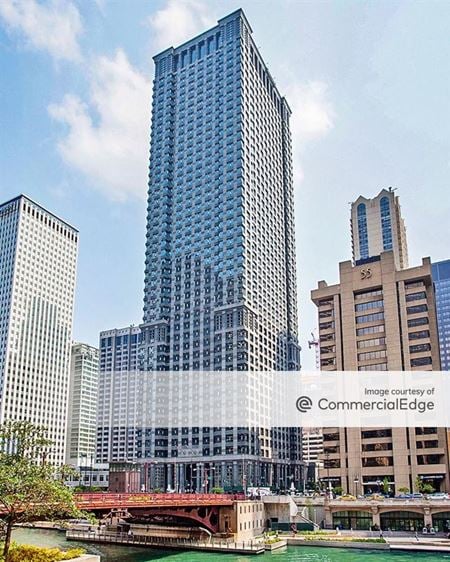 35 West Wacker Drive, Chicago Loop, Chicago, ILProperty
- Office
- 1,118,042 SF
Availability- 32 Spaces
- 783,460 SF
Year Built- 1989
For Lease Contact for pricing -
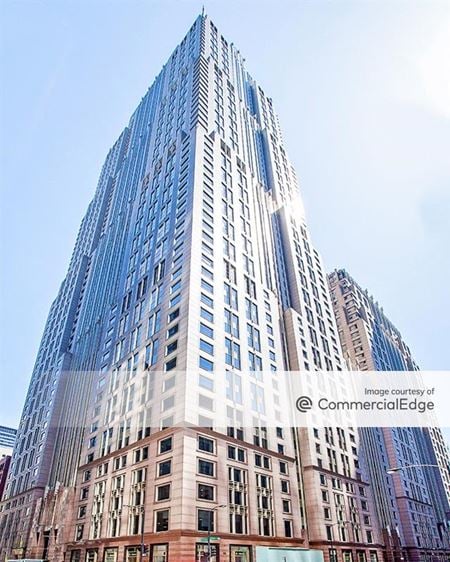 227 West Monroe Street, Chicago Loop, Chicago, ILProperty
- Office
- 1,583,900 SF
Availability- 15 Spaces
- 220,877 SF
Year Built- 1989
For Lease Contact for pricing -
 111 W. Jackson Suite 1700, Chicago, ILServices
- Virtual Office
- Open Workspace
- Private Office
- Dedicated Desk
Amenities -
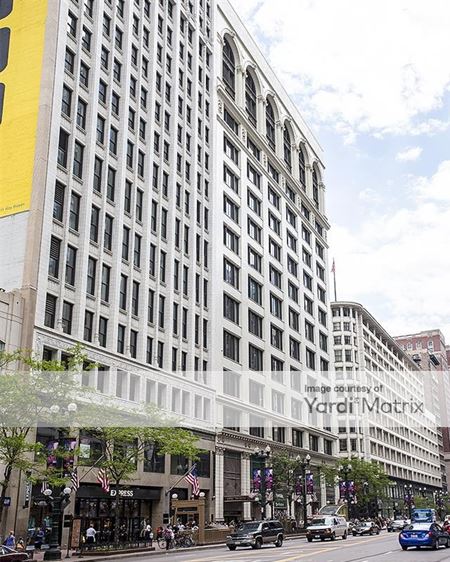 1 North State Street, Chicago Loop, Chicago, ILProperty
- Office
- 533,000 SF
Availability- 1 Space
- 25,147 SF
Year Built- 1912
For Lease- $18.00/SF/YR
-
-
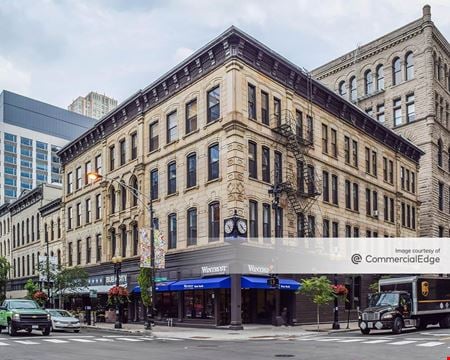 441 North Clark Street, Near North Side Chicago, Chicago, ILProperty
- Office
- 52,580 SF
Availability- 1 Space
- 2,438 SF
Year Built- 1871
For Lease Contact for pricing -
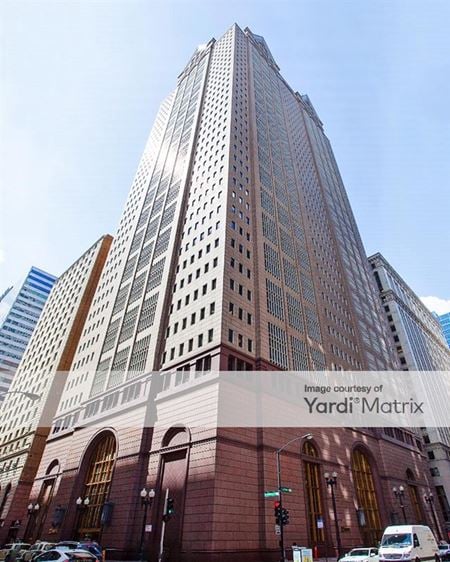 190 South LaSalle Street, Chicago Loop, Chicago, ILProperty
- Office
- 798,782 SF
Availability- 2 Spaces
- 11,277 SF
Year Built- 1986
For Lease Contact for pricing -
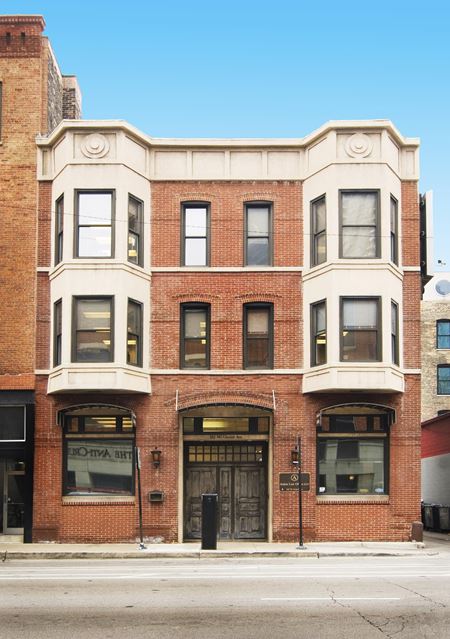 162 W Grand, River North, Chicago, ILProperty
- Office
- 8,218 SF
Availability- 1 Space
- 2,046 SF
Year Built- 1881
For Lease- $24.00/SF/YR
-
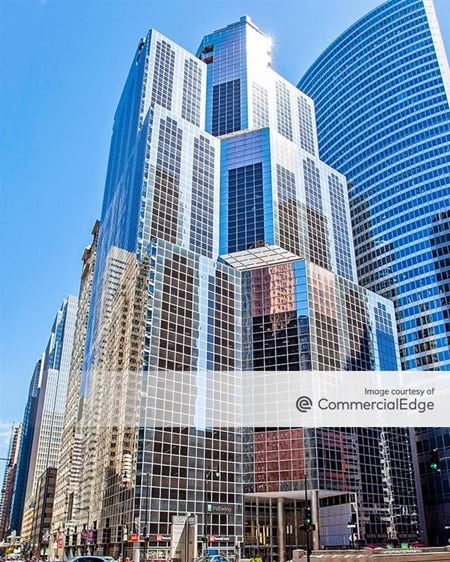 1 South Wacker Drive, Chicago Loop, Chicago, ILProperty
- Office
- 1,195,170 SF
Availability- 1 Space
- 16,275 SF
Year Built- 1984
For Lease Contact for pricing -
1030 N Clark St, Near North Side Chicago, Chicago, ILProperty
- Office
- 111,375 SF
Availability- 4 Spaces
- 17,900 SF
For Lease- $28.50/SF/YR
-
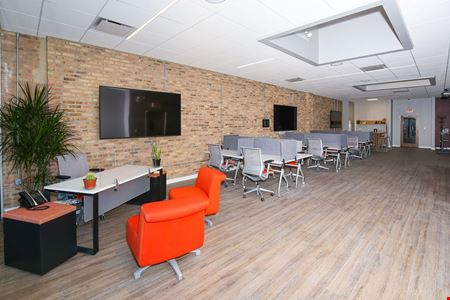
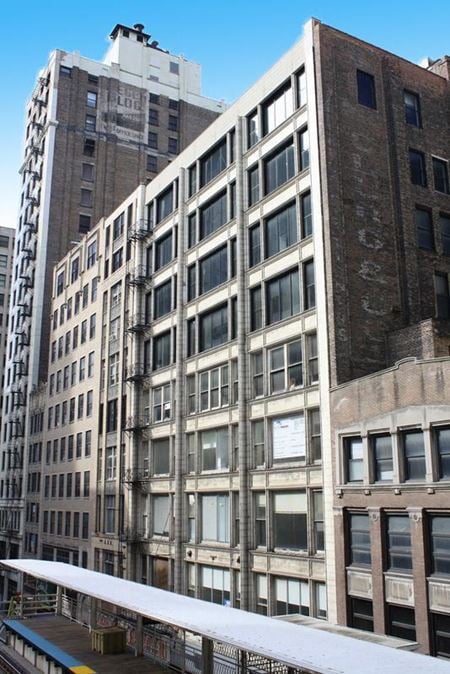 226 S Wabash, Chicago Loop, Chicago, ILProperty
- Office
- 36,000 SF
Availability- 3 Spaces
- 9,354 SF
Year Built- 1932
For Lease- $18.00/SF/YR
-
-
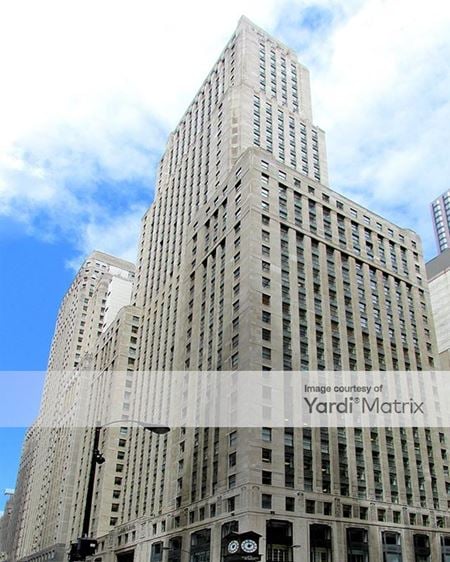 1 North LaSalle Street, Chicago Loop, Chicago, ILProperty
- Office
- 493,738 SF
Availability- 1 Space
- 4,179 SF
Year Built- 1930
For Lease Contact for pricing -
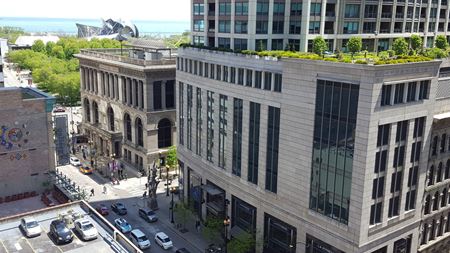 55 E Randolph, Downtown Chicago, Chicago, ILProperty
- Office
- 1,881,000 SF
Availability- 1 Space
- 16,299 SF
Year Built- 2005
For Lease- $23.00/SF/YR
-
 101 North Wacker Drive, Chicago Loop, Chicago, ILProperty
- Office
- 599,503 SF
Availability- 6 Spaces
- 128,269 SF
Year Built- 1980
For Lease- $19.00/SF/YR
-
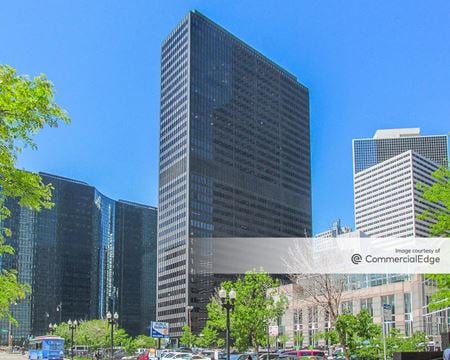 300 South Wacker Drive, Chicago Loop, Chicago, ILProperty
- Office
- 535,726 SF
Availability- 34 Spaces
- 251,949 SF
Year Built- 1971
For Lease Contact for pricing -
 330 N. Wabash 23rd Floor, Chicago, IL
330 North Wabash
WeWorkServices- Virtual Office
- Event Space
- Meeting Room
- Private Office
- Dedicated Desk
Amenities -
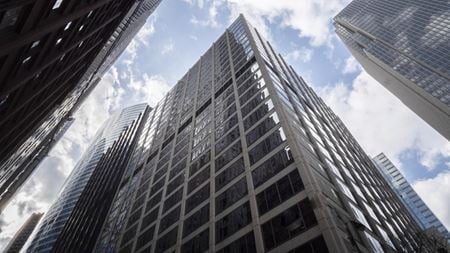 200 W. Monroe Street, Chicago Loop, Chicago, IL
 -
 420 North Wabash Avenue, #500, Chicago, IL
Workbox - Magnificent Mile
WorkboxServices- Meeting Room
Amenities -
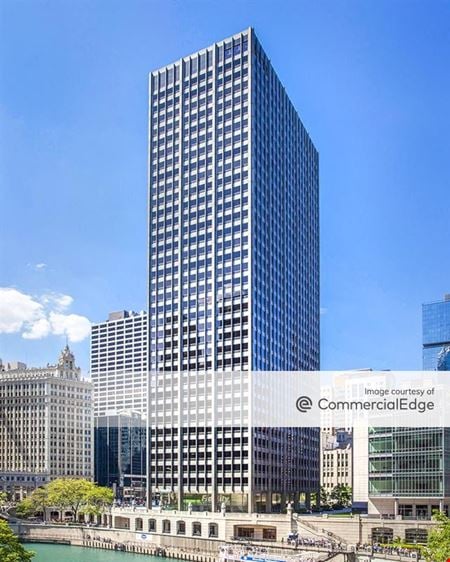 401 North Michigan Avenue, Streeterville, Chicago, ILProperty
- Office
- 737,308 SF
Availability- 19 Spaces
- 147,248 SF
Year Built- 1966
For Lease Contact for pricing -
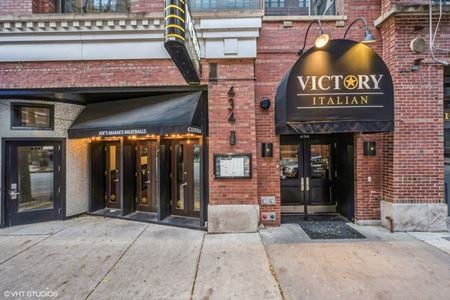 434 W Ontario St, River North, Chicago, ILProperty
- Office
- 24,810 SF
Availability- 1 Space
- 6,582 SF
Year Built- 1912
For Lease- $19.50/SF/YR
-
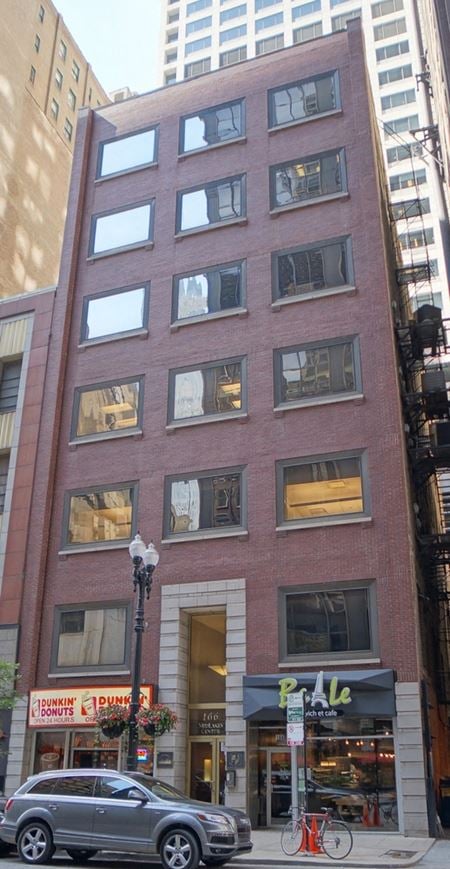 166 W Washington, Chicago Loop, Chicago, ILProperty
- Office
- 33,446 SF
Availability- 4 Spaces
- 5,564 SF
Year Built- 1890
For Lease- $500.00 - $2,800.00/MO
-
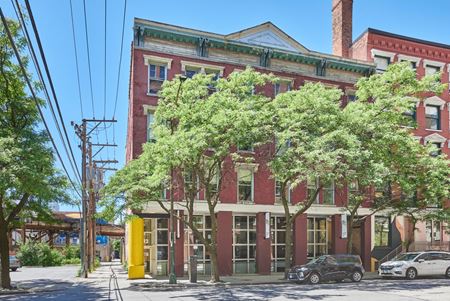 812-14 N. Franklin Street, Near North Side Chicago, Chicago, ILProperty
- Office
- 22,000 SF
Availability- 3 Spaces
- 13,500 SF
Year Built- 1905
For Lease- $21.00/SF/YR
-
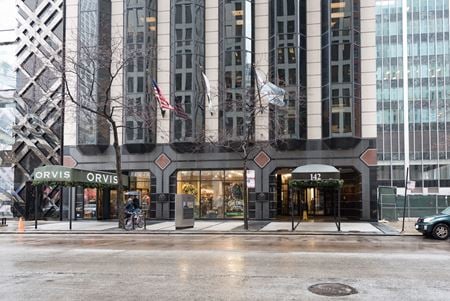 142 East Ontario Street , Streeterville, Chicago, ILProperty
- Office
- 135,620 SF
Availability- 10 Spaces
- 44,479 SF
Year Built- 1986
For Lease Contact for pricing -
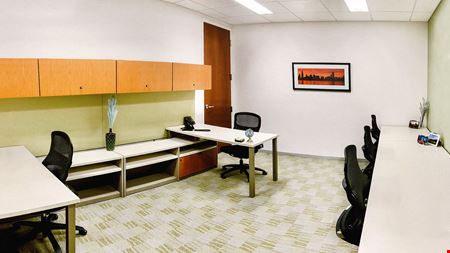 200 East Randolph Street, Suite 5100, Chicago, IL
Carr Workplaces - AON Center Chicago
Carr WorkplacesServices- Meeting Room
- Private Office
Amenities -
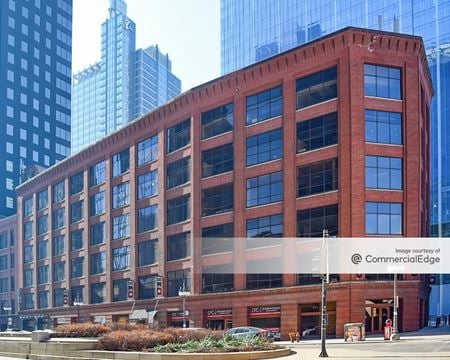 180 North Wacker Drive, Chicago Loop, Chicago, ILProperty
- Office
- 71,478 SF
Availability- 5 Spaces
- 32,370 SF
Year Built- 1890
For Lease Contact for pricing -
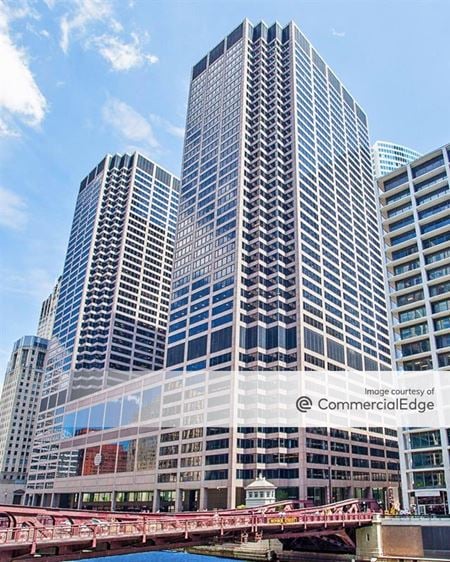 30 South Wacker Drive, Chicago Loop, Chicago, ILProperty
- Office
- 2,351,265 SF
Availability- 16 Spaces
- 271,013 SF
Year Built- 1983
For Lease Contact for pricing -
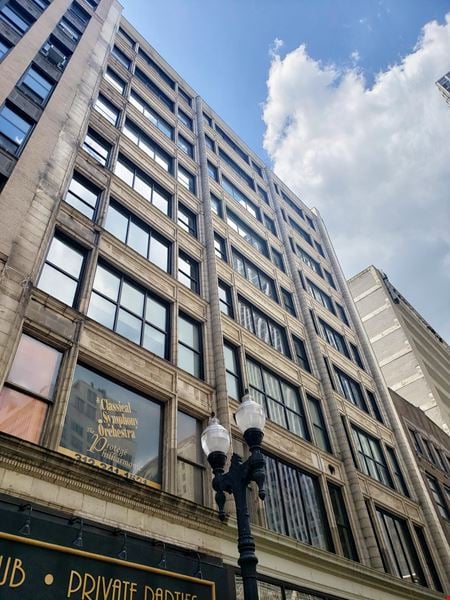 218 S Wabash, Chicago Loop, Chicago, ILProperty
- Office
- 112,156 SF
Availability- 3 Spaces
- 12,419 SF
Year Built- 1899
For Lease- $22.00 - $264.00/SF/YR
-
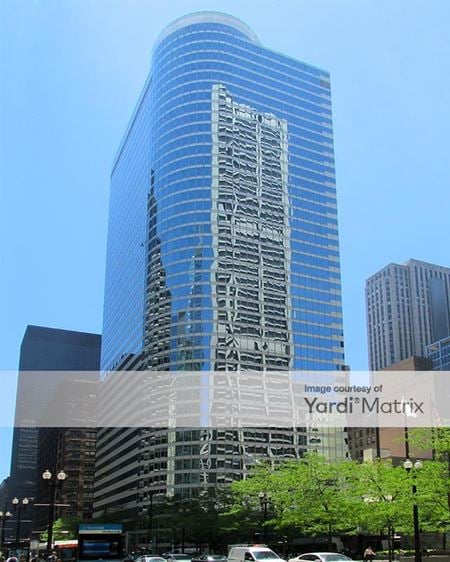 55 West Monroe Street, Chicago Loop, Chicago, ILProperty
- Office
- 803,141 SF
Availability- 1 Space
- 36,102 SF
Year Built- 1981
For Lease Contact for pricing -
 71 South Wacker Drive, Chicago Loop, Chicago, ILProperty
- Office
- 1,490,825 SF
Availability- 8 Spaces
- 111,691 SF
Year Built- 2005
For Lease Contact for pricing -
.jpg?width=450) 605 N Michigan Ave 4th floor, Chicago, IL
605 N Michigan Ave 4th floor, Chicago, ILExpansive Magnificent Mile
ExpansiveServices- Private Office
- Dedicated Desk
Amenities -
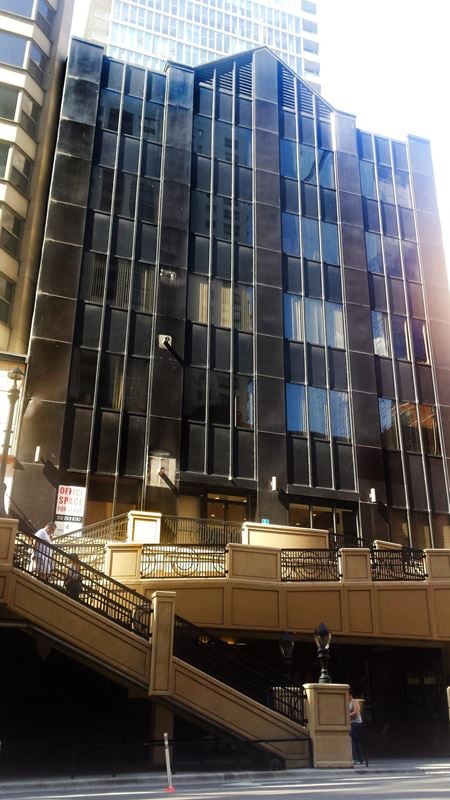 160 E Grand, Streeterville, Chicago, ILProperty
- Office
- 32,516 SF
Availability- 1 Space
- 225 SF
Year Built- 1890
For Lease- $48.00/SF/YR


.png)

