Best Places for Millennials to Live in 2022 – Top 10 U.S. Metro Areas


Nearly 72 million people living and working in the U.S. today are part of what’s commonly referred to as the Millennial generation, which currently represents the most significant cohort of the country’s demographics. And, given their outsized role within the nation’s economy and influence on everything from culture to the social and political spheres, CommercialCafe has made a concerted effort to track their movements and preferences throughout the years.
For instance, prior to the onset of the COVID-19 pandemic, we conducted a study to determine the top 10 most attractive metropolitan statistical areas (MSAs) for Millennials across the U.S. Now, two years later, there have been some major shake-ups in the ranking — from the meteoric rise of San Jose, Calif., to significant drops for Raleigh, N.C., and Denver — along with new entries making their way onto the list.
In revisiting our previous assessment, we followed each entry’s performance across these seven indicators:
- Millennial population growth between 2016 and 2020
- Proportion of Millennials in the overall population in 2020
- Regional price parity
- Median Millennial household earnings
- Unemployment rate
- Percentage of Millennials with employer-based health insurance
- Percentage of Millennials in the labor force, with a bachelor’s degree
NOTE: Due to the rise of flexible working schedules and changes in commuting patterns for employees, the metric indicating average commute time estimates used in the previous iteration of this analysis has been replaced by median earnings for Millennial households.
For more information about our analysis, check out the methodology section. The map below highlights the best places for Millennials to live, according to this study.
West Coast Metro Areas Hungry for Talent — & Ready to Pay For it
While the locations that made this list are among the best places for Millennials to live, their performances vary significantly across most metrics. That said, here’s a quick overview of the leading metros for individual indicators.
One of the first findings that stood out in our study was that the top position for each individual indicator was no longer evenly distributed, with the San Jose, Calif., metro occupying three of the leading spots. In fact, the California MSA witnessed the most spectacular shift in the ranking, going from 10th place right up to the head of the list by earning a total of 77.8 out of 100 points. Most notably, San Jose boasted the highest median earnings for Millennial households. It was followed by another West Coast MSA (San Francisco), as well as Boston and Seattle.

However, the largest change in the overall demographics of Millennials was recorded in the Seattle metro, where the number of residents within that age group jumped by 13.7%. In raw numbers, that meant that an additional 80,000 Millennials chose to make this Washington metro area their home between 2016 and 2020 — bringing the total for that age group to roughly 668,000.
Notably, these numbers were also in line with the demographic evolution observed during our previous study, which looked at data for the period between 2014 and 2018. At that time, Seattle also ranked first, with a similar percentage.
Meanwhile, according to the latest data from the U.S. Census Bureau, 17.4% of residents in the Austin metro residents were part of the Millennial cohort, which landed the Texas MSA in the top spot for its share of Millennials within its total population. And, even with all but two of its seven metrics below the ranking average, Austin still managed to maintain its runner-up position in the top 10.
Next, the San Francisco metro — a newcomer to the list — landed in fifth place, gaining notable points for its second-highest median Millennial household earnings. Educational attainment and healthcare coverage levels for Millennials were also within the top three for this California metro area.
In terms of unemployment rates, Salt Lake City metro outranked all other entries in the list. and performed above average across three other indicators — including health insurance coverage and regional price parity.
Finally, despite previously ranking first among the best places for Millennials to live in 2022, the Denver metro had to settle for sixth place this time round. This MSA’s top performances across its demographic metrics — second place for the largest growth in its Millennial population and third place for the highest percentage of Millennials within the total population — were insufficient to garner it enough points to break into the top three.

The median earning for Millennial households is roughly $150,806 per year across San Jose MSA. As such, they can expect to earn an extra $17,000 when compared to those in San Francisco metro, as well as $44,145 more than those in Boston metro.
Home to Stanford University; the founding campus of California State University (CSU); and California University of Management and Technology (CALMAT), the metro area unsurprisingly received top scores for its educational attainment levels. As a matter of fact, with approximately 61% of its Millennials boasting a bachelor’s degree or higher, only Boston and San Francisco’s MSAs came even close to matching it.
Moreover, according to Bureau of Labor Statistics (BLS) numbers for March 2022, unemployment in the San Jose metro area stood at 2.5%. Although that was only the third-lowest rate among the 10 entries, it nevertheless proved useful in offsetting some of the region’s more modest performances across other indicators, such as regional price parity (ninth place) and its Millennial demographics.
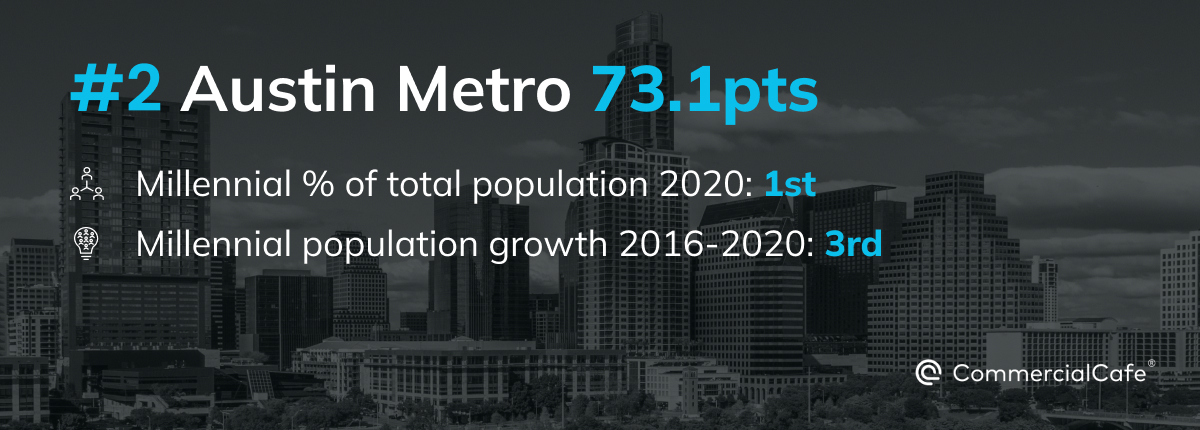
Austin had the most Millennial-heavy demographic among the entries on this list, with Millennials making up roughly 17.4% of the MSA’s 2.3-million population.
Specifically, between 2016 and 2020, the Millennial population in the Austin metro area increased by 12.8% — the third-largest such increase within the ranking. Going by the numbers, that meant an additional 43,000 new residents within that age group chose to live and work in this Texas metro area. Plus, according to a previous CommercialCafe study, the Austin metro area has been especially successful in attracting new residents from in-state rivals Houston, Dallas Fort-Worth and San Antonio.
Furthermore, despite significant rent increases throughout the last couple of years and median Millennial household incomes below the $100,000 threshold, the region’s cost of living remains competitive when compared to other large MSAs: Austin finished in fifth place, outranking Denver, Boston, Seattle, San Jose and San Francisco.
Here, a robust STEM sector — which also boasts one of the highest female participation rates and incomes in this field within the Southern U.S. — has further contributed to making Austin one of the nation’s top spots for people looking to relocate.

As mentioned, Seattle performed exceptionally well in terms of its increasing number of Millennials, landing in first place for this indicator. But, it’s also important to note that the region also had the second-highest share of Millennials within the overall population in our ranking at 17%.
With median Millennial household incomes around $101,000, the Seattle metro landed in fourth place for this metric. It also received additional points for ranking fourth for its share of health insurance coverage among people between the ages of 25 and 34 (72.5%, just below San Francisco).
Clearly, the Seattle metro area has a lot going for it, such as its willingness to invest in parks and green spaces; its dedication to creating an exciting environment for innovation and startups; and more. But, for those considering a move to Seattle, the cost of living might be a complicating factor. That’s because the MSA had the third-worst regional price parity in our ranking, outpriced by only the two Bay Area entries (San Jose and San Francisco).

Salt Lake metro settled in fourth place, pulling ahead of San Francisco after it outranked the California MSA on several metrics. For instance, the Utah metro boasts a larger share of Millennials with employer-based health insurance amid its residents than San Francisco — 73.8%, enough to earn it second place.
Salt Lake also performed better than the northern California metro area for its share of Millennial residents within the overall population. According to most recent estimates, some 16.4% of people living in Salt Lake City metro were Millennials (fourth place).
Most notably, the Utah metro earned the top spot for the lowest unemployment among the ten entries. Its 2.1% rate — recorded as of March 2022 — is mirrored at the other end by Denver and Columbus’ 3.3% unemployment.
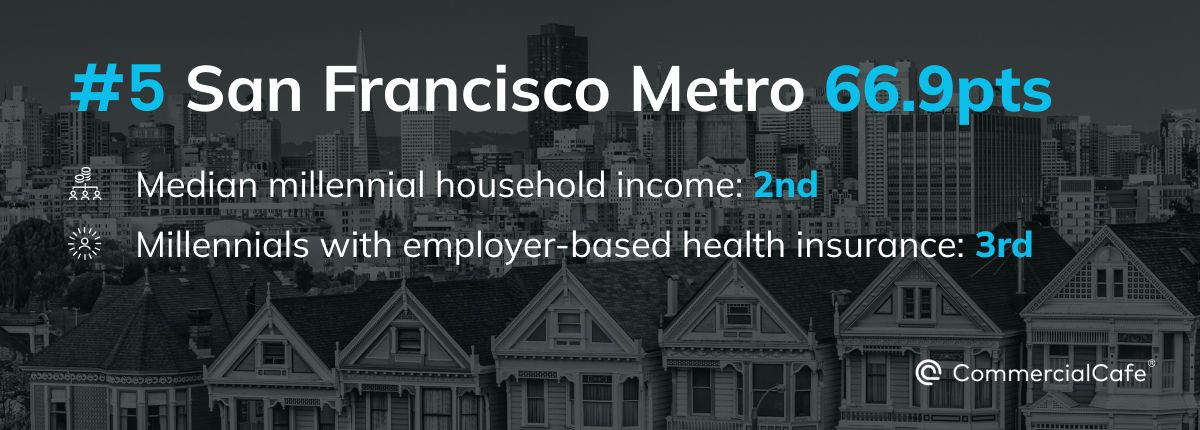
Few places exhibit such a clear division in their evolution before and after the internet and tech boom as San Francisco. Once the home of counterculture and independent artists, it’s now become one of the most exciting — and lucrative — destinations for tech professionals. And, with median yearly incomes for Millennials households of approximately $133,778, it’s also the second-best performing metro area in our ranking for this indicator.
San Francisco also gained points for placing third for both its health insurance coverage and its educational attainment scores among its resident Millennials. According to the latest American Community Survey estimates, roughly 72.9% of people between the ages of 25 and 34 were covered by employer-based health insurance, while 58.9% of people within the same age group had earned a bachelor’s degree or higher.
Notably, the California metro area recorded its lowest score across its cost-of-living indicator: It landed in 10th place behind other West Coast destinations, such as San Jose and Seattle.

The Denver metropolitan area repeated its performances in terms of its Millennial demographics: Once again, it recorded the second-largest gain in residents from this age group (12.8%), bringing the share of Millennials within the MSA’s total population to 16.9% for third place.
However, Denver picked up far fewer points across the remaining indicators this time, with its unemployment rate being its greatest liability. At 3.6%, it was the highest rate of unemployment registered within the ranked metro areas.
Residents here have also felt the squeeze from an increase in consumer prices, as demonstrated by the declining performance of Denver’s regional price parity. According to the Consumer Price Index for Denver-Aurora-Lakewood, the most significant price hikes occurred in used car, gasoline and energy transactions.
Naturally, since the scope of this analysis was limited primarily to demographic and economic factors, we recognize that decisions regarding one’s location or relocation within a metropolitan area are influenced by a wide range of objective and subjective criteria. This includes, but is not limited to: proximity to family and friends; educational opportunities; the local food scene and night life; air quality; public transportation options; and climate.
An active and exciting coworking scene can also be important as it allows many Millennials the flexibility to work in places that meet their needs. To that end, young professionals can further explore various coworking spaces within their city or wider metro area via CommercialCafe.com.
Methodology
To define the Millennial cohort, we used the 25 to 29 and 30 to 34 age groups, as defined by the U.S. Census Bureau.
Points for all indicators were distributed directly proportional to their value, except for the regional price parity and the unemployment rate indicators, for which points were awarded in inverse proportion. Entries could earn a maximum of 100 points.
“Millennial population growth” refers to the relative difference in each metropolitan area’s Millennial population from 2016 through 2020, according to U.S. Census Bureau data. Values scored represented the change in the Millennial population in five years. The maximum weight for this metric was 15 points.
“Proportion of Millennials” represents the percentage of Millennials of each metropolitan area’s total population. The values scored were based on five-year estimates of the U.S. Census Bureau’s American Community Survey (2016-2020). The maximum weight for this metric was 15 points.
“Regional price parity” (RPP) measures the cost of living in a region by comparing it to a national average, conventionally set at 100. Areas with high or low RPPs typically correspond to regions with high or low price levels for rents. In addition to housing costs, RPPs also cover all consumption goods and services. Values scored were the 2020 Bureau of Economic Analysis numbers. The maximum weight for this metric was 15 points.
“Median Millennial household earnings” includes the income of the householder and all other
individuals 15 years old and over in the household, whether they are related to the householder or not. Because many households consist of only one person, average household income is usually less than average family income. Although the household income statistics cover the past 12 months, the characteristics of individuals and the composition of households refer to the time of interview. Thus, the income of the household does not include amounts received by individuals who were members of the household during all or part of the past 12 months if these individuals no longer resided in the household at the time of interview. Similarly, income amounts reported by individuals who did not reside in the household during the past 12 months but who were members of the household at the time of interview are included. However, the composition of most households was the same during the past 12 months as at the time of interview. Age group used: Householder 25 to 44 years. Values scored were based on five-year estimates of the U.S. Census Bureau’s American Community Survey (2016-2020). The maximum weight for this metric was 15 points.
“Unemployment rate” highlights the percentage of those unemployed and actively searching for a job. Values scored were 2022 Bureau of Labor Statistics percentages. The maximum weight for this metric was 15 points.
“Millennials with employer-based health insurance” measures the percentage of Millennials covered by an employment-based health insurance plan. Values scored were 2019 U.S. Census Bureau demographic percentages. The maximum weight for this metric was 15 points.
“Millennials in the labor force with a bachelor’s degree” is the percentage of individuals between the ages of 25 to 34 who are active within the labor force and have a bachelor’s degree. Values scored were based on five-year estimates of the U.S. Census Bureau’s American Community Survey (2016-2020). The maximum weight for this metric was 10 points.
We excluded metropolitan areas with less than 1 million residents.


Diana Sabau
Senior Content Writer, CRE News & Market Analysis
Drawing on years of intense research in the U.S. commercial real estate market at Yardi Matrix, Diana now applies her expertise as a writer for the CommercialCafe blog. Her articles focus on CRE investment, labor market trends, and technology, and have been picked up by prestigious publications including the New York Times, GlobeSt, The Real Deal, NAIOP, MSN, and Bisnow.