Top U.S. Cities for Walkability & Outdoor Recreation


During the past year, many of us have realized the importance of outdoor spaces by either having or not having access to them, and this is even more true in the more densely populated urban centers. It is difficult to convey simply just how important it is to properly integrate green open spaces within the fabric of our ever-expanding cities. So, as National Park Week wraps up, we’re reevaluating the top U.S. cities for walkability and outdoor activity potential. For the purposes of this article, we considered U.S cities with a population of a least 300,000, scoring them for walkability metrics, as well as data on park land ratios, totals and investment. Each ranking factor is detailed in the methodology section. Below are a few highlights on the 15 cities that ranked highest by overall score, followed by a breakdown of the five cities that scored best for each of the individual metrics we analyzed.
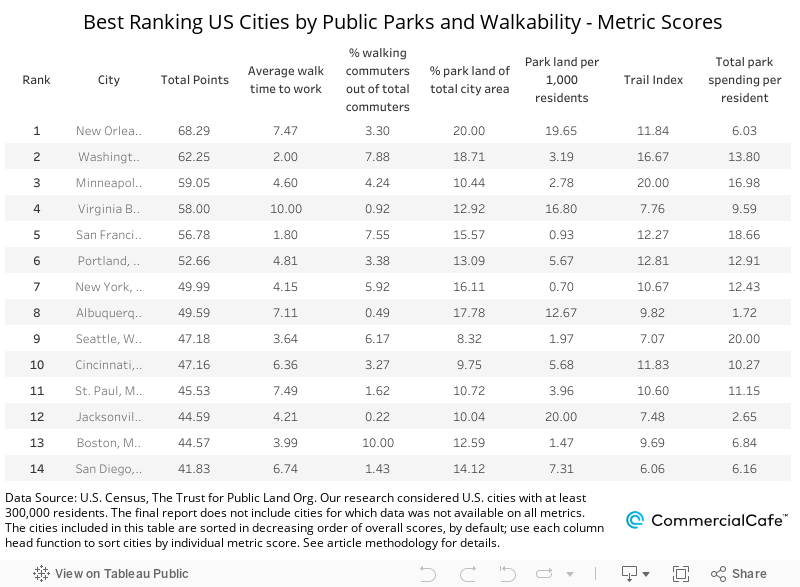
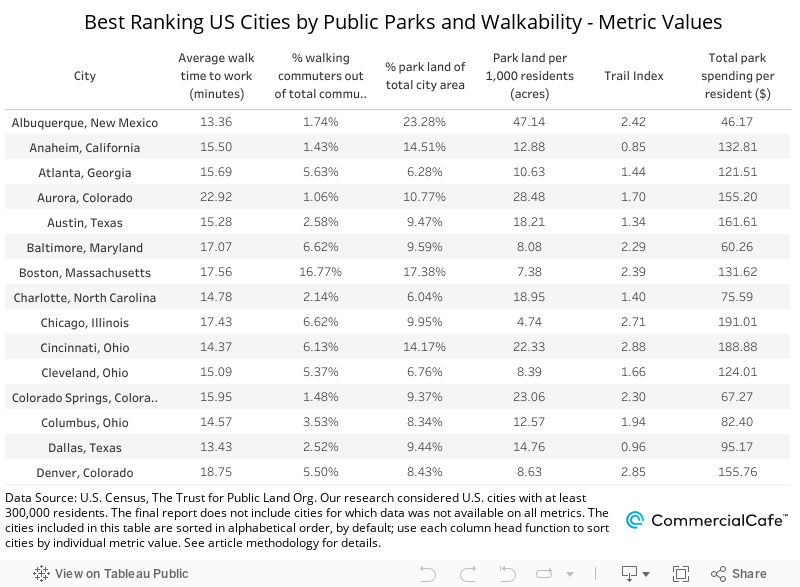
Top 15 U.S. Cities for Public Parks & Walkability
The quality of our built environment has been documented to have a significant effect on people (1). From softening the masonry, metal and glass cityscapes to their notable influence on overall physical and mental health and even medical recovery (2), the importance of easily accessible urban and urban-adjacent green spaces — as well as the overall convenience of walkability within and between communities — is paramount.
Of the cities we looked at for this year’s study, New Orleans earned the highest score (68.29 points of 100), ranking particularly well for its amount of park land relative to the city area, as well as its park area per 1,000 residents. Washington, D.C. landed in second place with a total score of 65.25 points. It had a strong boost for its percentage of commuters who regularly choose to walk, as well as good scores for both its ratio of park land to city area and high trail index. Minneapolis’ ongoing Neighborhood Park Plan — a 20-year investment project that kicked off in 2016 — sustains the city’s strong position among the country’s top-tier park systems. In this year’s ranking, Minneapolis earned a total score of 59.05 points and landed third. Virginia Beach, Va., followed in fourth place, with an even 58 points. The East Coast oceanfront gem ranked well for its residents’ average walk time to work, as well as for its park area ratio metrics. In fifth place was San Francisco, which earned 56.78 points. The city ranked well for its investments in the local park system and its park-to-city area ratio, as well as its above-average percentage of walking commuters.
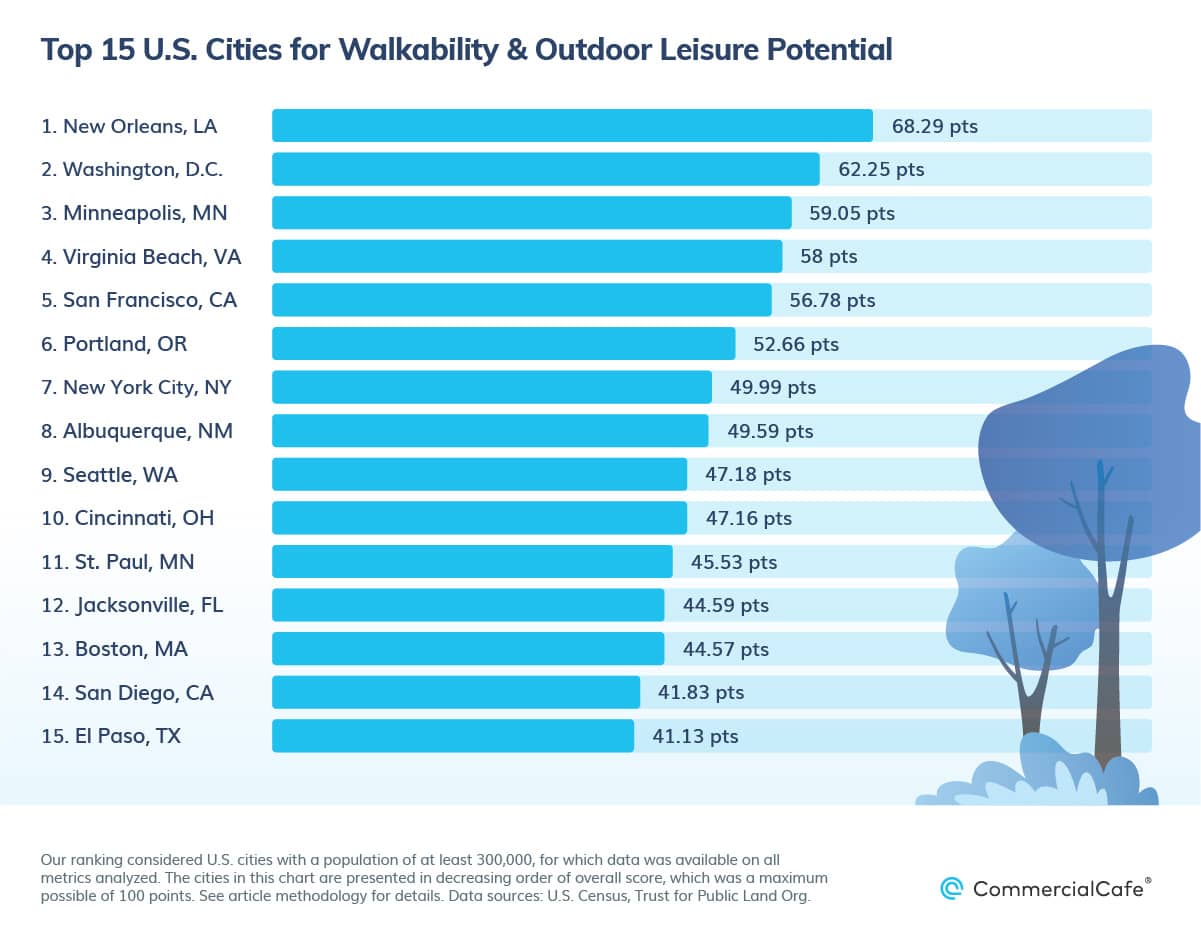
Portland, Ore., garnered a total score of 52.66 points out of 100 and landed in sixth. Oregon’s most populous urban center performed relatively well for its park area ratio and park spending. New York City earned the seventh-highest score (49.99 points), with its strongest suits being its park system size and park spending. The Big Apple also received a good score on its trail index. Albuquerque, N.M., followed close behind in eighth place with a total score of 49.59 points. The city’s nearly 300 parks carried its best-scoring strength — the park-to-city area ratio. Seattle’s performance across the metrics we analyzed added up to a total score of 47.18 points and landed the city in ninth place. The Emerald City’s strongest suit was its total park spending per city resident. Rounding out the top 10 was Cincinnati. The center of Ohio’s largest metropolitan area earned its best scores for park spending and trail index.
Minneapolis metroplex twin St. Paul earned the 11th-highest score (45.53 points), with its best scores including park investment and trail index. Jacksonville, Fla., ranked 12th with an overall score of 44.59 points. The northeastern Florida city stood out for its park area ratio metrics. Not far behind in thirteenth place was Boston, which earned a total of 44.57 points out of 100 and scored well for walking commuters and park-to-city area ratio. San Diego earned the 14th-highest score (41.83 points), ranking fairly well for walking commute time, as well as park area and spending. The 15th-best scoring U.S. city in this ranking is El Paso, Texas, which garnered a total of 41.13 points. The city’s strongest suits were park area ratios and the trail index.
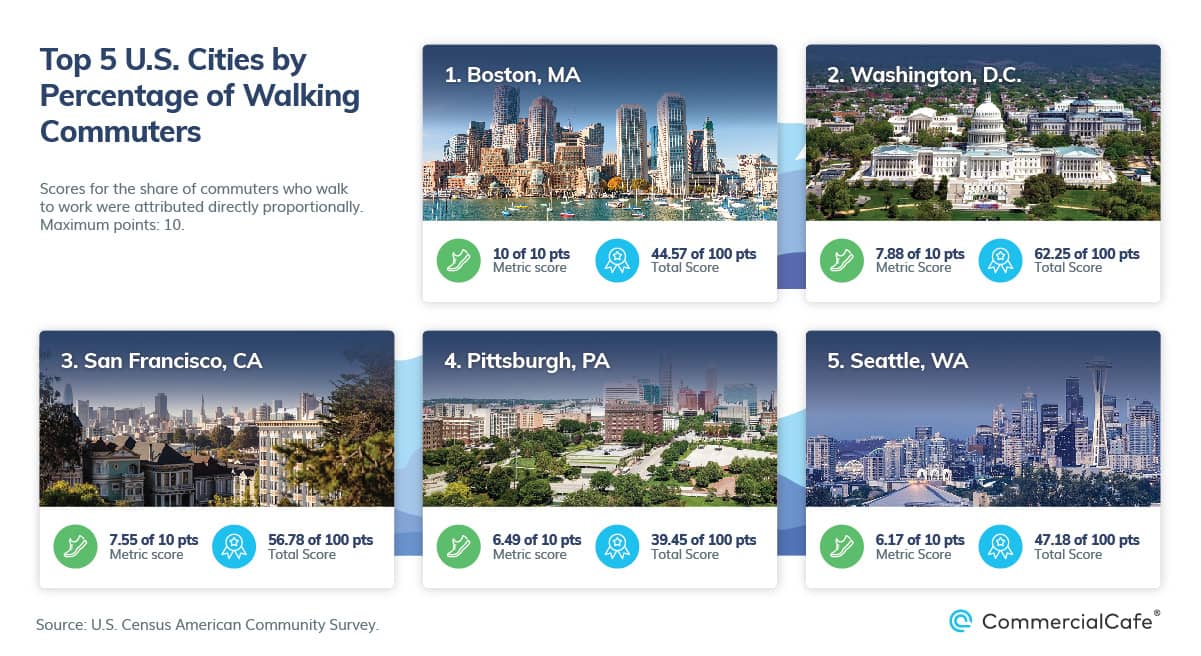
Top 5 U.S. Cities by Percentage of Walking Commuters
Boston is home to the largest share of residents who walk to work in lieu of another form of transportation. With nearly 17% of local commuters reporting that they most often travelled to work by walking, Boston scored 10 out of 10 points for this metric in our current ranking. Next, Washington, D.C. scored 7.88 out of 10 points on this ranking factor and placed second, with 13% of resident commuters traveling to work on foot. The third-highest share of walking commuters among the cities on our list were in San Francisco — 12.9% of resident commuters here walk to work in the famously hilly California city, according to American Communities Survey (ACS) data. Fourth in line for this metric was Pittsburgh, where roughly 11% of commuters reported regularly walking to work. Rounding out the top five was Seattle. The city received 6.17 points out of 10 for this ranking factor, with 10.7% of locals who commute doing so on foot.
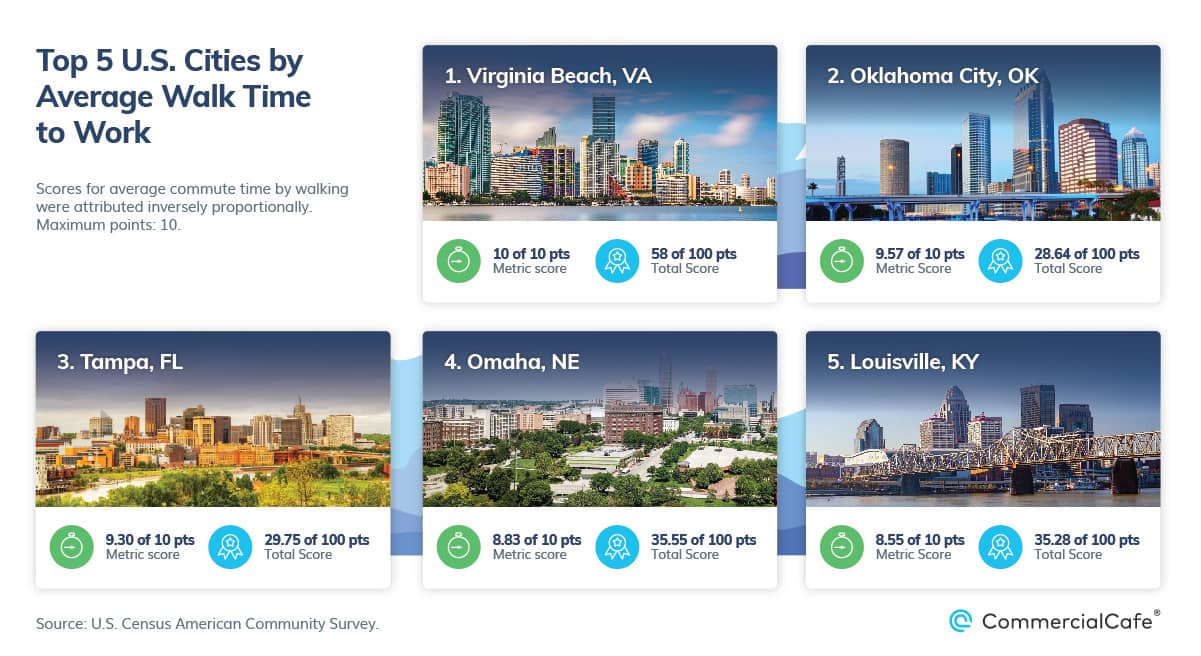
Top 5 U.S. Cities by Average Walking Commute Time
Virginia Beach, Va., boasts the shortest average walk time to work — just under 10 minutes — which earned it the highest score for this metric among the cities on our list. Meanwhile, the average walking commute time of a little more than 10 minutes placed Oklahoma City in a very close second within this group. Tampa, Fla., ranked third for this particular metric, with residents walking to work here reporting an average commute time of nearly 11 minutes, which earned the city a score of 9.3 points out of 10. According to the ACS, the nearly 3% of walking commuters in Omaha, Neb., reported the fourth-shortest average walk time to work, which ranked the Nebraska city fourth in our ranking for this metric. Louisville, Ky., wrapped up the top five with a metric score of 8.83 points out of 10. At 11 minutes and 42 seconds, the historic Kentucky city boasted the fifth-shortest average walk time to work among the cities in our ranking.
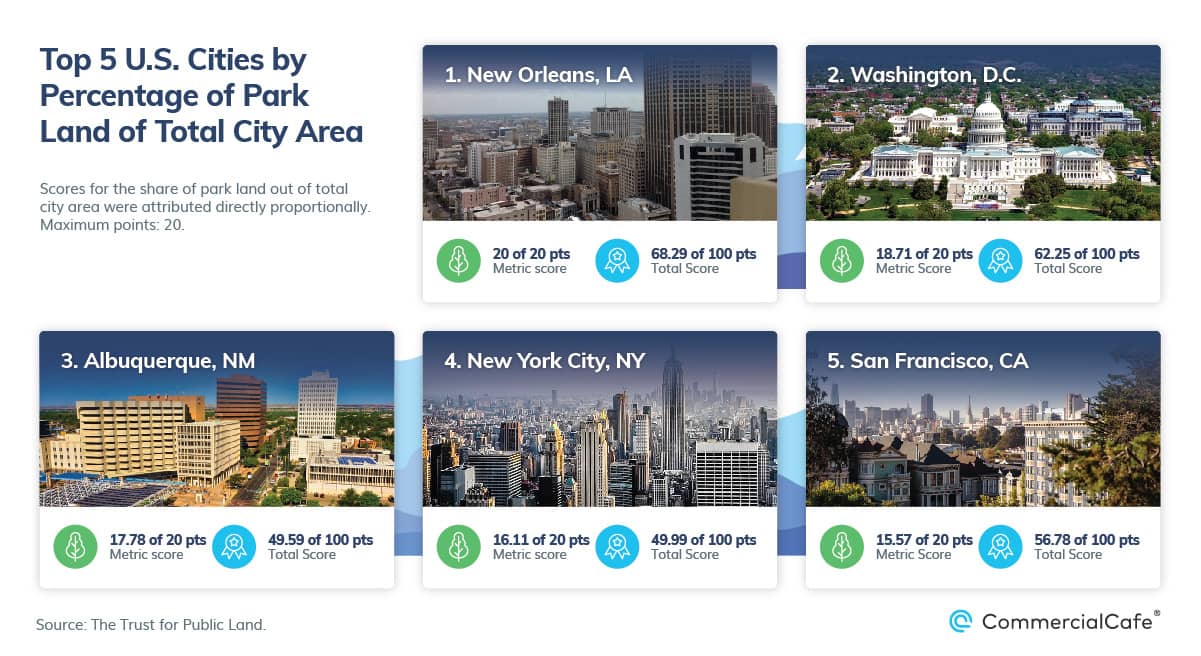
Top 5 U.S. Cities by Public Parks to City Area Ratio
The best score for this ranking factor went to New Orleans, where parks make up nearly 26% of the total city area. The city’s Parks and Parkways department alone oversees and manages more than 2,000 acres of public green space. Washington, D.C. scored 18.71 points out of 20 for this metric and ranked second for public park-to-city area ratio among the cities on our list, with public parks amounting to roughly 24% of the total city area.
We found the third-greenest cityscape in Albuquerque, N.M. Here, more than 23% of city area is dedicated to public park space, which earned this New Mexico city a score of 17.78 points out of 20 for this metric. New York City — one of the most densely populated urban centers in the U.S. — dedicates more than 21% of the city area to public park space, which placed it fourth for this metric. And, if the current “Open Streets” program expands in scope, the percentage of public leisure space in New York City may increase significantly in the coming years. San Francisco landed the fifth-highest score for percentage of public park land relative to city area: For its 20.77% of city land dedicated to public park space, the city earned 15.57 points out of 20 in this category.
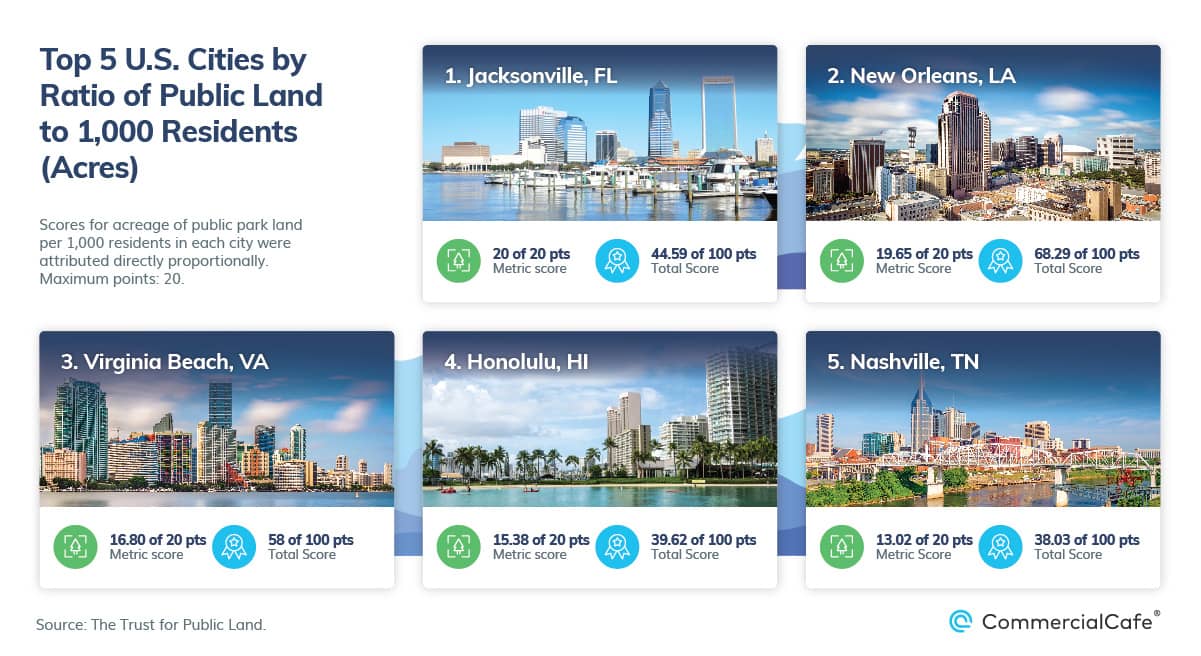
Top 5 U.S. Cities by Park Land per 1,000 Residents
Covering a total of roughly 875 square miles, Jacksonville, Fla., is the largest city by area within the contiguous continental U.S. The 14.5% of city area that’s dedicated to park land here amounts to more than 73 acres per 1,000 residents — the largest spread of public park land access in our list — earning the state’s most populous city a score of 20 out of 20 points for this ranking factor.
New Orleans ranked a close second with 19.65 points out of 20, which it received for its ratio of nearly 72 acres of public park land for every 1,000 locals. Virginia Beach, Va., came in third with a metric score of 16.80 points. The Chesapeake Bay gateway city boasts a park area ratio of nearly 62 acres per 1,000 residents. In fourth place was the popular vacation destination Honolulu. Park land in the Hawaii state capital accounts for 15% of the total city area, which works out to roughly 57 acres per 1,000 residents. Nashville, Tenn., earned the fifth-best score for this metric, with a park area ratio of more than 48 acres per 1,000 Music City locals.
Top 5 U.S. Cities by Trail Index
Combining walking trails for each city with athletic field space, dog parks and playgrounds, the trail index weighs the variety of outdoor leisure options available to residents. Minneapolis earned the highest score on this index and ranked first for this metric among the cities on our list. The cityscape here is notably generous in terms of park space and outdoor leisure potential. Wherever you are in Minneapolis, you’re never more than six blocks away from a park.
Washington, D.C. scored second-best on the trail index, earning 16.67 points out of the maximum of 20. In the third and fourth spots were two cities that are 2,500 miles apart, but very close in metric scores. Sacramento, Calif., ranked third on our trail index, earning 13.96 points out of 20. Outdoor recreation areas in the California state capital range in size between two and 200 acres. They also vary in scope and character from neighborhood parks to community and regional parks, accommodating a wide range of activity needs for residents and visitors of all ages. Across the country, Pittsburgh came in fourth for this metric with a score of 13.09 points. The Steel City’s more than 160 parks include everything from gardens to plazas, playgrounds and hiking, offering a wide range of options for socially distanced outdoor leisure. Rounding out the top five for the trail index was Portland, Ore., which earned a score of 12.81 points for this metric. Parks and natural areas in Portland account for nearly 18% of the total city area and accommodate a wide variety of local recreational preferences.

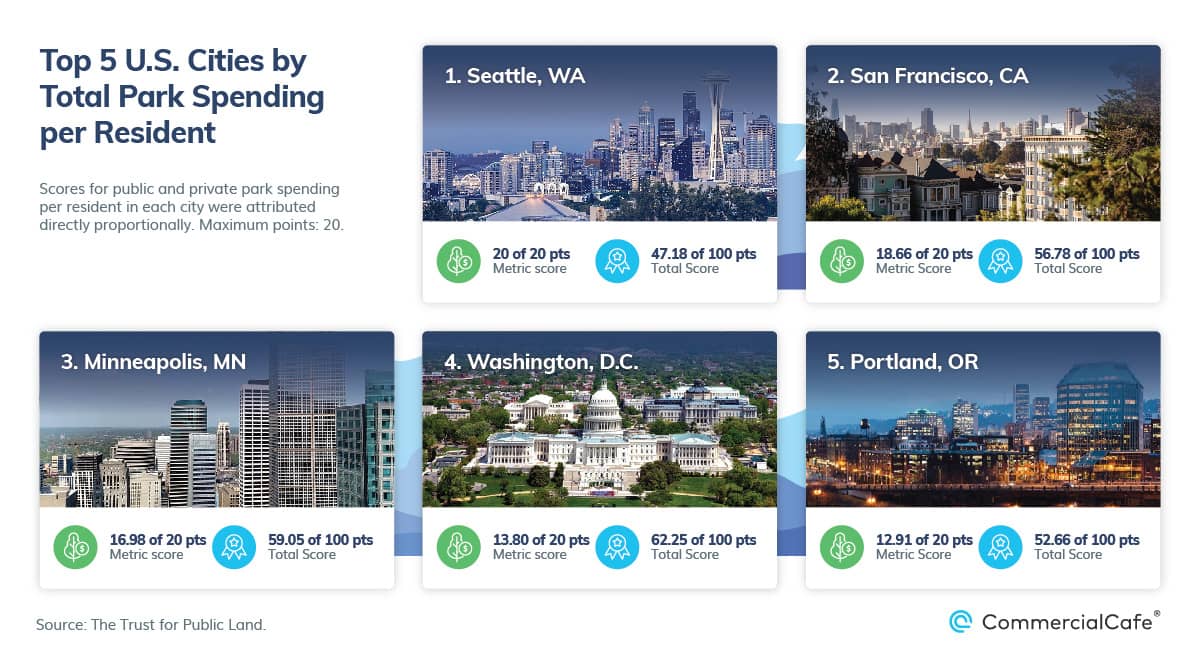
Top 5 U.S. Cities by Park Investment per Resident
Seattle continues to lead the way in terms of total park spending. Including both public and private investment in public park maintenance and improvements, Seattle spends roughly $351 per resident on its parks. San Francisco ranked second for this metric with a score of 18.66 points out of 20, which it earned for the city’s total park spending of $329 per resident. Minneapolis — home to one of the largest urban park systems in the country — ranked third for park investment with just under $301 per resident. Total investment in outdoor recreational spaces in Washington, D.C. amounts to roughly $248 per resident, which garnered the city a score of 13.8 points out of 20 and placed it fourth for this metric. In fifth place, with 12.91 points, is Portland, Ore., where public parks receive roughly $233 in investment per resident, according to the Trust for Public Land Project’s City Park Facts Report.
Methodology
For this latest ranking in our Urban Sustainability series, we analyzed several factors of both functional and leisurely outdoor activity potential in U.S. cities with populations of at least 300,000 residents. Population size — considered according to U.S. Census estimates for 2019 — was not a ranking factor in and of itself. The final list of 58 includes only the cities for which data was available on all factors scored.
For ranking purposes, we assigned composite scores based on six metrics. The maximum number of points earned under each metric was evenly distributed between the lowest and highest metric values. On this scale, a score was calculated for each city. The factors (metrics) on which we based the composite scores are explained below.
For the average walk time to work, the number of points awarded is inversely proportional to the metric values. For all other indicators, the number of points awarded is directly proportional to the metric values.
The first two metrics presented in the above and below tables were based on 2019 U.S. Census data from the American Communities Survey.
- We estimated the average walk time to work by using the intervals (number of minutes) provided by the Census. We then calculated the average for each city using the midpoint of each interval. The maximum weight for this metric was 10 points.
- The rankings by share of walking commuters out of total commuters were also based on data collected by the U.S. Census’ 2019 ACS. Scores were awarded for the percentage of commuters who regularly walk to work in each city. The maximum weight for this metric was 10 points.
We based scores for the following four metrics on values made available by the Center for City Park Excellence Trust for Public Land under the 2020 City Park Facts project.
- The percentage of park area of the total city area, for which the maximum weight was 20 points.
- The ratio of total public city park land (acres) per thousand residents of each city. The maximum weight for this metric was 20 points.
- The trail index is a custom metric designed to score the amount and availability of several outdoor amenities together. As such, it combines: natural and improved walking trails within and in the immediate vicinity of each city; athletic field space per 100,000 residents; dog parks per 100,000 residents; and playgrounds per 10,000 residents. The maximum weight for this metric was 20 points.
- Last, but not least, the total amount of public and private park spending per city resident. The maximum weight for this metric was 20 points.
Additional References
(1) Higuera-Trujillo JL, Llinares C, Macagno E. The Cognitive-Emotional Design and Study of Architectural Space: A Scoping Review of Neuroarchitecture and Its Precursor Approaches. Sensors (Basel). 2021 Mar 21;21(6):2193. doi: 10.3390/s21062193. PMID: 33801037; PMCID: PMC8004070.
(2) Ulrich RS. View through a window may influence recovery from surgery. Science. 1984 Apr 27;224(4647):420-1. doi: 10.1126/science.6143402. PMID: 6143402.
Want to see what some of the greenest office markets in U.S. have to offer? Select any of the locations linked below to check out the local listings:


Ioana Ginsac
Senior Content Writer, Industry News & Reports
Ioana is a content writer who has been covering all-things-CRE (and more) for several Yardi network publications since 2017. You will find her byline regularly in industry news and market reports, but also on articles covering sustainable development, green urbanism, and innovation, all of which she has been passionately learning about for more than a decade. Her work has been referenced by publications including AmericanInno, Bisnow, BusinessInsider, Commercial Property Executive, Curbed, Fast Company, Forbes, GlobeSt.