Top US Cities for Women in STEM (2021 Ranking Update)


Even before the COVID-19 pandemic, science, technology, engineering, and mathematics (STEM) occupations were expected to undergo rapid growth, along with healthcare, creative fields, and business services (1). Everything that unfolded throughout 2020—and continues to develop—has underscored the importance of STEM work more so than at any other time in recent history. In fact, employment projections published in January by the U.S. Bureau of Labor Statistics (BLS) showed that STEM occupations would likely grow 8% by 2029, compared to 3.7% growth for all occupations.
Meanwhile, female representation in STEM fields remains disproportionately low. Specifically, even though women outnumber men among college graduates in the U.S., they continue to be vastly underrepresented in most STEM fields and majors (2). One year ago, we conducted our first study dedicated to ranking the top U.S. cities for women working in STEM. Revisiting the topic this year, we have refined our methodology to focus on indicators that track local STEM employment and the representation of women in the local STEM sector, as well as the levels and evolution of income for women relative to the overall sector.
Ranking 120 Very Different US Cities for Representation of Women Working in STEM
Computer-related jobs currently account for roughly half of STEM employment, and continued growth in the digital economy is expected to sustain high demand for computer occupations throughout the next 10 years. And, because last year’s wide-scale transition to remote work boosted the redistribution of computer-using talent across growth centers outside of traditional clusters, we looked at STEM employment information for a broad variety of locations.
Our full ranking includes the 120 U.S. cities with a population of at least 200,000 and for which data was available on all the metric categories that we considered for this study. While there is demographic divergence across the list—as well as variation in the occupational mix among the cities considered for this article—each locale has distinct merits that influence decisions of where one would work and live. Accordingly, these merits often pertain to lifestyle factors that do not lend themselves to standardized analysis and were not tracked for the purposes of this ranking.
Read on for details on the cities leading the nation overall, as well as which U.S. cities ranked best for representation of women in STEM within their region in the western U.S., southern U.S., midwestern U.S., northeastern U.S. Ranking highlights are followed by insightful interviews with female STEM professionals regarding what encouraged them to pursue a STEM career, as well as the biggest challenges they faced along the way.
Western US Dominates Top 10 Cities for Representation of Women in STEM
While western U.S. cities account for eight of the 10 best cities in our 2021 ranking, the highest score went to the largest urban center in the northeast: New York City earned a total of 20.62 points out of the maximum of 30 points. New York boasts one of the most diverse economies in the country, and STEM jobs here account for 5.2% of the total employment in the city. Specifically, the local STEM sector accounts for nearly 216,000 jobs, 31.8% of which are held by women—one of the highest-scoring representations among the cities in our ranking. Meanwhile, in terms of pay, New York recorded the fifth-highest increase of median yearly income for women holding local STEM jobs. Their median income saw a five-year increase of 22.2% starting in 2015.
San Francisco landed in second place. The city’s overall score of 19.14 points was the result of higher-than-average performance across nine of the 12 factors we assessed. Here, STEM jobs account for 15.7% of employment in San Francisco and a total of nearly 85,000 employees, 27.9% of which are women. The city also ranked well for income metrics: data showed that STEM jobs in San Francisco paid women the third-highest median yearly income in the U.S.
Seattle placed third with a total score of 19.04 points. This Washington powerhouse stood out for the growth of its local STEM sector, which added nearly 32,000 jobs in the five years since 2015. The latest data also shows that STEM jobs in Seattle account for 19.5% of local employment, and women represent 26.8% of that.
San Jose, Calif., scored a total of 18.84 points and came in fourth. The heart of Silicon Valley stood out for highest-paying STEM jobs overall, as well as the second-highest median income for women working in STEM in the U.S. And, although the city is generally associated with high-technology industries, the economy here is actually more diverse than that. STEM jobs in San Jose account for 17.6% of local employment, and women hold 25.8% of those jobs, placing the city ninth for women’s representation in the local sector.
Fremont, Calif., rounds out the top five with a total score of 16.08 points. This Bay Area city’s strongest suits were local STEM sector size (STEM jobs account for 29.7% of total local employment) and earnings metrics. Women occupy 25.7% of local STEM jobs in Fremont and, according to the Census data we analyzed, earn the highest wages. Fremont scored best among the cities on our list for median income of women working in STEM occupations.
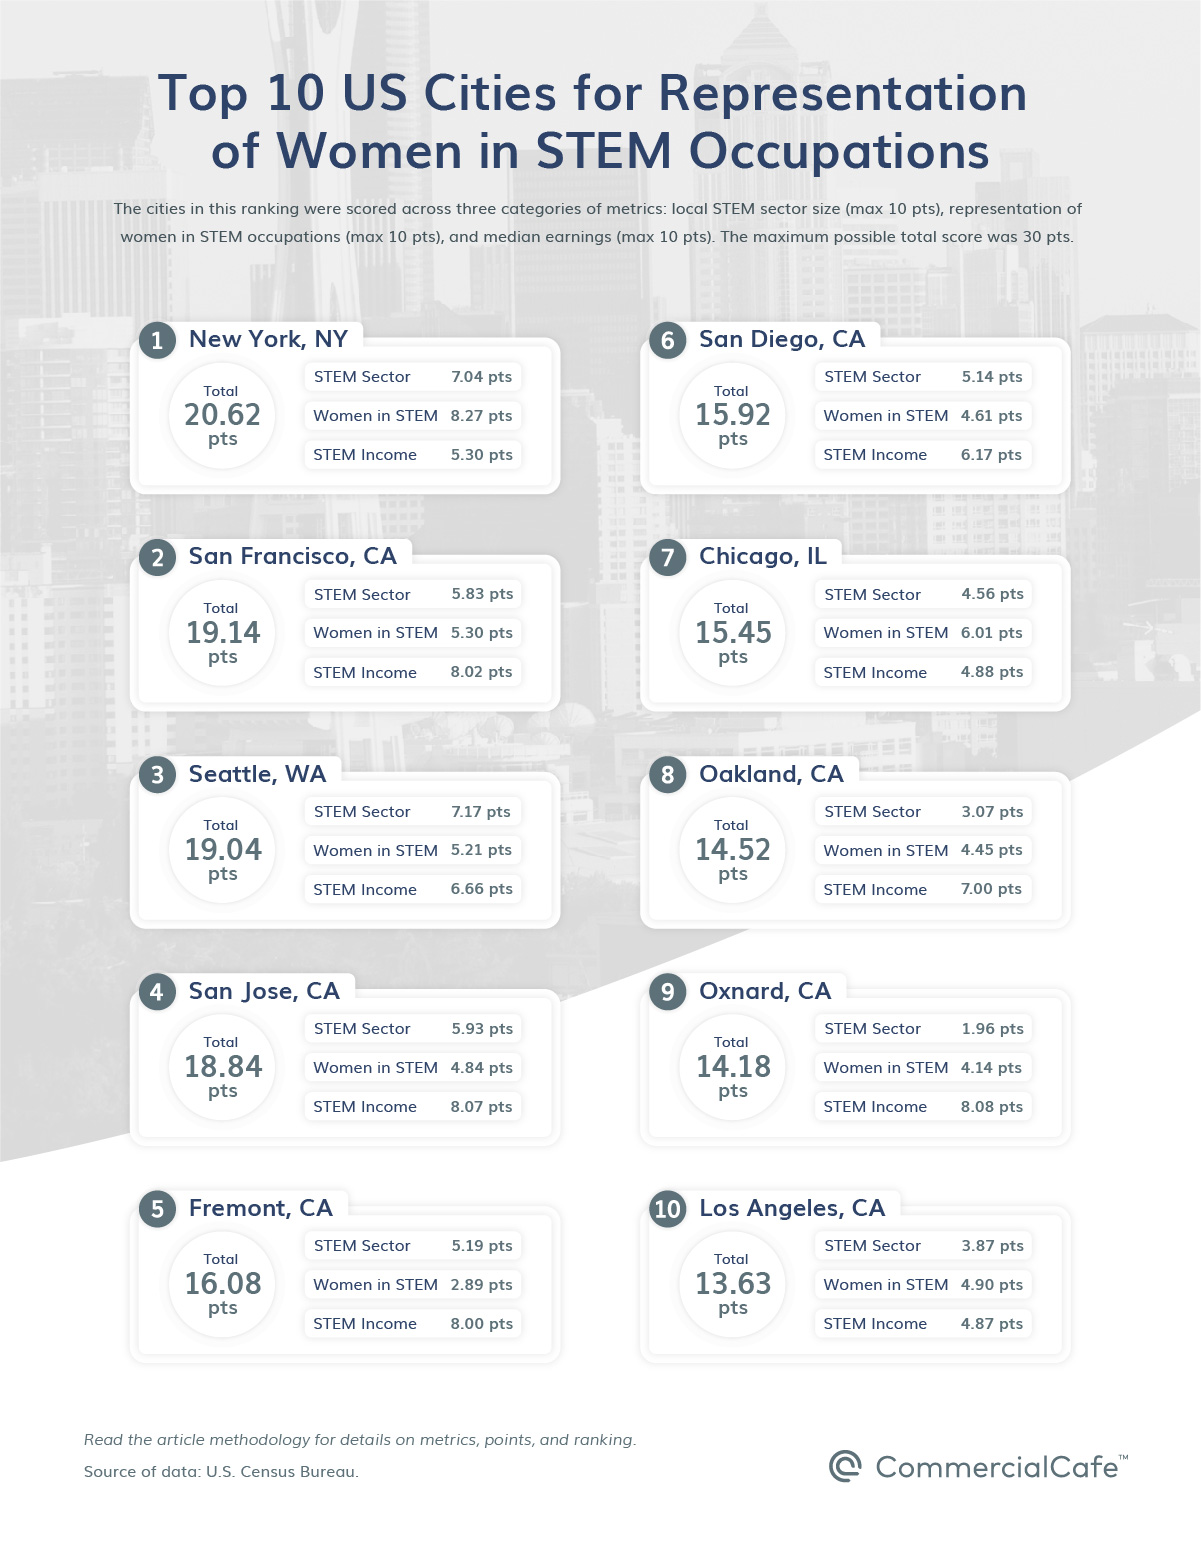
San Diego earned a total of 15.92 points and came in sixth nationwide. The Southern California city scored third-best for increase in women STEM workers’ earnings—up 31% from 2015. Here, women accounted for 28.2% of the city’s STEM workforce in 2019 and earned the fifth-highest median yearly income in this top 10 ranking. With various manufacturing and innovation industries operating in the city’s diverse economy, STEM jobs in San Diego account for 12.5% of the total employment.
Chicago—the only other non-western U.S. entry in the top 10—was seventh in the ranking with a total score of 15.45 points. The city’s female STEM workforce is second in size only to New York City. In fact, the roughly 30,000 women working in STEM in Chicago account for 31.6% of all local STEM jobs—which, in turn, makes up 6.9% of the total local employment. Chicago also ranked second for its increase in the number of women STEM workers: the city gained nearly 11,000 new female STEM employees since 2015, which marked a roughly 4.9% increase in representation over the five-year period.
Rounding out the top 10 in the final spots are three California cities: Oakland, Oxnard, and Los Angeles. Oakland earned a total score of 14.52 points and landed in eighth. The city’s strongest suit was the share of women employed in the local STEM sector—37.3% of local STEM jobs are held by women, which was the highest share of representation among the cities in this ranking. Oakland also performed well for earnings metrics. The median income for STEM jobs here grew 39.4% since 2015, and the median income for women in STEM jobs in Oakland grew 37.2% during the same five-year period.
These impressive percentage increases were second only to Oxnard (in ninth place with 14.18 points), where the median yearly income for women working in STEM shot up 71% since 2015, placing the city first for this metric. Compared to the rest of the cities in the ranking, the asymmetric percentage increases seen in Oxnard can be linked to a series of company relocations and expansions during those five years, which drove up numbers significantly in the context of a comparably small local STEM workforce. These jobs make up 4.6% of total employment and account for roughly 4,700 STEM workers, 36.9% of whom were women. Previously, during the five-year period beginning in 2015, the city added approximately 2,900 STEM jobs, of which women held roughly 1,500.
Los Angeles scored a total of 13.63 points and landed in 10th place. The city ranked second for its number of STEM jobs, which stood at about 98,600 in 2019. L.A. also ranked third for its number of women STEM workers, which included nearly 30,000 in the same year. As a sprawling city with a highly diverse economy, STEM jobs here account for 4.8% of total employment. And, with women making up 30% of the city’s STEM workforce, Los Angeles ranked fifth for representation among the cities on our list.
With investments and interest in life sciences being at an all-time high, office space is consequently experiencing increasing demand as well. If you’re looking for office space — life sciences space or otherwise — make sure you check out the diverse spaces CommercialCafe has to offer across top destinations in the U.S.:
Top Western US Cities for Representation of Women in STEM
Of the 120 cities included in our current ranking, 47 are located in the western U.S. region, making it the largest regional group in the mix. What’s more, eight of the regional selection included here also ranked among the top 10 U.S. cities for representation of women in STEM: San Francisco, Seattle, San Jose, Fremont, San Diego, Oakland, Oxnard, and Los Angeles. In fact, California is home to 22 of the 47 western U.S. entries in the ranking.
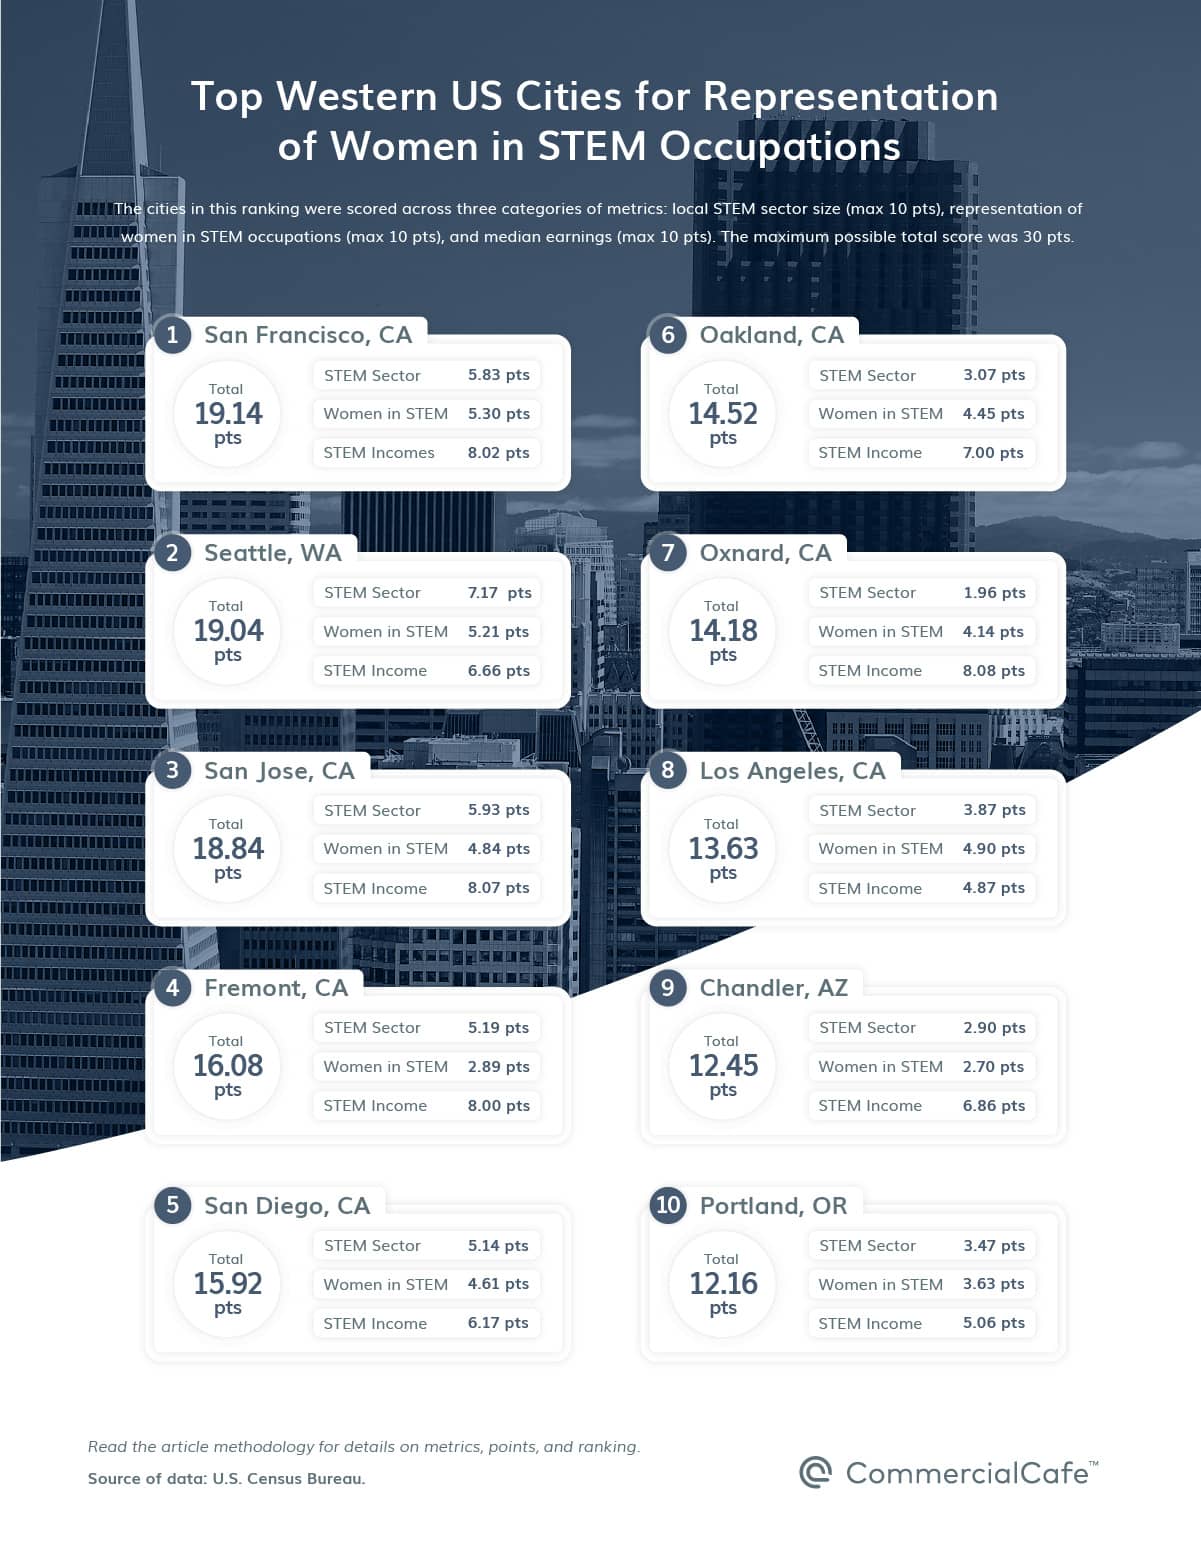
The second-best represented state in this region is Arizona with seven entries. Here, Chandler scored 12.45 total points and was ninth-best among western U.S. cities. The city’s STEM sector accounts for 14.5% of local jobs, and women represent 25.8% of the local workforce. They also earn the fifth-highest median yearly income among occupational peers within this group.
Portland, Ore.—which scored a total of 12.16 points—scored 10th-best as far as western U.S. cities for representation of women in STEM. The only Oregon entry in the ranking, Portland’s strongest suits were its earnings metrics. During the five years since 2015, the median yearly income for women working in STEM here increased 25.5%—the fifth-largest increase among the top 10 western U.S. cities. More precisely, the most recent Census data showed that the median income for a female STEM worker in Portland was just under $70,500—the ninth-highest in the group, and one of 42 cities nationwide where the median income was above the national average of $67,410.
Top Southern US Cities for Representation of Women in STEM
The second-largest regional group in the mix is represented by southern U.S. cities, which occupy 45 of the 120 positions in this ranking. Within this group, Washington, D.C. placed best with a total score of 13.57 points. Here, local STEM jobs make up 12.7% of the total employment, and women account for 38% of the STEM sector. The latest data also showed that Washington, D.C., was home to the sixth-highest median income nationwide for female STEM workers—following a 34.6% increase over five years since 2015. Although these individual metric values would compete with the top 10 cities nationwide, Washington, D.C.’s overall score lagged just outside of the top 10 due to its 4% decrease in the number of female STEM workers during the same five-year period since 2015.
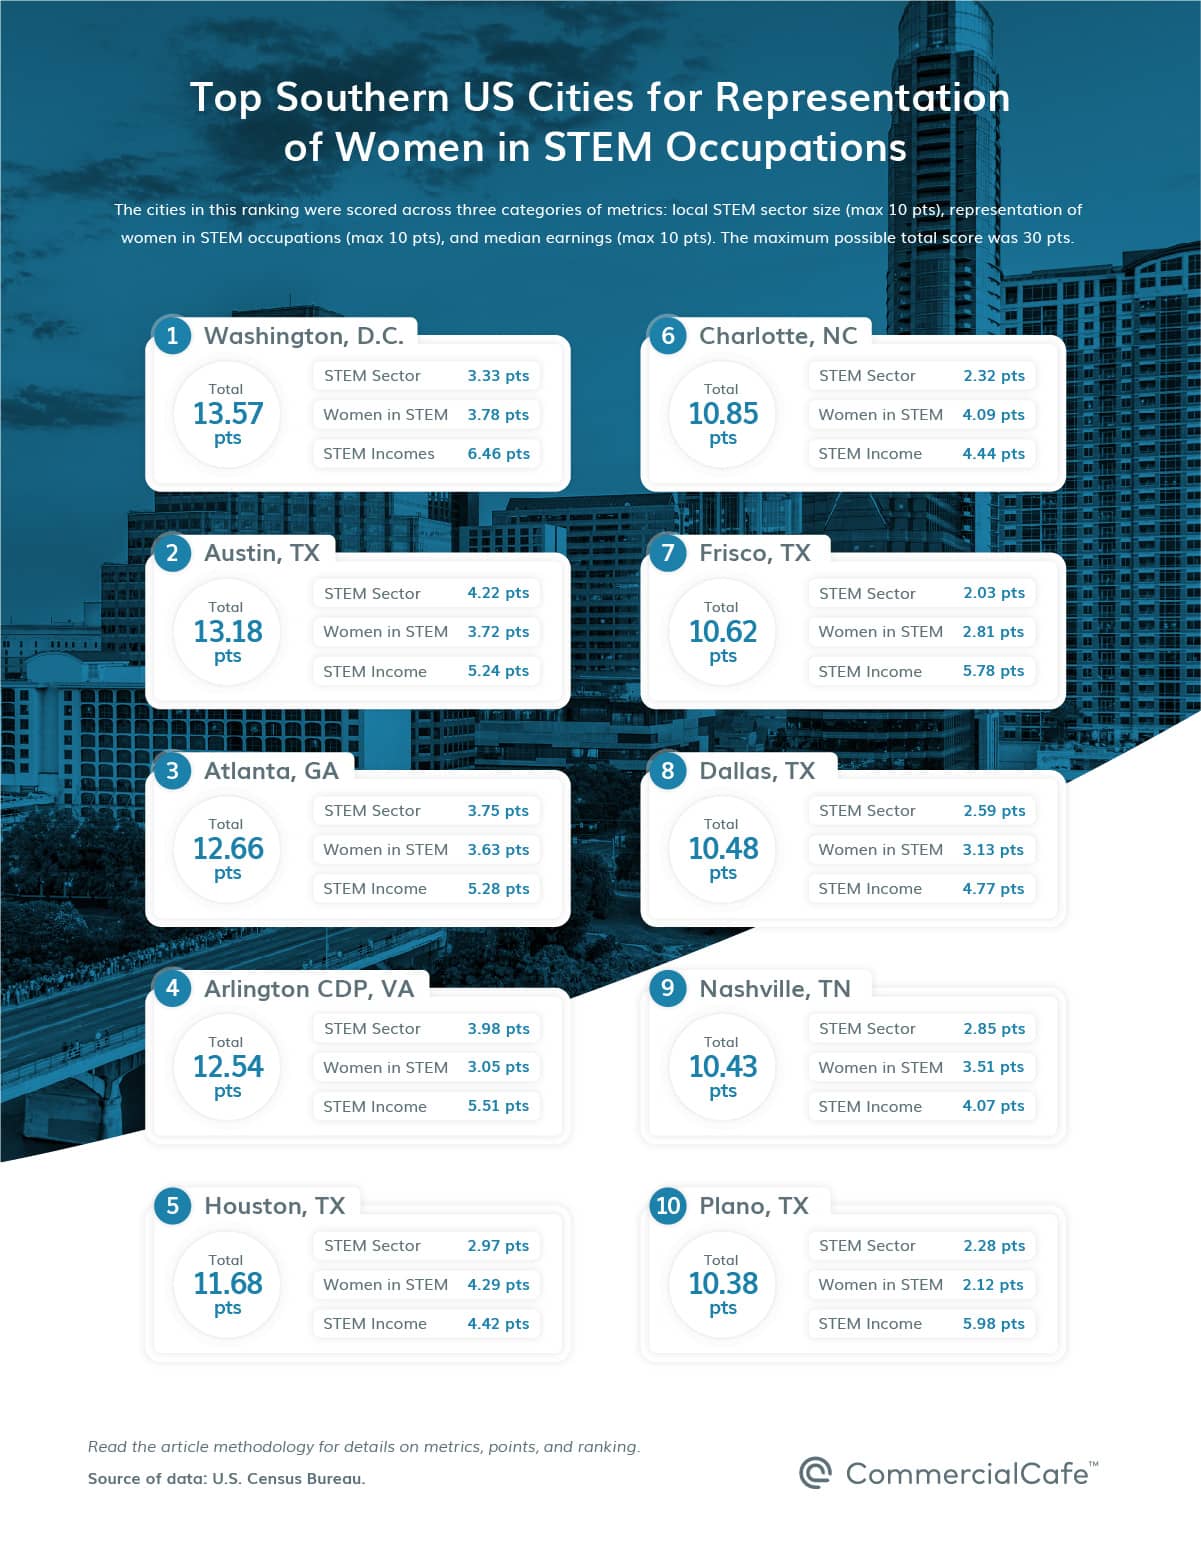
Austin garnered a total of 13.18 points, which ranked second-best among southern cities and 12th-best nationwide. Leading the 14 Texas cities included in this study, Austin is home to a STEM sector that includes some 73,000 jobs, which account for 12.6% of total local employment. Women occupy 25.6% of STEM jobs here and earn the fifth-highest median income within this group. Other Texas cities to rank among the 10 best in the southern U.S. include Houston (fifth place), Frisco (seventh), Dallas (eighth), and Plano (10th).
Atlanta—the only Georgia entry in the ranking—scored a total of 12.66 points. Here, the STEM sector accounts for 10.7% of total employment in the city, and women make up 31.4% of it. Since 2015, the median income for women working in STEM in Atlanta has increased 37.4%. In fact, according to the most recent official data, they were earning the fourth-highest median income among the cities in this ranking.
Charlotte, N.C., placed sixth among southern U.S. cities with a total score of 10.85 points. Women make up 32.4% of the Queen City STEM sector. Specifically, this account for accounts for 8% of total employment in Charlotte and includes nearly 39,000 jobs.
In ninth place with a score of 10.43 points is Nashville, Tenn. Music City’s STEM sector is 6.7% of all local employment and includes more than 25,500 jobs. The latest numbers show that women represent 32.4% of the local STEM workforce, following a modest increase of 1.1 percentage points (pp) in the share of female STEM workers in the five years since 2015.
Top Midwestern US Cities for Representation of Women in STEM
The Midwestern U.S. region is home to 19 of the 120 cities included in this ranking. Chicago, which ranked seventh-best nationwide, takes first place regionally.
Minneapolis ranked second within this group with a total score of 10.57 points. The local STEM workforce here is 27,000 strong and accounts for 10.8% of total employment in the city, and women are 25.3% of the Minneapolis STEM sector. But, unfortunately, this percentage follows a five-year decrease. According to Census numbers, the share of women working in STEM jobs in Minneapolis dropped 2.6pp compared to 2015.
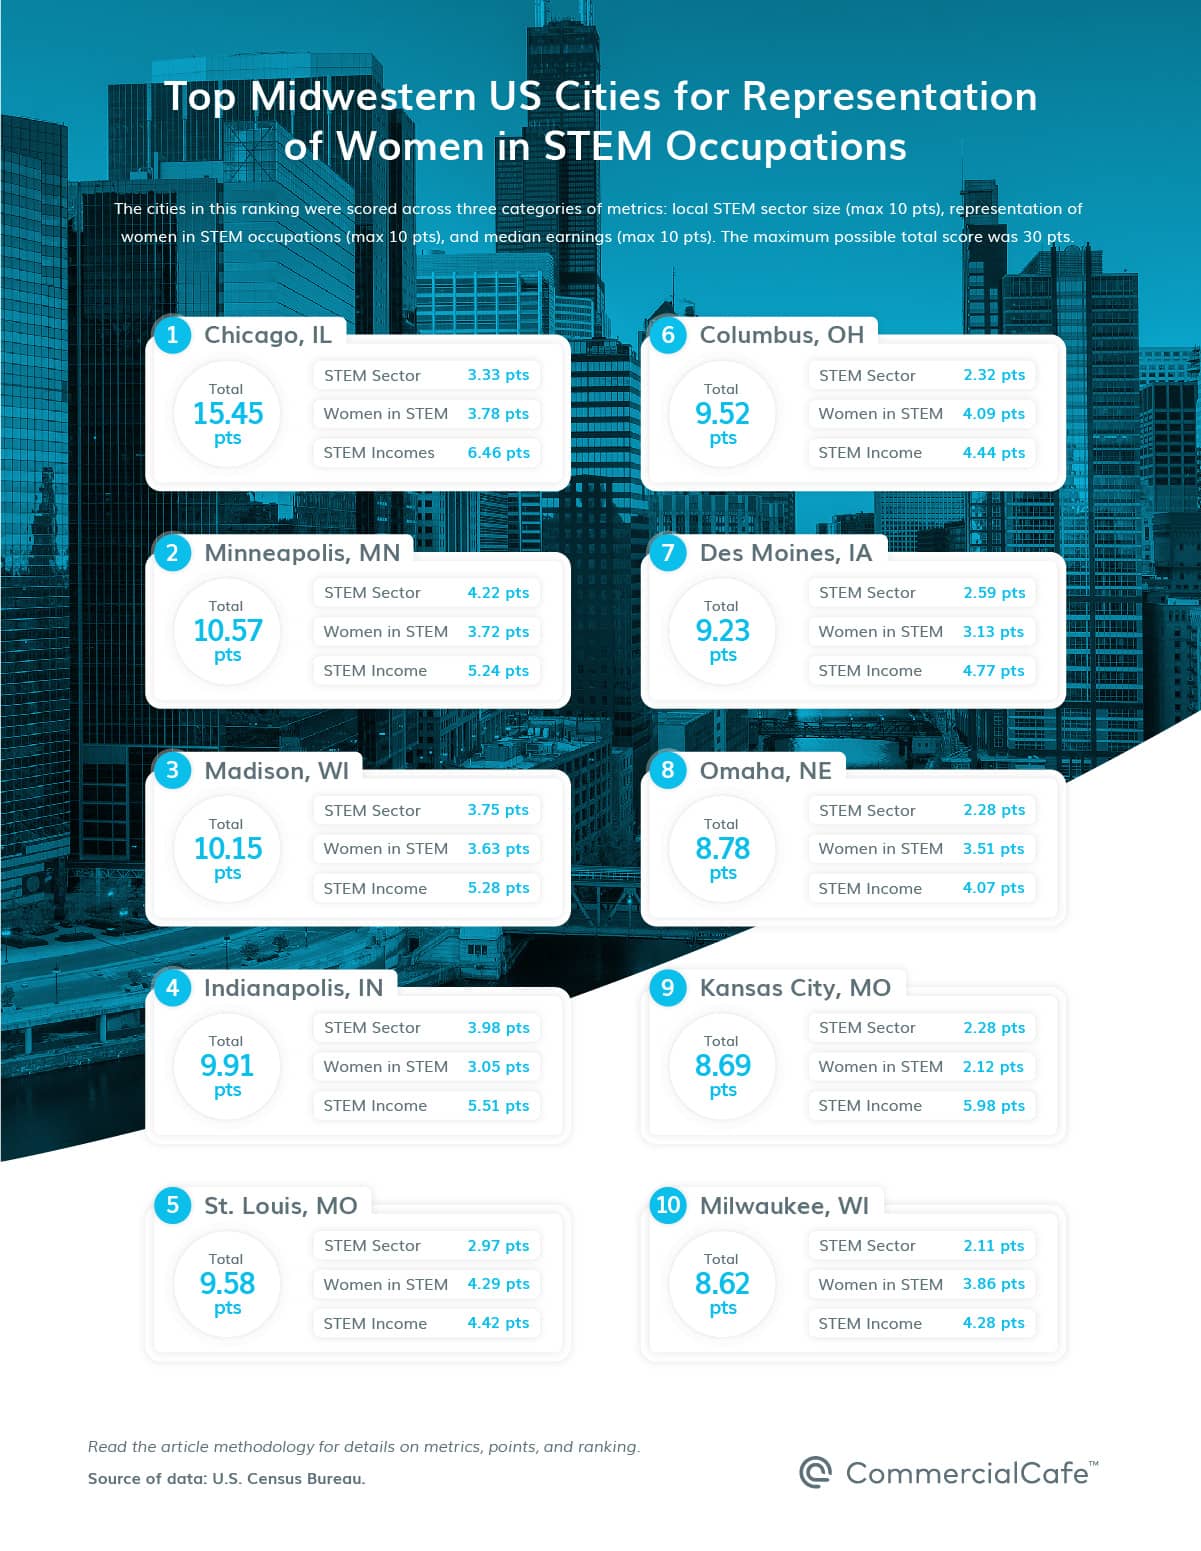
Madison, Wis., was the third-best midwestern U.S. city for representation of women in STEM, scoring a total of 10.15 points. STEM jobs here account for 14.7% of total employment and women hold 30.3% of the jobs in this sector. The city also ranked sixth in the region for female STEM workers’ median income, which actually increased 62.2% since 2015.
Indianapolis scored 9.91 points and landed fourth among cities in the Midwest. The city is home to the fourth-largest STEM workforce in the region, a sector that includes 26,300 jobs and accounts for 6.2% of the total local employment. Since 2015, the share of women in local STEM jobs here has increased 7.3pp and grew to represent 36.3% of employment in this sector.
St. Louis rounds out the top five with a score of 9.58 points. The Missouri metro’s relatively small STEM workforce includes 12,600 jobs, of which women hold 37.4%. The sector accounts for 8.1% of the city’s total employment and recorded a 24.8% increase in median income since 2015—the largest five-year percentage growth for this metric among the top 10 cities in the region.
Top Northeastern US Cities for Representation of Women in STEM
Only nine northeastern U.S. cities are included in our data set. Of course, New York City leads the list in the first position.
Jersey City, N.J., follows in second place with a total score of 12.52 points. The city’s relatively small STEM sector includes 18,200 jobs, which account for 12.5% of total local employment. Within this sector, women hold 30% of jobs, following a 13.6pp increase in the share of female STEM workers since 2015—the largest five-year percentage point increase in the region. Jersey City also ranked first for earnings metrics: the median income for women STEM workers here is the highest among the northeastern U.S. cities included in this ranking.
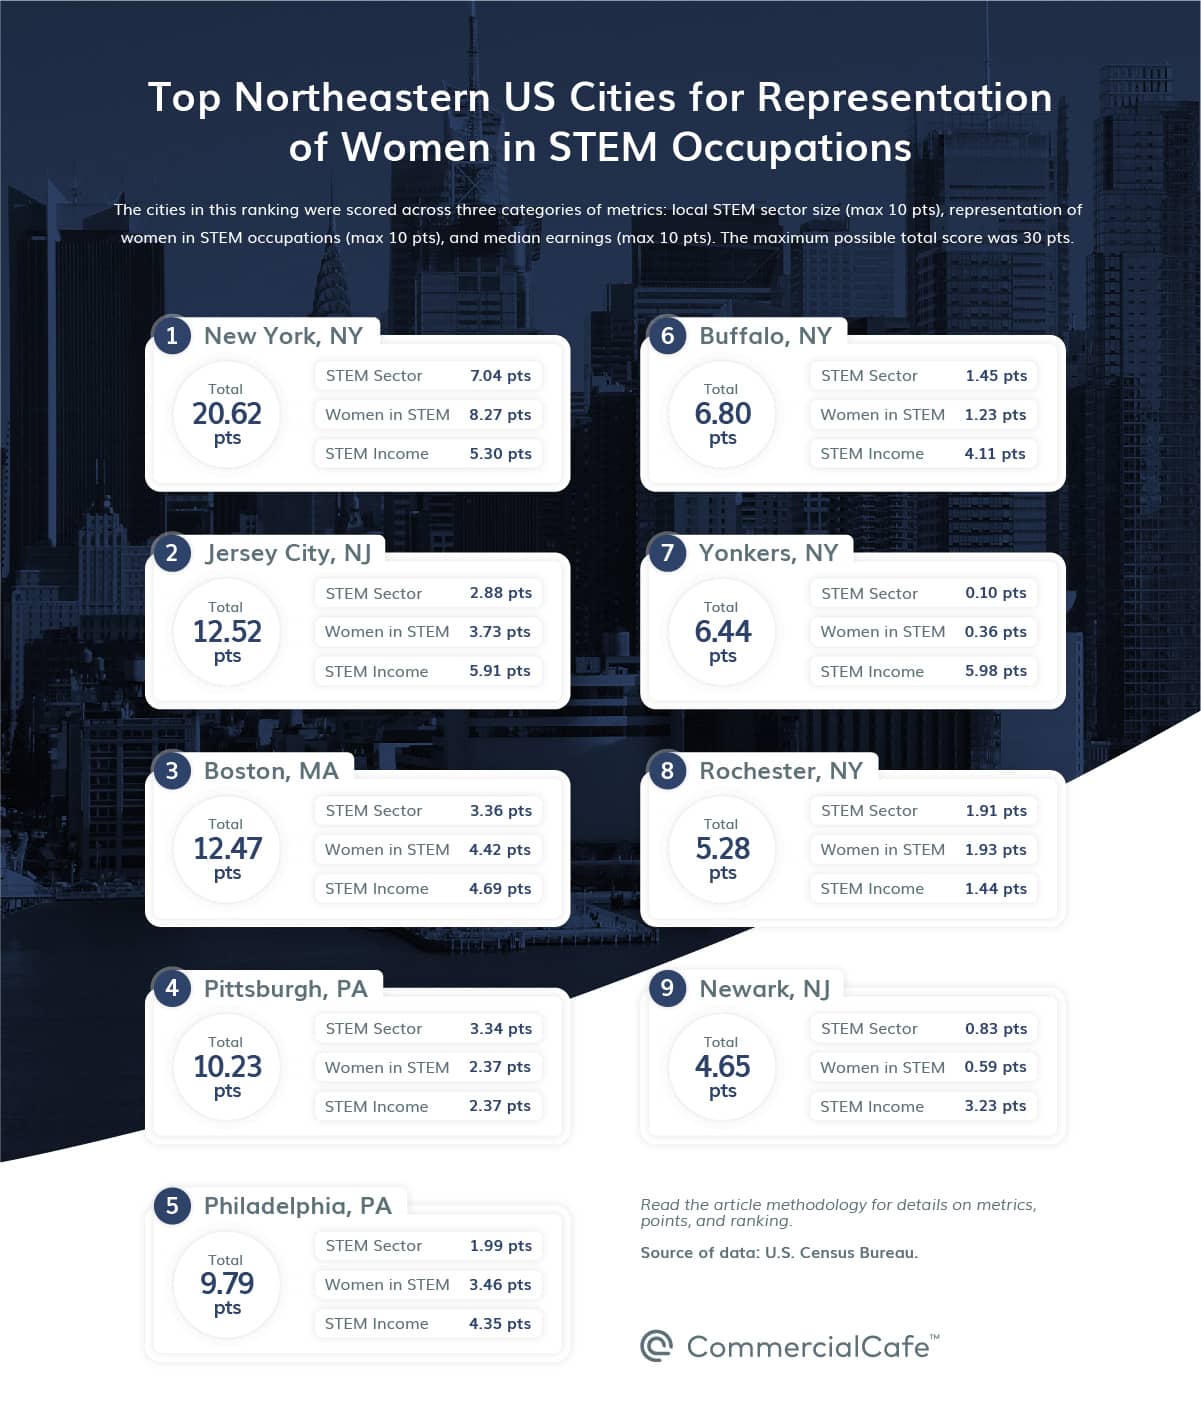
Boston ranked a close third with a total of 12.47 points. The New England powerhouse is home to the second-largest STEM workforce in the region, which is 40,400 strong and makes up 9.9% of the total employment in the city. In Boston, women hold 36.3% of the jobs in the sector—the highest percentage representation among major northeastern U.S. cities.
Pittsburgh earned a score of 10.23 points and ranked fourth in this group. The STEM sector here represents 12.4% of the total employment, 27.1% of which is occupied by women. While the local STEM sector saw a 3.7% increase in the number of jobs since 2015, the share of women employed in STEM occupations dropped 5.5 percentage points at the end of that five-year period. The most recent data showed that this sector included slightly less than 20,100 jobs locally.
Wrapping up the top five is Philadelphia, which scored a total of 9.79 points. The 38,000 STEM workers here make up 5.2% of the local employment and are 33.8% women—the second-best ratio in the region. And, while the size of the local sector has remained roughly the same since 2015, wages have increased. Specifically, the median income for a Steel City STEM employee grew 19.2% in those five years, although the median income for female STEM workers increased 15.5% during the same timeframe. Nevertheless, the most recent data shows that women working in STEM occupations in Philadelphia had the fifth-highest median income in the northeastern region.

Katerina Akassoglou, Ph.D.
Director, Center for Neurovascular Brain Immunology; Senior Investigator, Gladstone Institutes; Professor, Department of Neurology, University of California, San Francisco

image courtesy of Katerina Akassoglou, Ph.D.
What encouraged or inspired you to pursue working in STEM?
“I was encouraged by my high school biology teacher. I am first generation to college, and I had no role models in STEM as I was growing up. In fact, it had not crossed my mind that my deep interest in science could be linked to a potential career path. My high school biology teacher recognized my passion for science and helped me to connect the dots between scientific curiosity and carving a career path in STEM. A defining moment was when she informed me that laboratories accept summer interns. Spending a summer working as an intern at an immunology lab was inspiring and exciting and, that summer, I knew that I would pursue working in STEM.”
Could you share what you found to be the biggest hurdle along the way?
“I am an out-of-the-box thinker and finding the necessary recourses to support new ideas has been a challenge and an opportunity that paved the way for fantastic collaborations, unanticipated discoveries and, hopefully, new ways to combat devastating brain diseases.”
Is there a particular organization or initiative that you would recommend supporting that is working to support girls considering STEM fields and/or is working toward better representation of women in STEM?
“I recently became familiar with Young Women in Bio and I look forward to learning more about this and other organizations educating and empowering girls considering STEM fields.”
Reach out to Young Women in Bio for information on how to volunteer and/or sponsor their work.
Nikole Collins-Puri
CEO of Techbridge Girls; social justice leader, advocate and mentor with a rich professional experience in tech, philanthropy and education

Image courtesy of Nikole Collins-Puri
What encouraged or inspired you to pursue working in STEM?
“I studied political science with the hope of going to law school so I could change policies and systems for my community. As I was waiting to transition to law school, I landed an internship at AT&T that changed my perspective of the power of the tech industry and shaping social norms and creating access for communities. Ironically, my internship led to a 10-year career that started off bringing Digital Subscriber Line (DSL) into U.S. households and ended with leading Diversity, Equity and Inclusion strategy for the company’s largest department. That journey grounded my leadership and fueled my passion to addressing the digital divide.
“After my work with AT&T, I deepened my understanding of education policy and philanthropy so that I understood all the systems that could prevent or propel girls’ STEM pursuit. My career path was the perfect combination to understand inequities through a lived experience; learn about the systems that perpetuate the barriers impacting our girls’ persistence toward STEM; and how investments propel solutions that will dismantle oppressive systems that are preventing us from truly realizing the full potential of a STEM revolution.”
Could you share what you found to be the biggest hurdle along the way?
“When we talk about STEM and girls, often the emphasis is on what our girls lack and the actual word STEM. But, our girls and STEM are not the issue. Remember, Science, Technology, Engineering and Math are disciplines and subject matters. STEM is not telling our girls they don’t belong, are not ready or uninterested. But, our girls are being asked to show up in a place that doesn’t embrace and value their unique experience and brilliance through her lens versus a white male dominant lens. Why would a girl show up if she can’t be her full self? The challenge is that we—adults, systems and structures—get in our girls’ way in their desires to pursue STEM. It’s making sure educators can deliver equitable STEM programming that is relevant and relatable to the experiences and gifts that our girls bring; it’s about galvanizing a support network of folks that influence, encourage and advocate for our girls during their journey—from families to STEM professionals; and it’s about the public discussion: do our policies, practices and institutions really understand what it takes to support girls and does it elevate all girls’ voices, not just those who have access and privilege? So, the hurdle is around what we emphasize on trying to improve this challenge.”
Is there a particular organization or initiative that you would recommend supporting that is working to support girls considering STEM fields and/or is working toward better representation of women in STEM?
“Techbridge Girls (TBG) is a national nonprofit organization that has been around for 21 years. Its mission is to create access to equitable STEM education that centers our girls’ experience, culture and brilliance so they understand they belong in this field from an early age and can thrive in it once they get there. TBG provides a space for girls to own STEM versus waiting for an invitation to be part of it. Our work is focused on the ecosystem (educators, role models, families) around our girls because we know girls have never been the issue in pursuing STEM. We create this space by equipping educators so they have the tools and practices to support this atmosphere of belonging, which will fuel girls’ pursuit into the field. TBG’s work motivates me because I believe that STEM can become an equalizer when it is seen as an economic and social justice imperative. When you let girls thrive in these fields, not only do they create a better future for themselves, but a better industry and a better world for us all.”
Visit TechbridgeGirls.org to donate and/or connect for volunteer opportunities.
Colleen Zaccard, PhD
Research Assistant Professor, Feinberg School of Medicine, Deptartment of Physiology; Chair, Chicago Women in STEM Initiative, Northwestern University

Image courtesy of Colleen Zaccard, Ph.D.
What encouraged or inspired you to pursue working in STEM?
“I was inspired to become a scientist as a young kid reading stacks of my dad’s science fiction novels, which gave me a sense of how advances in science and technology could reshape the world.”
Could you share what you found to be the biggest hurdle along the way?
“The biggest hurdle I have faced has been gender bias, which is often unconscious and creates an environment where women feel like they don’t belong and, therefore, continually need to prove themselves.”
Is there a particular organization or initiative that you would recommend supporting that is working to support girls considering STEM fields and/or is working toward better representation of women in STEM?
“I would highly recommend for early-career women in the Chicago area to participate in the Chicago Women in STEM Initiative. Our mission is to build an inclusive, self-sustaining community composed of Chicago-area students, postdoctoral scholars, and professionals to support gender equity, diversity, and the success of local women in STEM. We organize an annual symposium on International Women’s Day, as well as a monthly, cross-career level mentoring program—STEM Circuits—which is free for everyone!”
Reach out to Chicago Women in STEM for information on their programs and resources, as well as opportunities to contribute.
Megumi Fuse, Ph.D.
Director of Student Enrichment Opportunities & Professor, Department of Biology, San Francisco State University
What encouraged or inspired you to pursue working in STEM?
“I was a serious classical musician (cello) because our music teacher (male) was very dynamic and my family consists of many musicians. But then, in my last year of high school, I had this very dynamic female biology teacher and that’s when I realized I preferred studying over practicing. I switched majors before going to university.”
Could you share what you found to be the biggest hurdle along the way?
“I started my PhD in a lab where the professor was very busy and did not really have enough time to devote to his lab. So, I was unhappy. I depend on strong lab interactions to enjoy the science, so after two years, I quit and started again. Best move I could make. I was so much more focused, started getting fellowships, and I suspect I would have taken longer with my first PhD if I’d stayed.”
Is there a particular organization or initiative that you would recommend supporting that is working to support girls considering STEM fields and/or is working toward better representation of women in STEM?
“NexGeneGirls and Girls Who Code are both amazing. NexGeneGirls also really focuses on BIPOC women. Another could be EYH (Expanding Your Horizons) that is a conference for middle school girls.”
Visit NextGeneGirls and GirlsWhoCode to donate and/or connect for other opportunities to offer support.
EYH (Expanding Your Horizons) conferences are one-time group events made possible by Techbridge.org and a network of volunteer-led groups. The one-day conferences seek to expose girls to broad STEM content and careers; support positive STEM identity (3); and create a community through which girls continue their STEM engagement. So far, the network has produced both virtual and in-person STEM conferences in 11 states for roughly 7,000 middle school girls each year.
Methodology
Choosing the cities
We assigned composite scores based on 12 metrics (which were grouped into three categories) to U.S. urban centers with populations of 200,000 or more. Population totals considered for city selection are according to U.S. Census Bureau estimates for 2019. This criterion was not factored into the scoring system. All data was sourced from the U.S. Census Bureau. The most recent information available pertaining to the metrics considered for the purposes of this article is dated 2019. Data scored for each metric is at the city level.
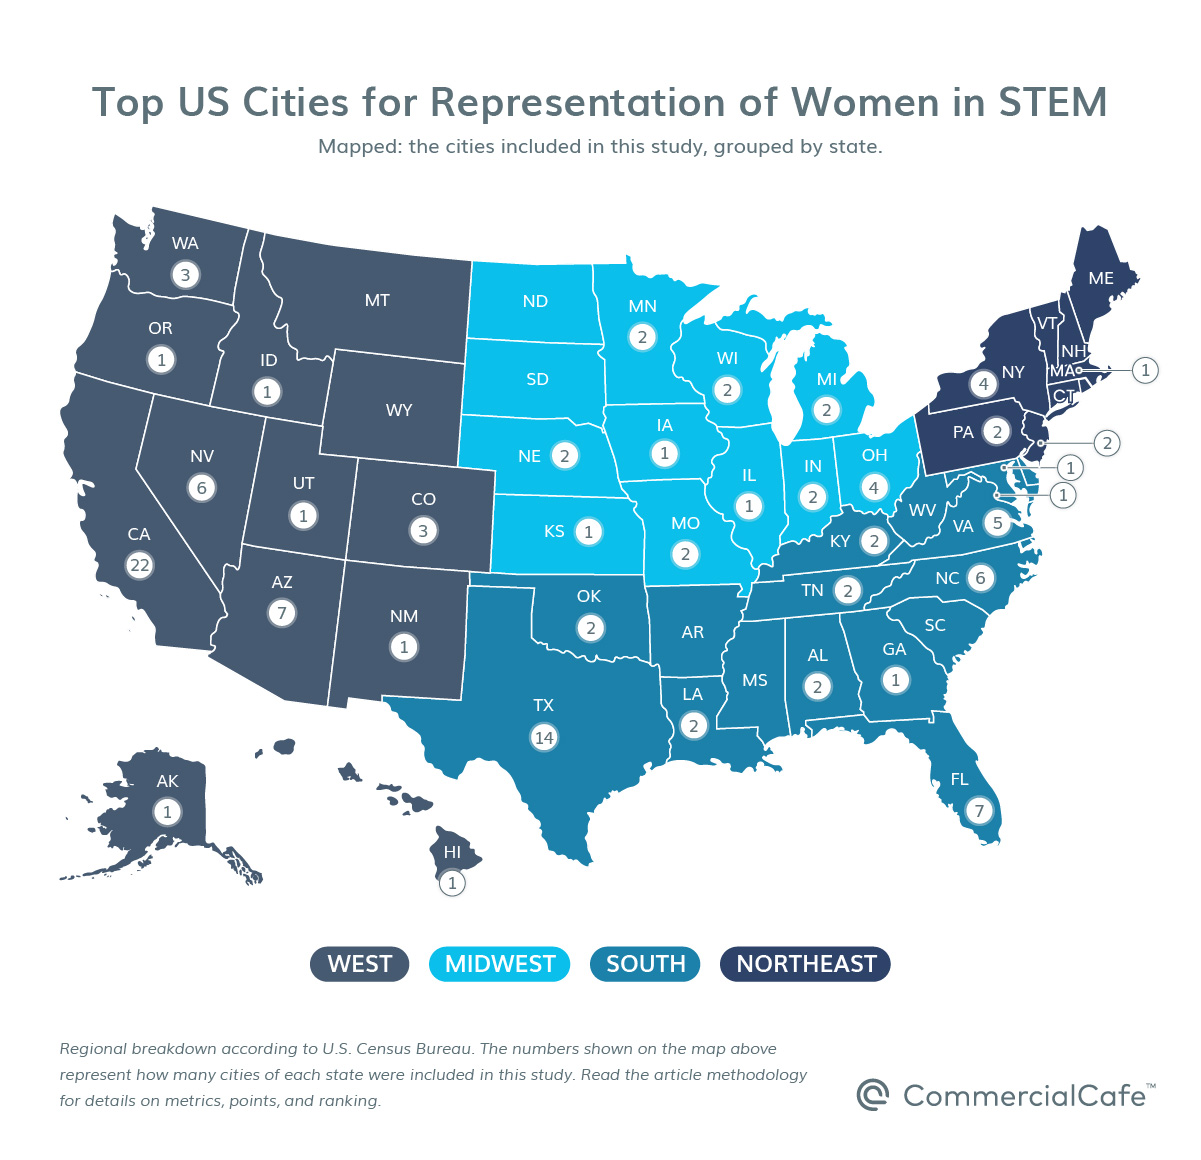
- Western U.S. states: Alaska, Arizona, California, Colorado, Hawaii, Idaho, Montana, Nevada, New Mexico, Oregon, Utah, Washington, and Wyoming.
- Midwestern U.S. states: Illinois, Indiana, Iowa, Kansas, Michigan, Minnesota, Missouri, Nebraska, North Dakota, Ohio, South Dakota, and Wisconsin.
- Southern U.S. states: Alabama, Arkansas, Delaware, Florida, Georgia, Kentucky, Louisiana, Maryland, Mississippi, North Carolina, Oklahoma, South Carolina, Tennessee, Texas, Virginia and West Virginia, in addition to Washington, D.C.
- Northeast U.S. states: Connecticut, Maine, Massachusetts, New Hampshire, New Jersey, New York, Pennsylvania, Rhode Island and Vermont.
There are 120 U.S. cities included in the full ranking, which you can view in detail by visiting the interactive table below.
Metrics, Scores & Points
For each metric, the number of maximum points was evenly distributed between the lowest and highest metric values within the group. On this scale, a score was calculated for each city based on its metric values. For all indicators, the number of points awarded is directly proportional to the metric values. Each city’s overall score was calculated by adding the scores for each metric. The factors (metrics) on which we based the composite scores are explained below.
Local STEM Employment Sector
Metrics grouped in this category totaled a maximum of 10 points and were distributed as follows:
- The STEM employees 2019 metric refers to the number of STEM jobs out of the total number of local jobs. The maximum weight for this metric was three points.
- To gauge the evolution of the STEM employment sector in each city, we compared 2015 employment data with 2019 employment data. The value scored represents the change (either positive or negative) in the number of STEM jobs for each city. The maximum weight for this metric was three points.
- STEM % of local employment represents the percentage of STEM occupation jobs out of the total of all jobs for each city. The maximum weight for this metric was two points.
- To gauge the evolution of overall STEM jobs in each city, we compared 2015 employment data with 2019 employment data. The value scored represents the change (either positive or negative) in percentage points of the share of STEM occupations jobs for each city. The maximum weight for this metric was two points.
Representation of Women in the Local STEM Sector
Metrics grouped in this category totaled a maximum of 10 points and were distributed as follows:
- The women STEM employees 2019 metric refers to the number of STEM jobs held by women out of the total number of local STEM jobs. The maximum weight for this metric was three points.
- To gauge the evolution of women’s employment in the local STEM sector, we compared 2015 employment data with 2019 employment data. The value scored represents the change (either positive or negative) in the number of female STEM employees for each city. The maximum weight for this metric was three points.
- For women % of STEM jobs we calculated the percentage of female employees out of the total number of employees in STEM occupations, per 2019 Census information. The maximum weight for this metric was two points.
- To gauge the change in local representation of women in STEM jobs, we compared 2015 employment data with 2019 employment data. The value scored represents the change (either positive or negative) in percentage points of the representation of women in STEM occupations jobs for each city. The maximum weight for this metric was two points.
Local STEM Income
Metrics grouped in this category totaled a maximum of 10 points and were distributed as follows:
- Values scored for median earnings represent the median annual income of residents who work in STEM occupations, as available in the most recent Census data. The maximum weight for this metric was three points.
- To gauge the change in local STEM wages over five years, we compared 2015 income data with 2019 income data. The value scored represents the percentage change (either positive or negative) of median annual earnings in STEM for each city. The maximum weight for this metric was two points.
- Values scored for women in STEM median earnings represent the median annual income of female residents who work in STEM, as available in the most recent Census data. The maximum weight for this metric was three points.
- To assess the change in local women STEM workers’ median annual earnings over five years, we compared 2015 income data with 2019 income data. The value scored represents the percentage change (either positive or negative) of women’s median annual earnings in STEM for each city. The maximum weight for this metric was two points.
Connect STEM Talent and Activities with Coworking Spaces Across the Country
If you are a founder looking to start or expand your own STEM enterprise for business, education, or otherwise, consider the networking and growth possibilities that your local coworking providers can offer! Find your best shared space match among the following links, or go to the CommercialCafe homepage to research options in other locations: coworking space in Manhattan or coworking space in Brooklyn; coworking space in Houston; coworking space in Dallas; coworking space in Denver; coworking space in Austin; coworking space in Phoenix; coworking space in Miami; coworking space in Irvine; coworking space in Las Vegas.
Additional References
(1) McKinsey Global Institute report on “The future of work in America: People and places, today and tomorrow,” released July 2019.
(2) Bloodhart B, Balgopal MM, Casper AMA, Sample McMeeking LB, Fischer EV (2020) Outperforming yet undervalued: Undergraduate women in STEM. PLoS ONE 15(6): e0234685. https://doi.org/10.1371/journal.pone.0234685
(3) McKinnon, M., O’Connell, C. Perceptions of stereotypes applied to women who publicly communicate their STEM work. Humanit Soc Sci Commun 7, 160 (2020). https://doi.org/10.1057/s41599-020-00654-0


Ioana Ginsac
Senior Content Writer, Industry News & Reports
Ioana is a content writer who has been covering all-things-CRE (and more) for several Yardi network publications since 2017. You will find her byline regularly in industry news and market reports, but also on articles covering sustainable development, green urbanism, and innovation, all of which she has been passionately learning about for more than a decade. Her work has been referenced by publications including AmericanInno, Bisnow, BusinessInsider, Commercial Property Executive, Curbed, Fast Company, Forbes, GlobeSt.