According to data analyzed by the National Girls Collaborative Project, women account for roughly half of the total college-educated workforce in the U.S., yet they’re represented in only 28% of science and engineering jobs. Furthermore, within the range of STEM occupations, women tend to be more concentrated in social sciences and in agricultural, biological and environmental life sciences; here, the share of female job holders exceeds 45%. And, much like the female workforce, activity in industries pertaining to these fields is unevenly distributed across the country. Consequently, as graduate education in STEM fields look to improve effectiveness and inclusion—and more women are inspired and supported to pursue such career paths—CommercialCafe™ set out to determine the current top U.S. cities for women working in STEM.
Contents Shortcuts
Scope
While most of the cities highlighted in this article are roughly similar in size, some are outliers by a wide margin. For instance, cities like Washington, D.C., San Francisco, New York City, Philadelphia, Houston, and Chicago are significantly larger than other cities in their respective ranking categories. Granted, larger U.S. cities attract professionals in a wide variety of industries—including STEM—to make a life there.
Meanwhile, smaller U.S. cities offer their own convincing advantages—and actually outperform large, urban areas in some respects. In reality, many of the metrics that influence decisions of where to work and live in the U.S. tend to be related to personal preferences and are, therefore, immeasurable on a wide scale. Subsequently, because our analysis did not track lifestyle factors nor factor population totals into the scores, we opted to preserve all entries.
Rather, to gauge the degree of representation of women in STEM occupations, we looked at the share of female employees out of the total number of local employees in STEM occupations, as well as how that share has changed over time in each city. In order to put that metric into a comparable perspective, we also included the percentage of STEM jobs out of the total number of jobs in each city.
Moreover, in order to gauge economic incentives and estimate discretionary income, we also:
- reviewed data on the median incomes of female STEM employees in each city
- compared average local rents to the female STEM workers’ median incomes
- tracked the change in each city’s female STEM workers’ median earnings during the previous five years
In addition, we also considered:
- the local share of women in management positions across all occupations
- the percentage of women who have healthcare through their employer
- the local unemployment rate for women
These are potential indicators of the likelihood that the local economy and business environments are inclusive of women.
Finally, of the college-educated population of each city, we also examined the share of women who hold at least a bachelor’s degree. This is a way to estimate the scale of the local, like-minded community.
Read on to see which urban centers ranked best nationally and regionally, as well as which metrics were the strongest for each entry.
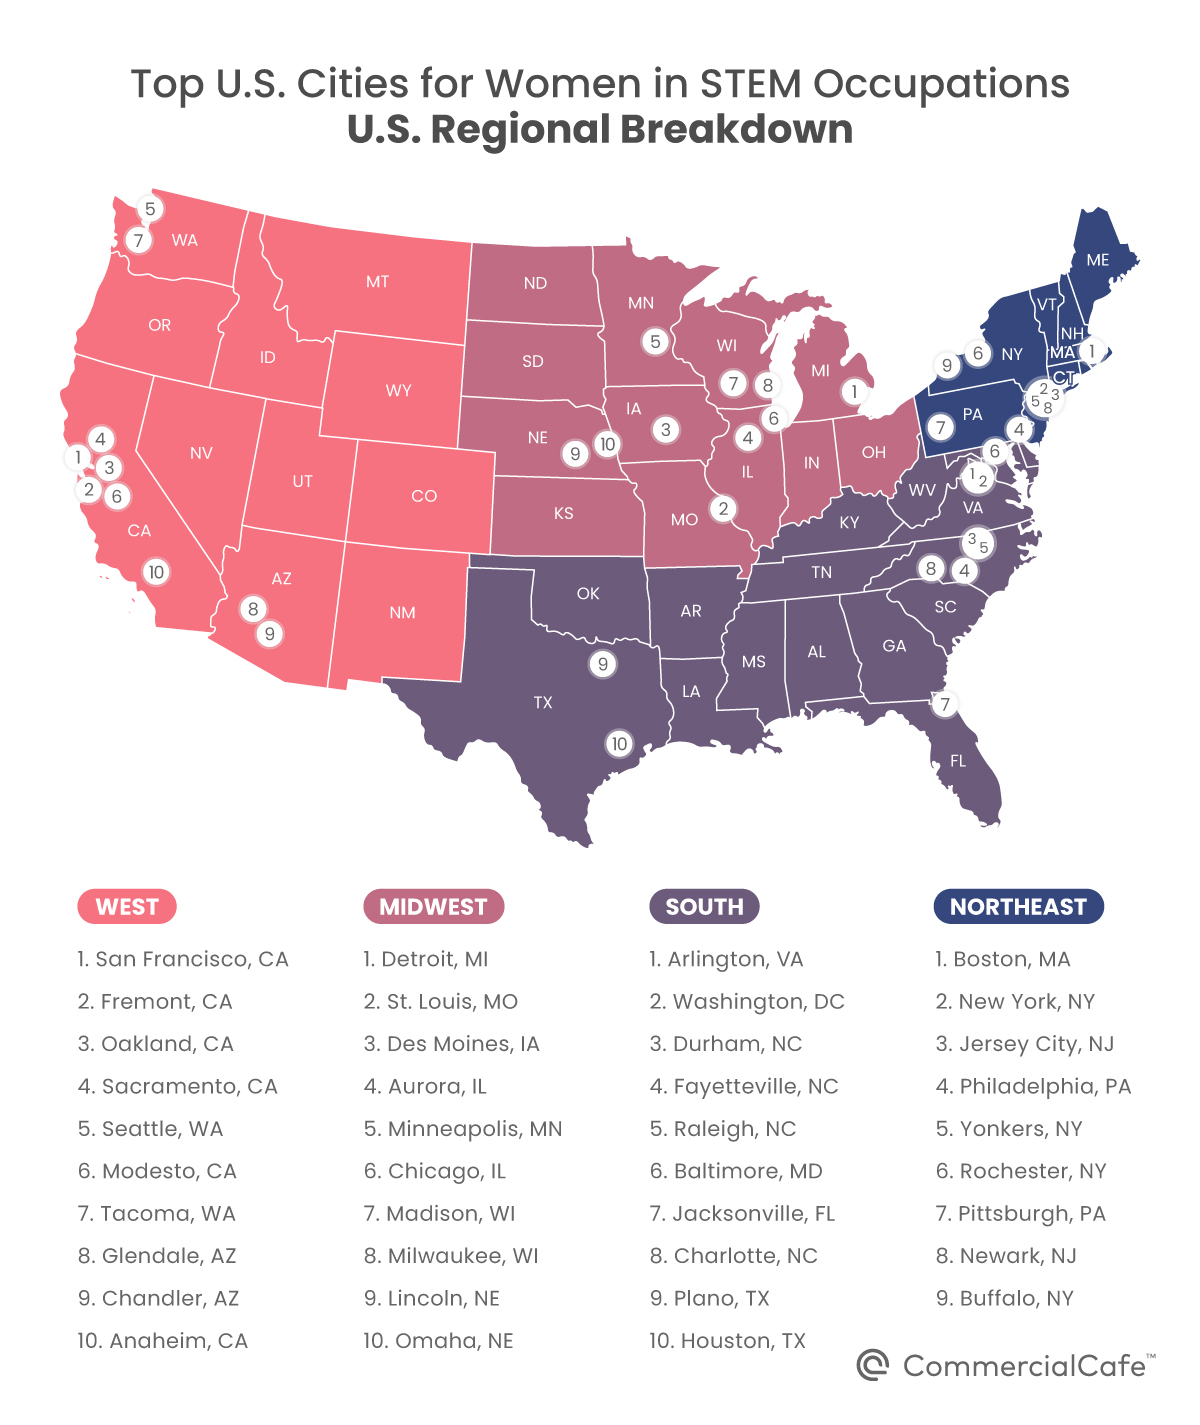
Top U.S. Cities for Women Working in STEM Are in West, South Regions
Arlington, Va., achieved the best overall score in our ranking—57.6 total points out of 100. The data we analyzed showed that the STEM workforce here accounted for 15% of total local jobs, which placed Arlington third for the size of the STEM sector within the local economy. In particular, between 2014 and 2018, Arlington saw an increase of three percentage points for female STEM employees; in 2018, they held 34% of local STEM jobs. During the same five-year interval, the median income for female STEM workers rose a modest 4% in the city, settling at just more than $85,000 in 2018.
Notably, Arlington also ranked first for women’s access to health insurance—79% of working women in the city are ensured through their employer. Arlington also recorded the lowest rate of unemployment for women—2% in 2018.
San Francisco earned a total score of 57.5 points for a very close second in our national ranking. Its strongest suits were its earnings metrics, for which it ranked second-highest among the cities on our list. Specifically, the median earnings of female STEM workers living in San Francisco experienced the second-largest five-year increase in our study at 45%. In fact, the city is one of only two on our list in which the median income of female STEM employees exceeds $100,000 per year. (The other city is also located in California and earned the third-best score on our list.)
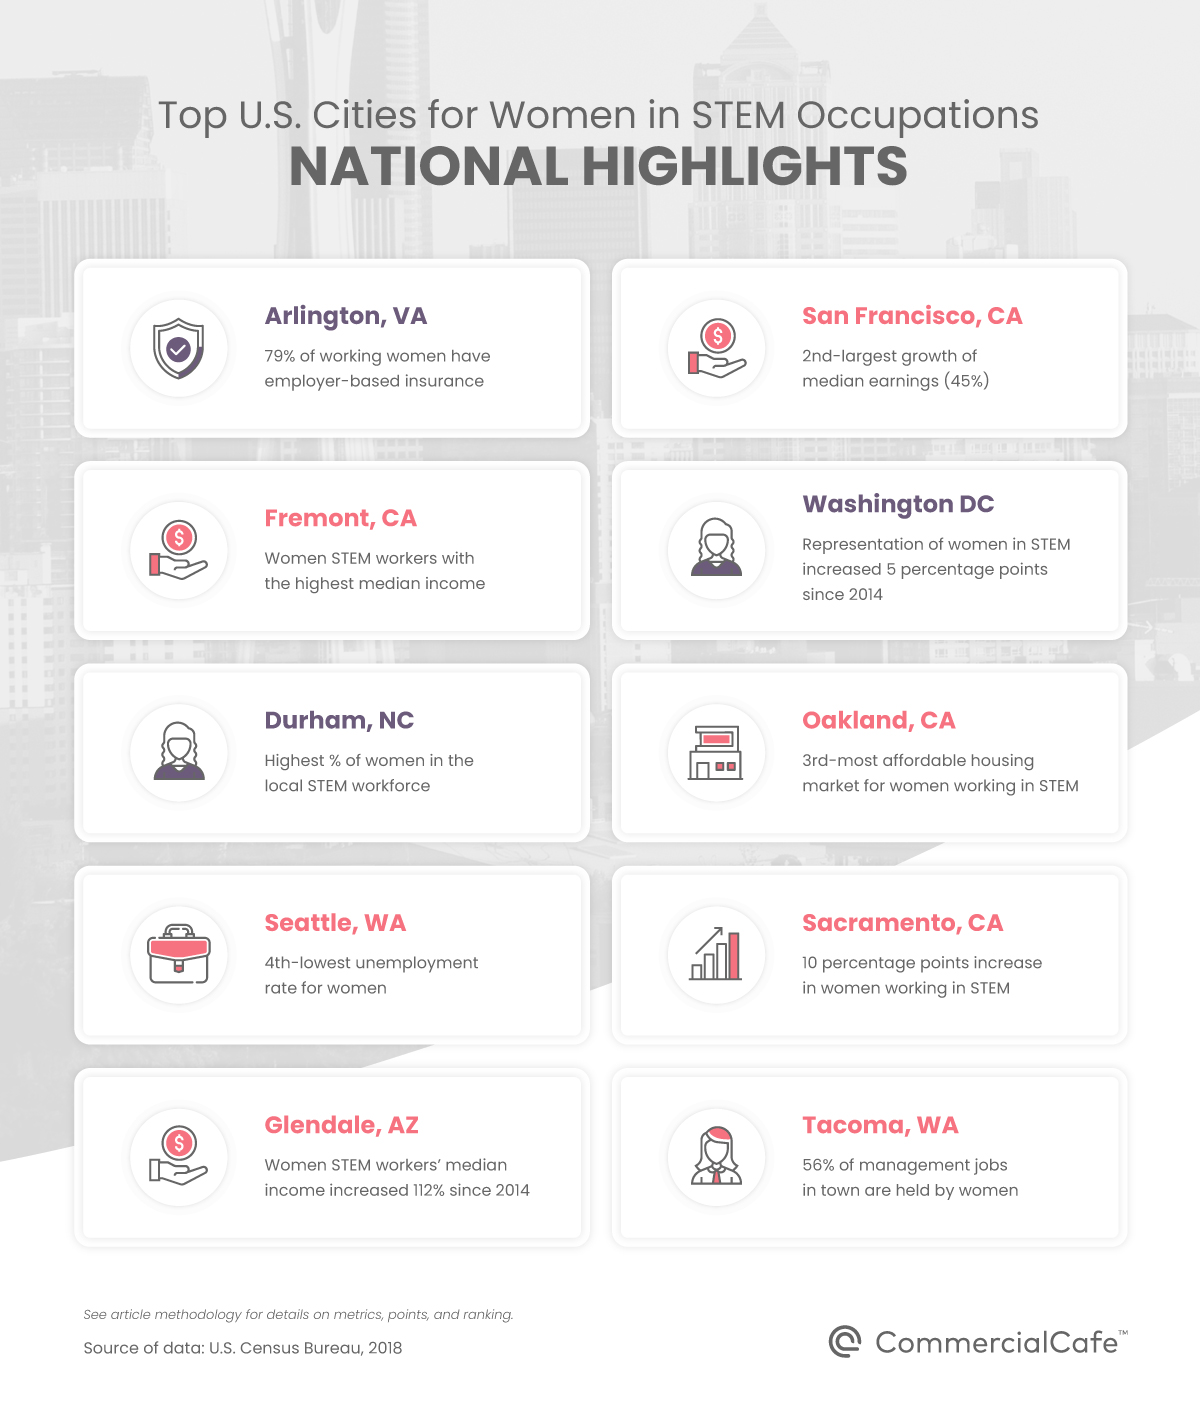
Fremont came in third overall, with a total score of 56.7 points. Nearly 30% of the city’s jobs are in a STEM field, 24% of which are held by women. Between 2014 and 2018, Fremont saw the fourth-highest increase—21%—in median wages for women working in these industries. Following that five-year improvement, female STEM employees in Fremont were earning the highest median income out of all of the cities on our list—$101,341. What’s more, the strong, local drive to encourage girls to consider education and career paths in engineering is also visible in supportive local partnerships—like the Tesla and Envirolution workshops, as well as hands-on engineering activities organized in honor of Introduce a Girl to Engineering Day in 2019.
Washington, D.C. landed in fourth with a total score of 55.7 points. The city boasts an impressively diverse economy in which 12% of jobs are STEM occupations, 42% of which are held by women. This placed D.C. and Durham in a tie for first place for degree of representation of women in STEM. Not to be overlooked, the capital is also home to the fifth-highest median income nationwide for female STEM workers, following Arlington and just ahead of Oakland. The city also ranked well for rent to STEM income ratio, as the local average rent accounts for roughly 22% of the median income of female STEM workers who live here.
Durham scored a total of 53.8 points and came in fifth. Of the cities we researched for this ranking, Durham ranked highest for the percentage of women in the local STEM workforce—42%, according to 2018 U.S. Census Bureau data. STEM industries account for 10% of the total employment in Durham. As an integral part of the Research Triangle Park and home to heavily STEM-oriented educational and research institutions, it was hardly a surprise that the city ranked best for women’s overall educational attainment—57% of college-educated residents are women. While the median income of local female STEM workers increased 15% between 2014 and 2018, the final earnings value ranked tenth on our list. However, data showed that this income stretches further in Durham than in other urban centers; the city ranked second for its rent-to-median-income ratio, with the local average rent accounting for 21% of the median earnings of women working in STEM.
Oakland—in sixth place overall—ranked third for educational attainment; here, women make up 56% of the local college-educated population. The average rent here is roughly 22% of women STEM workers’ median income.
In Seattle, 17% of jobs are in STEM occupations and women occupy 30% of them. Additionally, the city ranked third for access to healthcare, with 68% of women insured through their employer. Only 3.6% of local women were unemployed in 2018, which gave Seattle the fourth-best unemployment rate. Sacramento came in eighth overall. California’s state capital’s strongest suits were its increase in representation of women in STEM—which improved 10 percentage points between 2014 and 2018—and its third-place ranking for the representation of women in the industry workforce; 41% of STEM jobs in Sacramento are held by women.
Glendale received the most points for housing affordability out of all of the cities on our list. In 2018, the average rent here accounted for just 13% of the median income for female STEM workers. The Arizona city also ranked highest for growth in earnings; from 2014 to 2018, median earnings increased 112% for female STEM employees. The 2018 median value of roughly $90,500 in annual income placed Glendale third for this metric, behind only Fremont and San Francisco. However, it’s worth noting that during the same five-year interval, the percentage of local STEM jobs that were occupied by women decreased by 14 percentage points, resting at 24% in 2018.
Tacoma rounds out the top 10, with a total score of 51.2 points. Here, the STEM sector accounts for 5% of local jobs, and the percentage of women occupying these jobs increased by 15 percentage points since 2014. This was the highest growth recorded among the cities on our list and brought the degree of local STEM representation of women up to 35% in 2018. Tacoma also ranked second for educational attainment, with women accounting for 56% of the college-educated population. It’s also worth noting that the city took the lead on the women in management index; 56% of total local management positions are held by women.
Top U.S. Cities for Women Working in STEM – Regional Breakdown
In the west, San Francisco earned the highest score for women working in STEM, followed by Fremont in second place and Oakland in third. In the midwest, Detroit scored the best with a 2.5-point lead ahead of St. Louis, which was followed by Des Moines in third place. In the southern region, Arlington’s score ranked highest on our list for women working in STEM. Washington, D.C. landed a close second, followed by Durham in third place. In the northeast, Boston took the lead, followed by New York City and Jersey City.
Check out the following sections for details on which other U.S. cities stood out on a regional level.
Top Western U.S. Cities for Women Working in STEM
Western U.S. urban centers dominate the national ranking. In fact, you may notice that seven of the entries included in the regional selection here also earned spots among the top 10 U.S. cities for women in STEM occupations.
Modesto came in sixth within this group. The Central Valley city scored third-best for housing affordability; the average local rent accounts for roughly 20% of the median income for female STEM employees, which was about $70,000 in 2018. Modesto also ranked second for representation of women in the active STEM workforce with 41% of the local jobs being held by women.
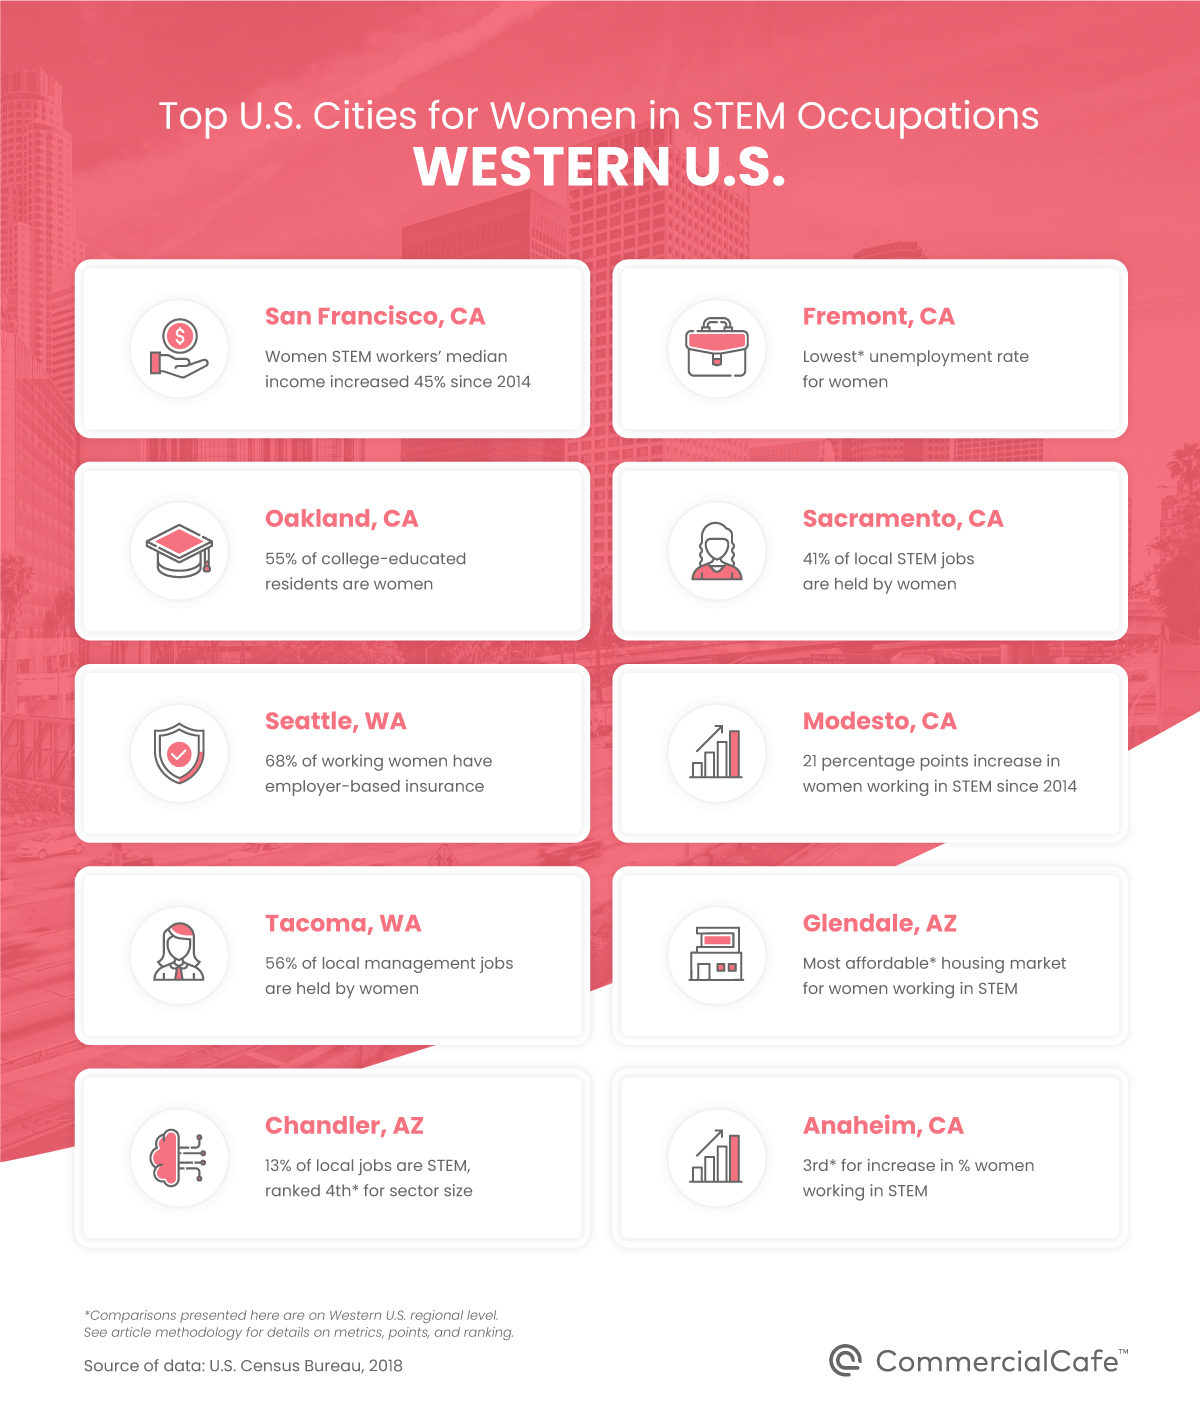
Chandler landed ninth-best western U.S. city for women working in STEM. The Arizona urban center has the third-lowest women’s unemployment rate in the region, and the third-highest percentage (67%) of female employees who have access to healthcare coverage through their employer. The STEM sector in Chandler accounts for 13% of local jobs, 26% of which are held by women.
Wrapping up the western U.S. regional top 10 is Anaheim, which scored fairly well on the educational attainment and STEM sector indices. Here, women account for 52% of the local college-educated population and hold 40% of management jobs. In addition, the city’s STEM sector accounts for 4% of the area’s total jobs, of which 35% are occupied by women. It’s also worth noting that the share of women working in these industries increased 12 percentage points between 2014 and 2018, placing Anaheim third for this metric.
Top Midwestern U.S. Cities for Women Working in STEM
Detroit’s final score is the result of a uniquely mixed bag of highs and lows. The city ranked highest within this group for five of the 10 metrics we analyzed. Specifically, women account for 62% of college-educated residents here, and 56% of management jobs in town are held by women. Next, between 2014 and 2018, the degree of representation of women in STEM fields increased 19%—the largest absorption in the region. During the same interval, the median income of female STEM workers living in Detroit recorded the largest increase in the midwestern U.S. at 45%. Last, but not least, in 2018, women occupied 49% of STEM jobs in Detroit.
However, for the other five metrics, Detroit’s scores ranked ninth and 10th on a regional level. For instance, the median earnings of female STEM workers—just above $42,000—ranked 10th in the region. Similarly, the city came in ninth for housing affordability, with average local rents accounting for roughly 24% of the median income value. While the city ranked high for its metrics of women’s representation in STEM employment on a local level, these industries account for just 3% of the total jobs in the city, landing Detroit in 10th place for local STEM sector size, as well. Likewise, of the total number of working women in the city, only 37% have employer-based insurance—ranking 10th in the region for coverage. Lastly, Census data shows that the local unemployment rate for women is 12%, placing the city 10th for this metric, too.
Despite these and other challenges that Detroit has faced over the last few years, its resilient spirit remains unbroken. As a matter of fact, Motown is one of the Rust Belt’s most successful comeback stories, having reinvented itself as a hub for innovation in STEM industries through several local initiatives. For example, in January, Wayne State University launched a $2.5 million program to curb the shortage of K-12 STEM teachers, as well as support a sustainable workforce. that focus on fostering skills to prepare the local workforce for 21st-century jobs. Moreover, the University of Michigan will operate a $300 million research and education center that will anchor the Detroit Center for Innovation; construction is slated to begin next year.
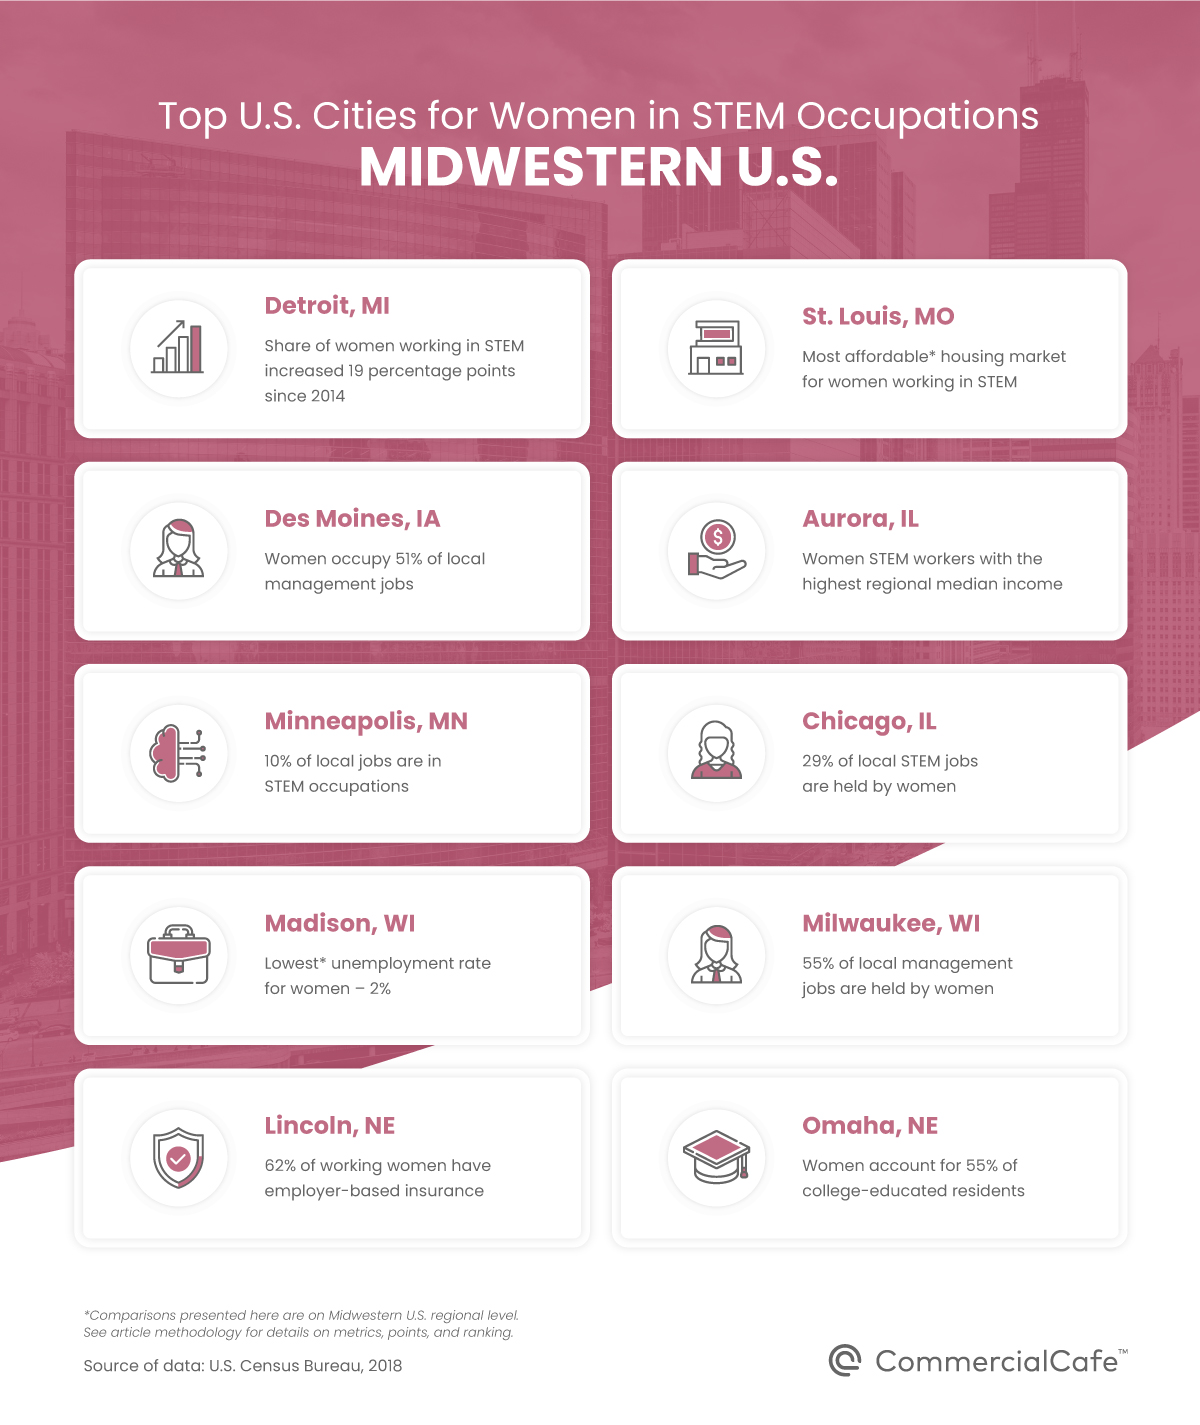
St. Louis’ STEM sector accounts for 8% of its local employment. Women hold 35% of these jobs, which put the city in second place on a regional level for its degree of representation of women in these fields. Meanwhile, the median income earned by female STEM employees living in St. Louis is the fifth-highest in the region. Of note, the city ranked best among the cities in this group for housing affordability; its average rent-to-median-income ratio is 17%.
Des Moines ranked third in the region for local representation of women in STEM industries (32%), as well as for representation of women in overall management jobs (51%). The city also ranked fairly well for labor force participation; the women’s unemployment rate here is the fourth-lowest among midwestern U.S. cities.
The highest regional median income of women working in STEM was recorded by the residents of Aurora. In fact, the city ranked second in this group for growth in earnings; between 2014 and 2018, the median income for Aurora’s STEM-employed female residents increased by 43%. Plus, with an average rent-to-median-income ratio of 18%, the city ties with Des Moines for third place in housing affordability.
The STEM sector in Minneapolis accounts for 10% of local jobs; 28% of these jobs are held by women, which placed the city sixth in the region for representation of women in STEM industries. The City of Lakes also ranked third for median earnings, and received the fourth-highest score for employee coverage—55% of local working women are insured through their employer.
Chicago—by far the largest city in this group—has a STEM sector that accounts for 6% of local jobs. Just under 30% of those jobs are held by women, and their median income ranked second-highest among midwestern U.S. cities, behind Aurora and just ahead of Minneapolis.
The STEM sector in Madison encompasses 13% of all local jobs, and women occupy 31% of it. What’s more, the Wisconsin capital has the lowest women’s unemployment rate in the region (2%), and the highest rate of working women with healthcare coverage—74% have access to insurance through their employer.
Milwaukee stood out among the top 10 cities in the region for housing affordability, educational attainment and representation in management. Specifically, here: the average rent accounts for 18% of the median income of female STEM workers; 56% of the college-educated population are female; and 55% of local management jobs are held by women.
Lincoln and Omaha rounded out the midwestern top 10. In each of the two Nebraska cities, 7% of local jobs are in STEM occupations, and women hold 27% and 26% of those jobs, respectively. The cities also share similarities in: housing affordability—average rent accounts for just under 20% of the median income in each; low unemployment rates for women—a metric for which Lincoln ranked second and Omaha third; and educational attainment, with women accounting for more than 50% of the local college-education population.
Top Southern U.S. Cities for Women Working in STEM
Three southern U.S. cities—Arlington, Washington, D.C. and Durham—earned total point scores that placed them among the top 10 cities nationwide for women working in STEM. Joining them on a regional level, four of the top cities hail from North Carolina and two are from Texas—Plano and Houston—as well as Baltimore, Md., and Jacksonville, Fla.
North Carolina is home to a month-long, state-wide science festival—a dedicated celebration of the educational, cultural and financial benefits of STEM in the state. Therefore, it was not a surprise that it’s also home to four of the 10 top southern U.S. cities for women working in STEM. In this regional ranking, Durham is followed by Fayetteville, which ranked seventh-best for representation of women in industry occupations. Plus, the city ranked the best in the group for overall representation in leadership, with 53% of local management jobs held by women. Furthermore, women account for 58% of the college-education population, which placed Fayetteville first for educational attainment, as well.
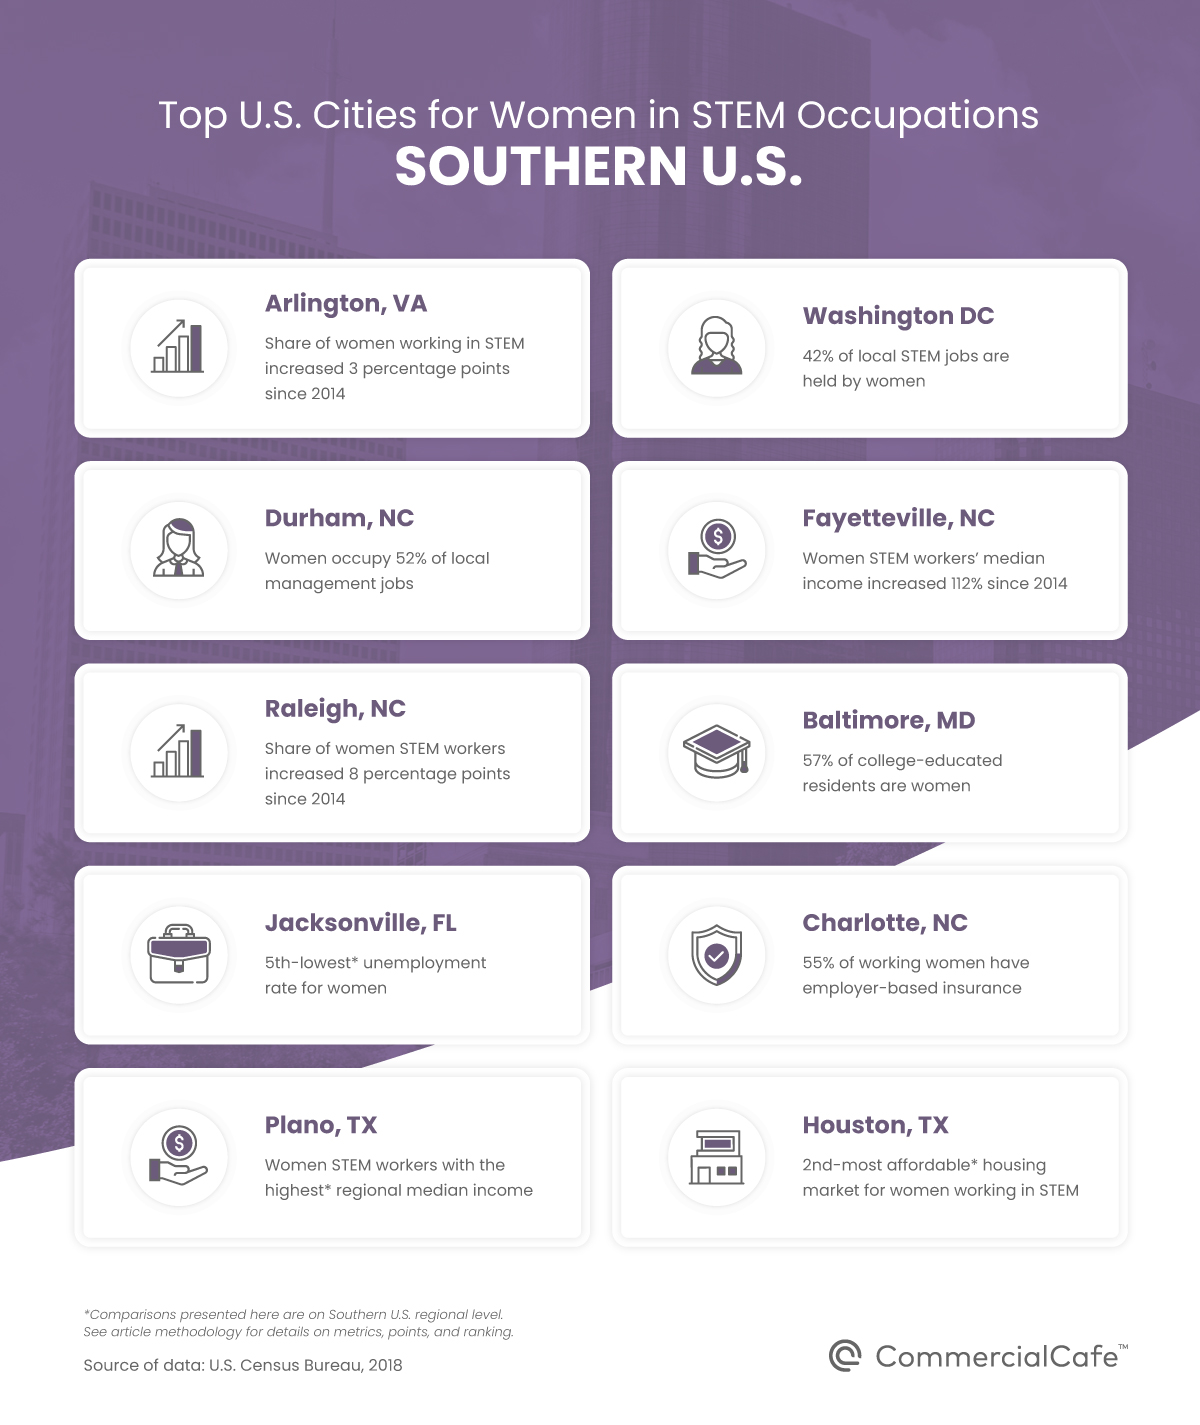
Raleigh boasts the: second-lowest women’s unemployment rate in the region, following only Arlington; third-highest rate of coverage, with 64% of working women covered by employer-based insurance; and fourth-best rate of women’s educational attainment—55% of college-educated residents are women. Along the same lines, between 2014 and 2018, the share of women occupying local STEM jobs increased by 8 percentage points, which was the largest growth of representation in the region. The STEM sector in Raleigh accounts for 10% of local jobs, 35% of which are held by women.
The fourth North Carolina entry is Charlotte. Queen City earned its best scores for its increase in median earnings—49% between 2014 and 2018 (which was the second-highest growth in the region)—and a rent-to-median-income ratio of 20%, ranking fourth for housing affordability.
Baltimore’s best scores were for educational attainment (women account for 57% of college-educated residents) and representation in leadership (53% of management jobs in the city are held by women). STEM occupations account for 8% of all local jobs, and women occupy 35% of these.
Jacksonville has a slightly smaller STEM sector, encompassing just 5% of the total local jobs, but it also has slightly better representation, with 36% of those jobs being held by women. Plus, participation in the local STEM workforce increased by four percentage points between 2014 and 2018, placing the Florida city third in the group for this metric.
The North Texas city of Plano is home to the female STEM workers with the highest median income in the region—$87,910. Here, 13% of local jobs are in STEM occupations, and women hold 22% of them. Likewise, the city ranked second-best in the region for access to health care coverage, with 65% of local working women being insured through their employer. The second Texas entry on the list landed in the 10th spot in the southern rankings. Houston—decidedly the largest city in the group—ranked second for housing affordability, as well as for growth in representation in the workforce. Following an increase of five percentage points in the share of women working in industry occupations, Houston’s STEM sector is now 30% women.
Top Northeastern U.S. Cities for Women Working in STEM
Boston earned the highest score among northeastern U.S. cities. The city’s STEM sector encompasses 9% of all local jobs. With 37% of those jobs being held by women, Boston ranked first in the region for its representation in the industry. Furthermore, women STEM workers living in the city have the fifth-highest median income in the region. But, with average local rents accounting for roughly 32% of their income, Boston was also the least affordable city for housing among this group.
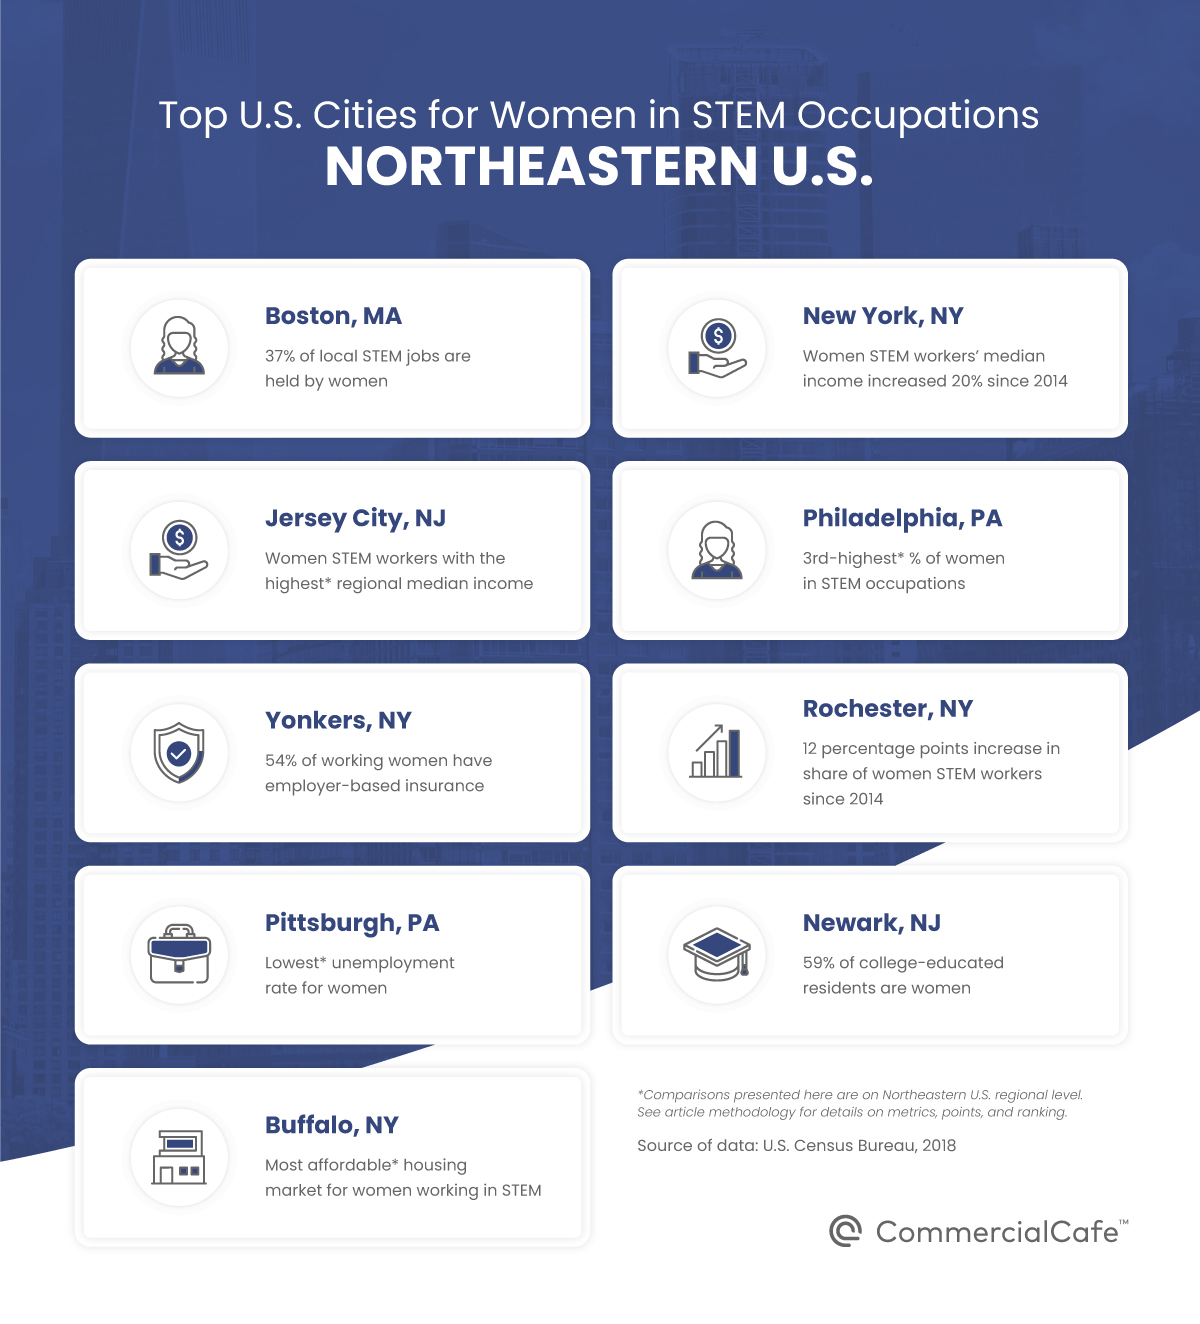
New York City earned the highest score of the four Empire State entries in this ranking. The city’s best scoring metrics were in median earnings, educational attainment and representation in the industry. Here, STEM occupations account for 5% of all of the city’s jobs, of which 30% are held by women. Notably, median earnings for women STEM employees living in New York City are the second-highest in the region. Additionally, the average rent accounts for roughly 23% of this median income, which landed NYC in fifth place among northeastern U.S. entries for this metric.
Yonkers, Rochester and Buffalo also ranked among the top cities for women working in STEM in the region. In fact, Rochester ranked second-best for representation in the industry, with women accounting for 36% of STEM jobs in the city. Local participation in leadership is also a strong suit for the city—59% of management jobs in town are held by women. Buffalo ranked best in the group for housing affordability with an average rent-to-median-income ratio of 19%. The city also earned fairly good scores for its overall educational attainment and low unemployment rate. Meanwhile, Yonkers ranked third-best for median earnings, housing affordability, educational attainment and working women’s access to healthcare coverage through their employer.
Jersey City is home to the largest local STEM sector, with industry occupations accounting for 13% of local employment; women hold 26% of these jobs. Likewise, female STEM employees living in Jersey City also have the highest industry median income in the northeastern U.S. region, slightly ahead of New York City. Newark—the second New Jersey city on the list—stood out for women’s participation in business management and leadership, with women occupying 59% of local management jobs. Newark also earned points for housing affordability; the average local rent accounts for roughly 20% of the median income of the STEM-employed female population.
Two Pennsylvania cities also made the cut. Philadelphia earned the fourth-best score among northeastern U.S. cities. The city’s strongest suits were female representation in STEM and in overall leadership: women account for 32% of local STEM jobs and hold 48% of management jobs in the city. Not to be outdone, Pittsburgh boasts the region’s lowest unemployment rate for women (4%), as well as the highest percentage of coverage—58% of the city’s working women have health insurance through their employer. What’s more, Steel City’s STEM sector accounts for 9% of all of the local jobs, 27% of which are held by women.
Methodology
Choosing the cities
We assigned composite scores based on ten metrics to U.S. urban centers with populations of 200,000 or more. Population totals considered for city selection are according to U.S. Census Bureau estimates for 2018, but this criterion was not factored into the scoring system. All data was sourced from the U.S. Census Bureau. The most recent information available, pertaining to the metrics considered for the purposes of this article, is dated 2018. Data scored for each metric is at the city level.
The U.S. cities included in the rankings presented above are: Anaheim, CA; Arlington, VA; Aurora, IL; Baltimore, MD; Boston, MA; Buffalo, N.Y.; Chandler, AZ; Charlotte, N.C.; Chicago, IL; Des Moines, IA; Detroit, MI; Durham, N.C.; Fayetteville, N.C.; Fremont, CA; Glendale, AZ; Houston, TX; Jacksonville, FL; Jersey City, N.J.; Lincoln, NE; Madison, WI; Milwaukee, WI; Minneapolis, MN; Modesto, CA; New York, N.Y.; Newark, N.J.; Oakland, CA; Omaha, NE; Philadelphia, PA; Pittsburgh, PA; Plano, TX; Raleigh, N.C.; Rochester, N.Y.; Sacramento, CA; San Francisco, CA; Seattle, WA; St. Louis, MO; Tacoma, WA; Washington, D.C.; Yonkers, N.Y.
For the regional breakdown of our analysis, we followed the U.S. Census region divisions, as follows:
- Western U.S. states: Alaska, Arizona, California, Colorado, Hawaii, Idaho, Montana, Nevada, New Mexico, Oregon, Utah, Washington, and Wyoming.
- Midwestern U.S. states: Illinois, Indiana, Iowa, Kansas, Michigan, Minnesota, Missouri, Nebraska, North Dakota, Ohio, South Dakota, and Wisconsin.
- Southern U.S. states: Alabama, Arkansas, Delaware, Florida, Georgia, Kentucky, Louisiana, Maryland, Mississippi, North Carolina, Oklahoma, South Carolina, Tennessee, Texas, Virginia, Washington D.C., and West Virginia.
- Northeast U.S. states: Connecticut, Maine, Massachusetts, New Hampshire, New Jersey, New York, Pennsylvania, Rhode Island, and Vermont.
Metrics, Scores, and Points
For each metric, the number of maximum points was evenly distributed between the lowest and highest metric values within the group. On this scale, a score was calculated for each city based on its metric values. This was done separately for each ranking: top nationwide cities, western U.S. cities, midwestern U.S. cities, southern U.S. cities and northeastern U.S. cities. The factors (metrics) on which we based the composite scores are explained below.
For rent-to-median-income ratio and for unemployment, the number of points awarded is inversely proportional to the metric values—the smaller the metric value, the higher the point score. For all other indicators, the number of points awarded is directly proportional to the metric values.
For women % of stem jobs we calculated the percentage of female employees out of the total number of employees in STEM occupations, as per 2018 Census information. The maximum weight for this metric was 20 points.
To gauge the change in representation of women in STEM jobs, we compared 2014 employment data with 2018 employment data. The value scored represents the change in percentage points (either positive or negative) of representation of women in STEM occupations jobs for each city. The maximum weight for this metric was 10 points.
STEM % of local employment represents the percentage of STEM occupation jobs out of the total of all jobs for each city. The maximum weight for this metric was 15 points.
Median earnings values scored represent the median income of female residents who work in STEM, as available in the most recent Census data. The maximum weight for this metric was 20 points.
To assess the change in women STEM workers’ median earnings over five years, we compared 2014 income data with 2018 income data. The value scored represents the percentage change (either positive or negative) of women’s median earnings in STEM for each city. The maximum weight for this metric was 10 points.
For data on women’s educational attainment on a local level, we looked at the number of female residents, aged 18 to 64, who held a bachelor’s degree or higher. We then scored their percentage out of the total local population who had attained higher education. The maximum weight for this metric was 5 points.
The women in management metric refers to the percentage of women occupying management positions out of the local total of management employees. The maximum weight for this metric was 5 points.
Rent/income ratio refers to the percentage of average rent for each city out of the median income of female STEM employees in that city. Values scored reflect 2018 U.S. Census data. The number of points awarded is inversely proportional to the metric value—the smaller the metric value, the higher the point score. The maximum weight for this metric was 5 points.
For scoring women’s access to health services, we looked at the percentage of women with employer-based health insurance out of the total female population for each city. The maximum weight for this metric was 5 points.
Unemployment values scored represent the 2018 unemployment rate for women across all occupations for each city. The number of points awarded is inversely proportional to the metric value—the smaller the metric value, the higher the point score. The maximum weight for this metric was 5 points.


Ioana Ginsac
Senior Content Writer, Industry News & Reports
Ioana is a content writer who has been covering all-things-CRE (and more) for several Yardi network publications since 2017. You will find her byline regularly in industry news and market reports, but also on articles covering sustainable development, green urbanism, and innovation, all of which she has been passionately learning about for more than a decade. Her work has been referenced by publications including AmericanInno, Bisnow, BusinessInsider, Commercial Property Executive, Curbed, Fast Company, Forbes, GlobeSt.