Rust Belt Cities Ranked: The Most Successful Comeback Stories


In 2016, Antoine van Agtmael and Fred Bakker, authors of “The Smartest Places on Earth: Why Rustbelts are the Emerging Hotspots of Global Innovation,” commented on the current state of industry in the U.S. They highlighted the fact that while many voices decry the bleak state of manufacturing in the country, very little is said about the rise of high-tech manufacturing jobs in many formerly industrial urban centers. Their role in fostering invaluable talent in highly lucrative and sought-after STEM fields has also been overlooked.
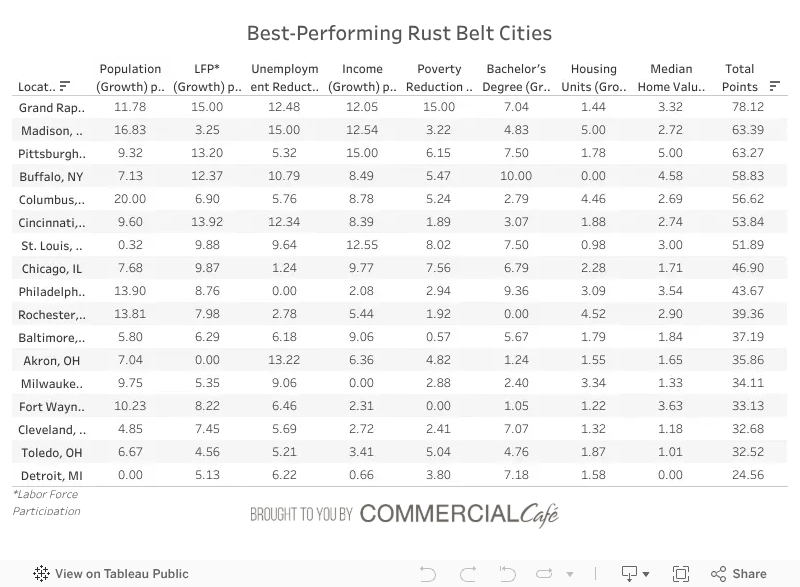
Documenting the resurgence of America’s Rust Belt is a highly complex endeavor, given the size of the area and the diversity of local conditions. Using data from the U.S. Census Bureau, this study aims to track the progress made by 17 of the most promising Midwestern and Northeastern cities in the decade after the financial crisis. As detailed in our Methodology, we awarded points for each city’s performance across the following indicators: population and income growth, unemployment and poverty reduction, increases in labor force participation (LFP), educational attainment levels, housing units and median home value.
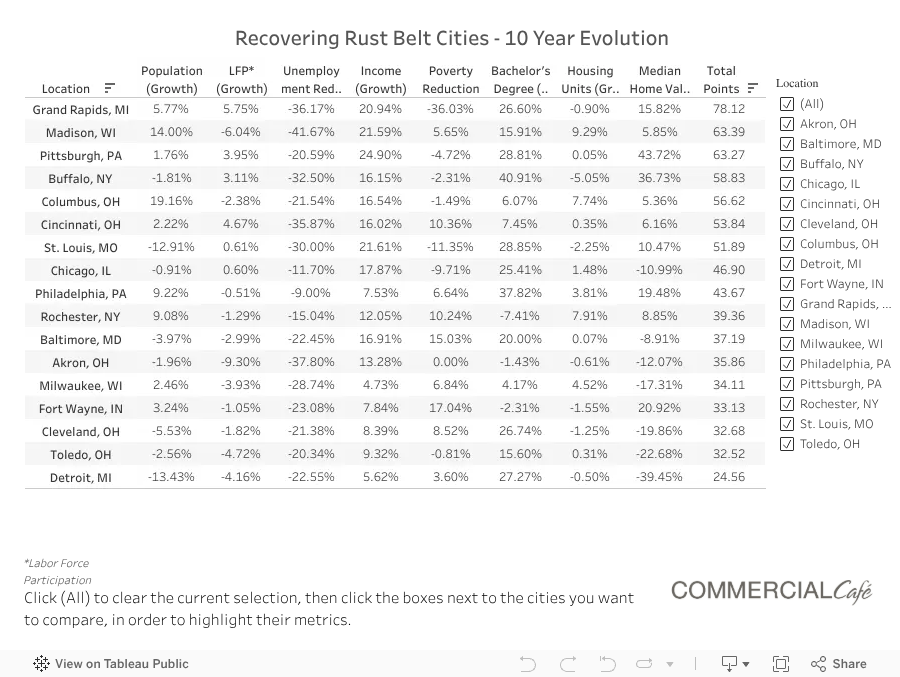
You can also use the tool below for a side-by-side city comparison of the percentage increase/decrease for each of the eight indicators.
Rust Belt cities face a wide range of challenges. While the region is home to some incredible talent, it still lags behind coastal urban areas in terms of its ability to attract investment. The fragmented nature of local government units often makes large infrastructure projects and collecting necessary taxes for upkeep difficult. Competition between cities within the same state or neighboring states leaves companies scrambling to secure local talent. Last but not least, the Rust Belt cities have to continue to diversify their local economies, replacing their dwindling manufacturing industry with everything from tech, to finance and healthcare services. Keep reading to see a breakdown of each of the 17 cities’ best-performing metrics or select a city from the list below for more details about its progress.
#1 – Grand Rapids, MI
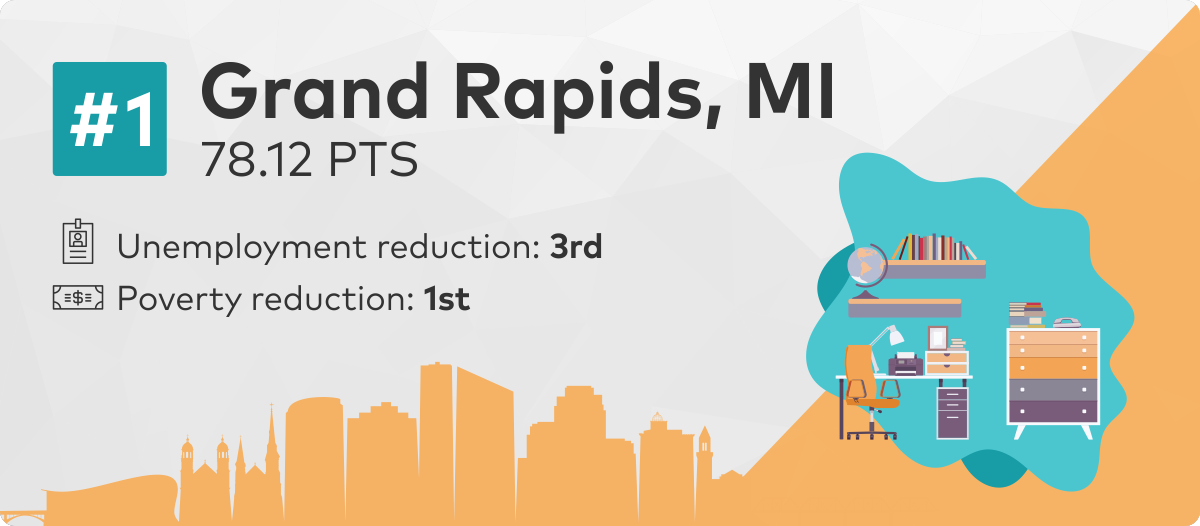
Grand Rapids took the first spot with 78 points, a 15-point lead ahead of the runner-up. It scored highest for both its labor force participation and its decrease in the overall poverty rate (15 out of 15 points for each). It also earned an above-average score for wage growth―with a 21% increase between 2008 and 2017―and its unemployment reduction (a 36% drop in the last decade). Encouragingly, the city’s share of millennials increased by 53% between 2000 and 2015.
Beer City garnered 12 out of a maximum of 20 points for its population growth with a 6% increase since 2008, which landed it in fifth place for this metric.. Moreover, having witnessed a 13% bump in its number of residents since 1950, Grand Rapids was one of only four cities in the study that grew its population during the last six decades (the other cities were Fort Wayne, Columbus and Madison).
While many Midwestern cities have been trying to recover from the devastating effects of decades of deindustrialization, Grand Rapids has emerged as a star in the Rust Belt’s comeback narrative, able to maintain a relatively solid manufacturing base despite major shifts in the global economy. With a nearly 21% share of manufacturing jobs, the city is the only one in the region that has more blue-collar jobs today than it did back in the 1990s. The city achieved this by diversifying its manufacturing base and attracting companies from various industries―including aerospace, medical, furniture and steel production. Also known as Furniture City, Grand Rapids has kept its role as the leading center of office furniture in the U.S., hosting prestigious companies such as Steelcase and Herman Miller.
In addition to its successful manufacturing industry, the city also has been carefully growing its healthcare, education and business sectors. A myriad of microbreweries and the famous ArtPrize festival have also boosted its national profile as a mecca for craft beer and art lovers.
#2 – Madison, WI

Madison came in second, totaling 63.3 points and outranking Pittsburgh. It performed exceptionally well in terms of unemployment reduction, with a 42% decrease for this indicator since the Great Recession.
Madison also grew its population by 14% since 2008, adding roughly 31,000 new residents; for this, it collected 17 out of 20 points, second only to Columbus. Those working in the City of Four Lakes saw their income levels grow by 22% in the last decade, with the current median wage resting at $65,072―the highest on our list.
The median home value in Madison is up by 6%, currently reaching $240,700, and the housing stock increased by 9%, adding roughly 10,000 new units between 2008-2017. In 2014, the city created its Affordable Housing Fund with a goal to build 1,000 affordable units in five years. It granted competitive tax credits to a couple of development projects that will add 131 affordable apartments to the market.
Madtown also has the highest percentage of college-educated workers of the 17 cities that made our list, with roughly 31% holding at least a bachelor’s degree. The city is home to companies such as Spectrum Brands, Credit Union National Association (CUNA), MGE Energy, American Family Insurance and National Guardian Life. Additionally, tech employers like Google, Microsoft and Zendesk have presences in Madison, which was also ranked as one of the top 10 cities for millennial entrepreneurs in 2018.
#3 – Pittsburgh, PA

Pittsburgh received 15 out of 15 points for its income growth, the highest increase on the list. Its current median wage of $45,851 is a 25% increase in the last decade. The city ranked fourth in terms of poverty reduction, just below Grand Rapids, St. Louis and Chicago, with a 5% decrease since 2008. Labor force participation added another 9 points to Pittsburgh’s 63-point total; presently at 63%, this is a 4% rise since the recession.
With current unemployment hovering around 5.4%, Pittsburgh has come a long way since its low point in the early 1980s. In 1983, with the regional economy on the ropes, unemployment reached 13.5% in Allegheny County and 17% in the Pittsburgh metropolitan statistical area. When the numbers finally shifted, it wasn’t because jobs and investors returned to Pittsburgh, but rather because the city was losing many working-age residents.
Much like New Orleans, Buffalo or Providence, Pittsburgh has managed to decouple population growth from rising incomes for its residents. In doing so, it has created a model and has managed to regain some of its momentum despite a net demographic loss since the 1950s. According to Census data, the Steel City lost more than 55% of its population, shrinking from 673,763 residents in 1950 to just 297,187 during the recession. It grew by 2% between 2008 and 2017.
What turned around Pittsburgh’s fortune was its big bet on rebranding itself as Robot City, a university-centered technology hub. Carnegie Mellon University founded the Robotics Institute and the National Robotics Engineering Center. Google and Uber have also expanded their footprints in the city for pilot programs of their self-driving cars.
Pittsburgh has managed not only to provide job opportunities for its residents, but also to increase the average income of workers by creating an environment for high-paying jobs in energy, healthcare and education. The city faces regional pressure from both New York and Washington, D.C., especially since the announcement of Amazon’s HQ2 in Arlington, VA. This should, in turn, pressure companies into putting forward even better wage offers and benefit packages to attract workers.
Pittsburgh also leads the way in terms of STEM jobs among cities with a declining population, with roughly 7% of all jobs pertaining to these fields. The city logged 29% growth in its college-educated population―the fourth-highest increase on our list―just behind Buffalo, Philadelphia and St. Louis.
Finally, the city’s proximity to the Marcellus Shale―the largest natural gas field in the U.S.―and Pennsylvania’s role as one of the nation’s top natural gas extractors means that there has been a steady supply of well-paying, blue-collar jobs (roughly $65,000 income) according to 2017 federal pay statistics.
#4 – Buffalo, NY

Buffalo garnered 59 points overall, performing particularly well in terms of labor force participation (12 out of 15 points), educational attainment (10 out of 10 points), and median home value growth (5 out of 5 points).
Similar to Grand Rapids, Buffalo’s economy wasn’t dependent on any one industry, and its reliable source of hydroelectric power makes it an attractive location for a wide range of businesses. However, its diversified local economy couldn’t prevent it from following a familiar pattern of Midwestern urban decline. Many of the challenges the city had to overcome were caused by a series of ill-fated, post-war planning and zoning measures that encouraged urban sprawl just as Buffalo entered decades of demographic decline.
With an ever-shrinking tax base, Buffalo residents found themselves in the unenviable position of having to sustain an expanding infrastructure and social services. This, in turn, pushed many to relocate as their taxes increased. While money was channeled into highway construction, subsidies for suburban housing accelerated the hollowing out of the city’s core. Replacing storefronts with large, single-use buildings and parking garages―along with the separation of work/live/play areas―meant that whole swaths of the city were virtually dead throughout most of the day.
With a current population of 258,592 residents―a 2% decrease since 2008―the city scored 7 out of 20 points for this indicator. However, considering its 55% population drop since 1950, it’s not surprising that when recent Census estimates indicated a slowdown of this exodus, the locals had reasons to be hopeful. Adding to the good news, the number of workers with at least a bachelor’s degree jumped by 41% since 2008 and unemployment fell by 33%.
Median home values have increased by 37% since the 2008 financial crisis, currently hovering around $92,700, with roughly 133,239 housing units throughout the city. The city’s resurgence is visible around a number of concrete cylinders, part of the General Mills factory near the waterfront. Dubbed Silo City, the site hosts everything from concerts to poetry nights to craft beer festivals.
#5 – Columbus, OH

Columbus increased its housing inventory by 8% since 2008, with approximately 391,716 units. According to a survey by the Associated General Contractors of America, construction activity is likely to hold steady throughout this year; nearly 90% of Ohio companies report that they are planning to hire additional workers.
As Ohio’s capital and home to the state’s most prestigious university and the Midwest’s largest venture capital fund, Columbus outranks four other cities from the Buckeye State―Cincinnati in sixth place, Akron in 12th place, Cleveland in 15th place and Toledo in 16th place―in terms of educational attainment, with 23% of its active workforce having a bachelor’s degree.
Arch City’s 70% labor force participation is above the average on our list at roughly 63%, but it’s still a couple of percentage points short of its pre-recession values. Its unemployment rate went down by 22%, and the yearly median income rose by 17%, reaching $51,708 in 2017.
In 2008, roughly 21% of Columbus residents were college-educated―the second-largest number among the 17 cities included in our research. By 2017, following a 6% bump, it was still above the 18% average, just behind Madison, Grand Rapids, Pittsburgh and Chicago.
The population of Columbus grew by 19% in the past 10 years, which is the largest increase for this indicator on our list. The numbers are even more spectacular when examining an extended period of time. Since 1950, the city added 507,131 residents, a staggering 135% jump in a 60-year period. Although the city came in just below average for the seven other metrics, its exceptional performance in terms of population growth allowed it to collect nearly 57 points, which placed it within the top five entries.
With a current population of 881,901, Columbus has more residents than the city of San Francisco, excluding its respective metropolitan areas. According to Forbes, Columbus has been the most appealing city for working Ohioans, which contributed greatly to its population growth. In order to maintain this trend, the city would benefit from attracting more people from other states or countries, as well as correcting its current demographic net loss in favor of Southern California, Houston, Atlanta and the Tampa Bay area.
#6 – Cincinnati, OH
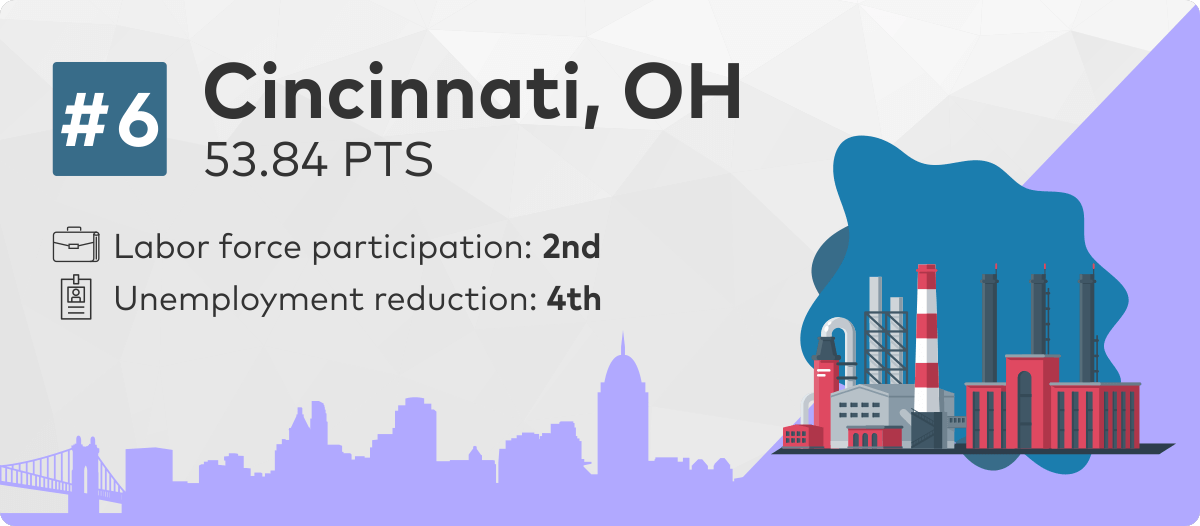
Cincinnati received almost 54 points, with labor force participation and unemployment reduction as its best-performing indicators. The city received 14 out of 15 points for the former and 12 out of 15 points for the latter. The points it collected for these two contributed roughly 49% to its overall score. Between 2008 and 2017, the Queen City’s unemployment rate dropped by 35.8%, just behind Grand Rapids (with 36%), Akron (with 38%) and Madison (with 42%).
The median income rose by 16% in the same period, from $33,562 to $38,938. Poverty rates went down 10% since the recession, as real per capita income in the larger Cincinnati metropolitan area expanded by 38%. Wages have gone up unevenly across different occupations, with workers in tech and healthcare seeing most of the gains.
As the city tries to facilitate ways for large corporations and ambitious entrepreneurs to work together, Cincinnati is quickly becoming one of the top cities for startups in the area. With a higher-than-average concentration of chemical manufacturing within its city limits, Cincinnati is home to chemical-makers like Pilot and P&G, along with nine Fortune 500 companies.
Signs of the city’s resurgence are visible everywhere. Much like Milwaukee, St. Louis or Pittsburgh, Cincinnati launched a waterfront development project, drawing most of the necessary financing from private donors to create Smale Riverfront Park, a 45-acre belt of green space along the Ohio River. It also turned the abandoned Union Terminal train station into a Cincinnati must-see, hosting a science and natural history museum and a children’s museum—all under the largest half-dome in the Western hemisphere.
#7 – St. Louis, MO

Coming in at number seven with a total of nearly 52 points, the Gateway City scored second-highest in income growth―22%, just behind Pittsburgh―and second-best in poverty reduction performance at 11%. St. Louis also received 8 out of 10 points for its workforce’s educational attainment, registering a 29% gain in terms of college-educated residents in the last decade.
The city has focused heavily on bioscience, attracting giant companies like macro-crops developer Monsanto and chemical manufacturer DuPont. When New York-based pharmaceutical giant Pfizer chose to downsize its research operations in St. Louis in 2010, it laid off one of the largest numbers of highly skilled workers in the area. Fortunately, they were quickly absorbed by other big companies and startups, giving the latter a real leg-up in terms of human capital. In the same business-friendly vein, the city houses more than 200 companies in its T-REX tech incubator coworking office and 240-acre bioscience complex, called CORTEX.
In 1950, St. Louis was home to roughly 850,000 people. By 2008, that number had dropped to just 354,000 and dipped another 13% by 2017. As the city struggled, businesses began to leave. In 1980, St. Louis was home to 23 Fortune 500 companies; today, only 10 remain.
However, looking at recent trends, there are plenty of reasons to be optimistic. St. Louis retains and attracts a lot of bioscience talent through its top-notch medical school, part of the prestigious Washington University of St. Louis. Its robust R&D infrastructure also includes the world’s largest independent, non-profit, plant science research institute―the Donald Danforth Plant Science Center, the National Geospatial Intelligence Agency and the McDonnell Genome Institute―which was part of the effort to decode the human genome.
Recently, St. Louis has been trying to solve a century-old issue by merging with the neighboring St. Louis County to become the tenth-largest city in the U.S. Since 1876, the split of city and county meant separate governing administration, courts and taxation for each municipality and suburb.
#8 – Chicago, IL

Chicago’s presence among Rust Belt cities is somewhat contested, as the Windy City’s diverse economy meant it was never hit as hard as other Midwest cities by the wave of deindustrialization that began in the late 1970s and ’80s. Nevertheless, it does exhibit some of the decline and recovery patterns familiar to Rust Belt cities.
Chicago scored just under 47 points, with its best performances across the poverty reduction and income indicators. The city’s efforts to reduce poverty between 2008 and 2017 have yielded a 10% drop, the third-best performance for this indicator among the cities on the list.
In the same period, the unemployment rate decreased by 12%―reaching 8%―and median income grew by 18%. In terms of the actual dollar value, the wages of Chicago workers are the second-highest of the 17 cities at $55,295 per year, just behind Madison’s $65,072 per year.
Successful Midwestern comeback stories often feature the reimagining of a local landmark. The evolution of Chicago’s Motor Row is indicative of the many changes reshaping the country’s former manufacturing centers. Stretched between Michigan Avenue 2200 and 2500 and 26th Street, it was one of the most important shopping corridors for the auto industry before the war. In the 1950s and ’60s, Motor Row became Record Row, as the showrooms were converted into record stores, selling jazz, blues and soul albums. After the 1970s, however, the terracotta palaces that had housed various businesses fell into disrepair for several decades.
Today, Motor Row is part of the National Register of Historic Places, and city officials and business leaders plan to breathe new life into the corridor by transforming it into an entertainment district. Former Chicago Bears Julius Peppers and Israel Idonije have set their sights on the Hudson Motor Building at 2222 South Michigan Avenue with the goal of converting it into a coworking office with amenities such as restaurants, a rooftop pool, a gym and a barbershop. Motor Row Brewing, renovated by former Chicago Mercantile Exchange trader Bob Lassandrello, is another success story on Michigan Avenue, bringing craft beer and frequent blues performances from local artists to Chicagoans.
#9 – Philadelphia, PA

Philadelphia collected almost 44 points overall, performing above average in terms of population growth (14 out of 20 points), educational attainment growth (9 out of 10 points), and median house-price evolution (4 out of 5 points). Unemployment here has decreased by 9% since the financial crisis, although it remains significantly lower than the average 25% drop across the 17 cities and the 42% maximum achieved by Madison.
Nearly 16% of Philadelphians 25 years or older have a bachelor’s degree―a 38% increase in the last decade; this gives the city a great advantage in a region with a high concentration of healthcare, biomedical and tech jobs. Since 1950, the City of Brotherly Love has lost roughly 484,000 residents, dropping from 2 million to 1.4 million in 2008. Beginning in 2012, it has slowly trended upward, sitting at 1.58 million in 2017.
The extent to which Rust Belt cities manage to create employment opportunities for its non-college-educated workers is a good indicator of their versatility in making the most out of their shrinking manufacturing base. In Philadelphia’s case, although the number of blue-collar jobs has decreased from 31% in 1975 to a mere 6% today, the city aims to create opportunity occupations. These are jobs that don’t require a bachelor’s degree and pay an annual median wage of $37,690. In the Philadelphia metro area, the share of these opportunity occupations is roughly 22% of all available jobs, with registered nurses, truck drivers, and maintenance and repair workers taking some of the most well-paying jobs for blue-collar workers.
Thanks to its extensive commuter rail network and robust urban transit system, Philadelphia provides a lot of mobility for its active workforce. Despite a 19% increase in home values between 2008 and 2017 – from a $139,100 median house price to $166,200―Philadelphia continues to provide fairly affordable housing options.
#10 – Rochester, NY
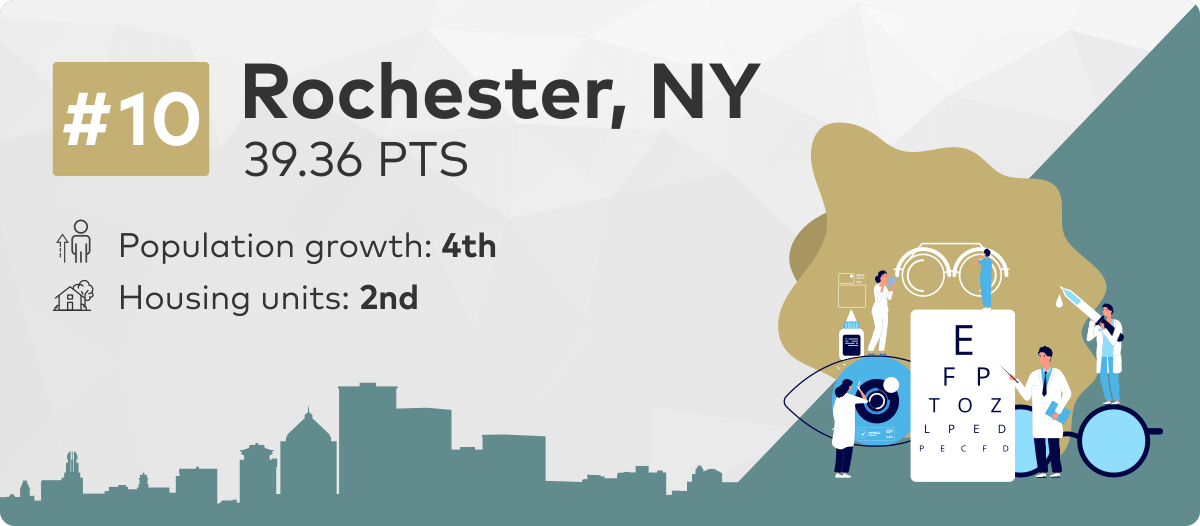
Rochester closes out the top 10, with a total of 39 points, scoring 19 points less than Buffalo, the other New York entry on our list. Rochester received its highest scores for population growth (14 out of 20 points) and the percentage of new housing units built (4.5 out of 5 points).
Home to roughly 331,000 residents in 1950, the city’s population shrank to 191,000 by 2008, only to rebound a decade later by 9%, reaching 208,000. According to the 8% increase in new housing units on the Rochester market is not enough to address growing interest in the market. It’s not uncommon for millennials looking to move to Rochester to end up in bidding wars to secure their accommodations.
Although two points below our list’s 17% average for number of residents 25 years or older with a bachelor’s degree, the city’s university is still providing employers with top talent and vital research.
While other Rust Belt cities were struggling during much of the 1980s, Rochester provided plenty of opportunities for white-collar workers at its three main employers: Canadian eye-health product supplier, Bausch+Lomb, Kodak, and Xerox. Throughout Kodak’s three-decade presence in the city, the company’s employment went from 61,000 to 1,500. However, its facilities on Lake Avenue now host a photonics and optical technology-based innovation cluster as part of the National Network of Manufacturing Institutes. Some of the recent top employers in the city currently include the University of Rochester, Paychex and Rochester Regional Health.
#11 – Baltimore, MD
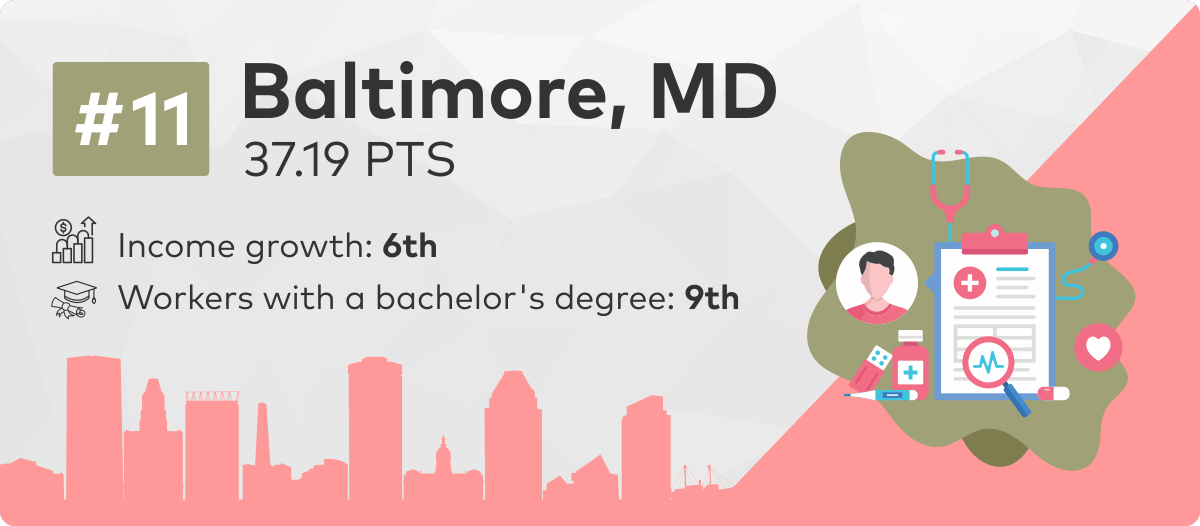
Income growth accounted for roughly 24% of Baltimore’s total of 37 points. Workers gained 17% in wage increases between 2008 and 2017, going from an annual median income of $40,313 to $47,131. This is the sixth-highest growth for this indicator on our list―eight points below Pittsburgh’s 25% income rise.
The city has also seen a 20% rise in the percentage of working-age people with college degrees; 15% of residents who are 25 or older hold at least a bachelor’s degree. The Community College of Baltimore County (CCBC) works closely with employers to adjust its curricula to help students develop skills that fit the needs of businesses in the region. As a result of its efforts, 95% of CCBC graduates go on to work within their local communities.
Over the years, Charm City has become a hotspot for cybersecurity firms like DataTrive and AllegisCyber, attracting big names in tech to its Port Covington project. It has also capitalized on its role as the third-largest healthcare community in the U.S., with more than 189,000 health professionals in the greater Baltimore region. Johns Hopkins University and Johns Hopkins Health System are the top two private-sector employers in Baltimore, followed closely by Maryland Health System and MedStar Health.
#12 – Akron, OH
Akron is the third Ohio city on the list, earning just under 36 points. The city’s unemployment score (13 out of 15 points) contributed the most to its total; its 38% decrease is the second largest across this metric, just behind Madison’s 42% reduction. In 2017, labor force participation was 62%, with an 8% unemployment rate. Since the economic crisis, Akron’s poverty numbers held steady at 23%, just below the 24% average for this indicator across the 17 cities.
According to The Fund for Our Economic Future, Akron also enjoys a stronger-than-average growth for burgeoning startups in Ohio. But, despite its decreasing unemployment rate, the city’s $36,816 median annual wage is still roughly $3,000 less than it is in Cincinnati, and $15,000 less than the median annual wage in Columbus.
Similar to many other Rust Belt cities, Akron’s downturn began in the 1970s due to increased competition from abroad. Following the war, Goodyear had put Akron on the map as the Rubber Capital of the World, expanding its local facilities to include airship and defense operations and employing roughly 37,100 people in 1964. But, diminishing demand for Akron-produced bias tires in favor of Michelin’s ever-more-popular radial tires―accompanied by a series of plant closures and downsizing―wreaked havoc on the city’s labor force.
Thanks to its existing R&D capabilities, Akron managed to re-brand itself as a center for polymer research and production, diversifying its economy and attracting more than 200 companies that currently employ 10,000 people. Furthermore, the city has invested in plans for its downtown revival and adaptive reuse for its existing industrial inventory. Goodyear’s former headquarters will be converted into a live/work/play community, and a similar redevelopment has been approved downtown near the Akron Civic Theater.
Additionally, local leaders are looking into ways to make the most of investor interest in Akron’s opportunity zones. Summit County has 16 opportunity zones located in North Hill, Downtown Akron, East Akron and the Akron Executive Airport, Firestone Park, West Akron, Kenmore, the northern end of Downtown Cuyahoga Falls to Portage Crossings, and most of Barberton.
#13 – Milwaukee, WI
Milwaukee is the second Wisconsin entry on our list, coming in at 34 points. The city reduced its unemployment rate by 29% since the recession. That number might be well behind Madison’s 42%, but Milwaukee has more than twice the population of its in-state contender. Cream City’s 5% wage growth since 2008 means that there’s still a significant median income difference between the two Badger State cities, with Madison residents earning $65,000 a year compared to Milwaukee’s $39,000.
Milwaukee also took a different approach than other cities in dealing with its decaying industrial inventory. While cities typically try to convert old warehouses and plants into residential, office or retail spaces, local leaders wanted to attract manufacturing back into their community. They also wanted to avoid relying heavily on the storage industry, which―although great for reducing unemployment―generates mostly low-paying jobs.
The Menonomee River Valley, currently home to more than 25 businesses employing more than 16,000 workers, has been revived through a public-private partnership that brought together employees, public officials, neighborhood representatives and companies. One of its initiatives involved the acquisition of Morton Salts’ old salt yard at the eastern end of the valley. It was merged with an adjacent, vacant lot and sold to Harley Davidson, which subsequently built a 130,000-square-foot museum on the site. The partnership also developed a 140,000-square-foot plant in the central valley for a solar panel manufacturer and a printing company.
Lately, the Milwaukee skyline has been peppered with cranes, with more than $5 billion in new projects under construction. Developments like the Lakefront Gateway Project aim to improve walkability by creating an oasis of green space between the lakefront and downtown. A new streetcar system called “The Hop” should further encourage residents to use public transportation instead of driving.
#14 – Fort Wayne, IN
Indiana’s only entry on our list, Fort Wayne finished with 33 points. It received 10 out of 20 points for its population growth and 4 out of 5 points for the rise in its median home value.
Summit City’s number of residents grew by 3% since 2008, and Fort Wayne is one of the few cities in our ranking whose population actually increased since 1950―from 133,000 residents to 255,000. A 92% boost, it’s the third-most significant within this 67-year timeframe among the Rust Belt cities that made the list; it was outperformed only by Madison’s 167% hike and Columbus’ 135% surge.
Fort Wayne was recently designated one of the hottest real estate markets in the Midwest. Since the recession, median home prices in Summit City increased by 21%―from $97,500 to $117,900. Additionally, in terms of affordability, it continues to have the lowest cost of living of any U.S. city.
Unemployment went down by 23% in the last decade, resting at 6% in 2017, below the 7.8% average for this indicator across the 17 cities.
Fort Wayne was hit hard by deindustrialization, as roughly 40% of the city’s workers were employed by General Electric in the company’s heyday. Once the jobs evaporated, the city worked to put the deserted campus to good use. A new project, powered by $45 million in local government bonds, will convert GE’s 18-building property into 100 apartments; 225,000 square feet of Class A office space; and 83,000 square feet of retail space.
#15 – Cleveland, OH
Cleveland garnered 32.6 points, receiving its highest score for its labor force participation. Since 2008, the number of workers with a bachelor’s degree increased by 27%, a value well above the 18% average among the 17 cities on our list. The current median income is $29,000 per year, up 8% since the financial crisis.
According to FiveThirtyEight, Cleveland’s loss of manufacturing jobs since the 1970s is comparable to that of Philadelphia. However, the degree to which emerging industries in Cleveland have absorbed existing workers is much lower than it is in Philadelphia. This is due, in part, to the slower pace of economic diversification in the greater metropolitan area. One industry currently blossoming is healthcare and biomedical development, spurred by the Cleveland Clinic and Case Western Reserve University.
There are 700 companies in Cleveland―400 more than before the financial crisis―and 60 healthcare systems, employing a total of 145,000 workers. Cleveland has also recently attracted big-budget film production companies, doubling as New York City in movies such as “The Avengers” and “Captain America: The Winter Soldier.”
#16 – Toledo, OH
Toledo scored 32.5 points, making it the last of the Ohio cities featured on this list. Since 2008, Glass City has seen its median wage increase by 9% or $3,182. The current median income of $37,339 is 23% higher than Detroit’s and 29% higher than Cleveland’s, which outranked Toledo overall by just a small margin. The city has also reduced unemployment by 20% in the past decade, but its 9% rate is still above the 7.8% average for our 17 entries.
Toledo noted 16% growth in educational attainment for its residents; currently, 13% of its workers who are at least 25 years old have at least a bachelor’s degree. The city also has opportunities for those without a college degree; 34% of the total share of jobs in the Toledo metro area pay above-median wages and don’t require a bachelor’s degree.
The century-old slogan, “You will do better in Toledo,” rings anew as the city slowly rebuilds itself around its downtown and riverfront. Two moves were especially important in injecting new life into the urban core. First was the Toledo Mud Hens’ move to the downtown ballpark, which coincided with particularly good performances by the team over several years, and led to the opening of more than 70 businesses within a three-block radius of the ballpark. And, second, the consolidation of healthcare giant ProMedica’s operations into Toledo’s downtown transformed not only a disaffected power plant on the Maumee River into a state-of-the-art facility, but also increased foot traffic by bringing roughly 2,000 people into the area during workdays.
Like many Midwest cities, Toledo’s housing market is a lot more generous to buyers looking to get more square footage for their dollar. With median home values still below their pre-crisis levels―at $78,400―those looking to settle in Glass City can have their pick from a number of Victorian and Edwardian-style properties in the Old West End neighborhood, or Federalist and Colonial-style homes in Old Orchard.
#17 – Detroit, MI
Closing out our list, Detroit received 25 points. Growth of the workforce’s educational attainment levels was the city’s best-performing metric, gathering 7 out of 10 points and contributing 29% to the city’s final score.
Since 2008, Motown has witnessed 27% growth in terms of workers with college degrees, as well as a 23% reduction in unemployment, which decreased from 20% to 16% in the last decade.
The city went from 777,500 residents in 2008 to 673,000 in 2017―a 13% drop and the largest population decline charted among the 17 cities on our list. However, the good news is that the stream of people leaving Detroit has slowed to a trickle, going from 10% between 2008 and 2012, to 4% in the next five years.
Despite these challenges, the future holds a lot of promise for a city that had to file for Chapter 9 bankruptcy only six years earlier. One of the first positive signals was in its downtown. The relocation of the Quicken Loans mortgage company’s headquarters to downtown Detroit was paramount to the city’s comeback, generating employment opportunities and much-needed tax revenues. Dan Gilbert, the firm’s CEO and owner of the Cleveland Cavaliers, invested an estimated $5.6 billion into several Detroit properties along Woodward Avenue. In June 2018, Ford unveiled plans to open an innovation center in the old Michigan Central station, and General Motors also moved its operations back downtown.
Methodology
While there are varying maps and definitions of which cities make up the Rust Belt, our research included 105 former manufacturing cities in the following states: Illinois, Indiana, Maryland, Michigan, Missouri, New York, Ohio, Pennsylvania and West Virginia.
We looked at cities with a total population of more than 200,000, and for which data for the 2008-2017 period was available for each of our eight indicators.
Using the latest U.S. Census data, we produced a standardized score for each factor for each city. Points for all indicators were distributed directly proportional to their value, except for the poverty rate and unemployment rate indicators, for which points were awarded in inverse proportion. Entries could gather a maximum of 100 points.
Between 0 and 20 points were allocated for shifts in a city’s population. Entries received between 0 and 15 points for each of the following indicators:
- labor force participation
- unemployment
- income rate
- poverty rate
Between 0 and 10 points were awarded for increases in each city’s college-educated population (25 years or older with at least a bachelor’s degree). Entries could garner between 0 and 5 points, depending on the percentage increase of the median home value and number of housing units within the area.
“Population” refers to the percentage increase or decrease in the total population for each entry between 2008 and 2017.
“Labor force participation” refers to the percentage increase or decrease of the number of people who were either employed or actively looking for employment between 2008 and 2017.
“Unemployment” refers to the percentage increase or decrease in the unemployment rate between 2008 and 2017.
“Income” refers to the percentage increase or decrease in the median annual wage between 2008 and 2017 (inflation adjusted).
“Bachelor’s degree” refers to the percentage increase or decrease in the total number of workers age 25 years or older who have at least a bachelor’s degree between 2008 and 2017.
“Housing units” refers to the percentage increase or decrease in the total residential units between 2008 and 2017.
“Median home value” refers to the percentage increase or decrease of the median home value between 2008 and 2017.
One of the primary ways in which manufacturing centers can reach economic diversification is through investing in logistical infrastructure, with demand for moving products from point A to point B being greater than ever thanks to online sales. Check out the wide array of industrial spaces available in some of the most competitive markets in the U.S.:


Diana Sabau
Senior Content Writer, CRE News & Market Analysis
Drawing on years of intense research in the U.S. commercial real estate market at Yardi Matrix, Diana now applies her expertise as a writer for the CommercialCafe blog. Her articles focus on CRE investment, labor market trends, and technology, and have been picked up by prestigious publications including the New York Times, GlobeSt, The Real Deal, NAIOP, MSN, and Bisnow.