Study: Top Counties for Opportunity Zone Investment


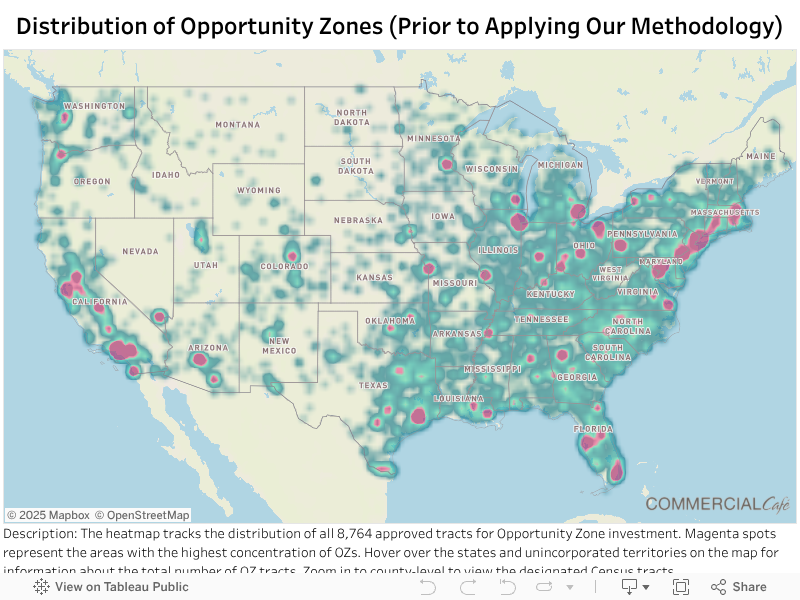
The Investing in Opportunity Act (‘IOA’) had gone under the radar for several months after it was passed as part of the Tax Cuts and Jobs Act of 2017, until it eventually captured the attention of investors last year. The program proposes tax incentives that could redirect dormant capital gains into under-developed communities, designated as opportunity zones (OZs). But which of 8,764 eligible tracts might garner the interest of prospective investors?
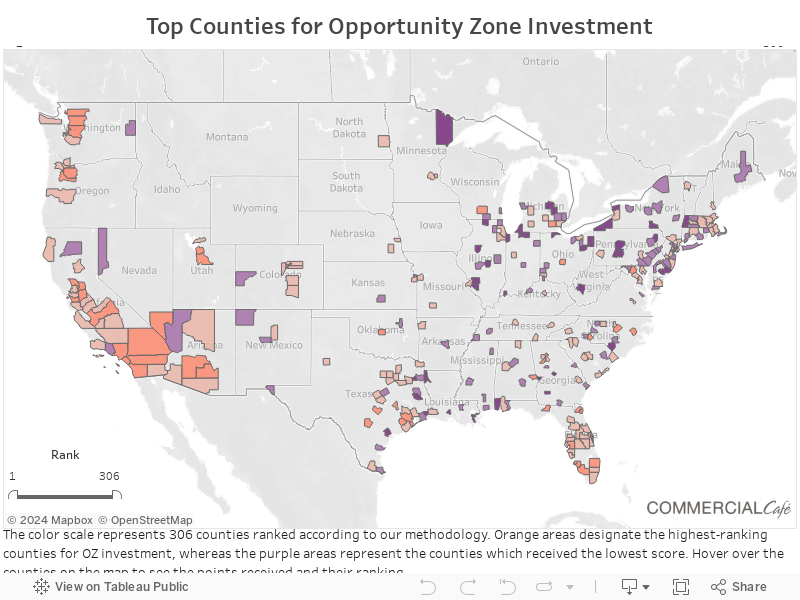
CommercialCafe has compiled a list of top counties for investment by allocating points for the following indicators: employment, GDP, population growth, poverty rates, the educational attainment level of the labor force and the number of eligible opportunity zones within each area. The study also details the fiscal benefits of the program, the selection criteria for OZs and the importance of public sector investment along with private capital in these areas. Keep reading for more details about our findings and methodology.
Executive summary
- Opportunity zones aim to funnel $6.1 trillion of unrealized gains into distressed communities through tax deferment and deduction for investments of 10 years or more.
- Some governors designated only distressed areas as OZs; others included up to 5% ineligible tracts from contiguous, non-distressed areas
- Texas has the most entries in the Top 20 counties for opportunity zone investment, with Travis getting the highest overall score for across the five indicators
- Places that focus on creating walkable, high-density, transit-oriented urban areas, like Wake County, NC – number 5 in our top 20 – are making their regions increasingly attractive to private capital
Opportunity Zones Seek to Attract Up to $6T of Unrealized Gains
The impetus behind the creation of opportunity zones is the observation that despite record returns in post-recession years, investors have been more inclined to hold on to assets, in an effort to avoid capital gains taxes. According to estimates made by the Economic Innovation Group, there are $6.1 trillion of unrealized gains held by American households and corporations. With the advent of OZs, businesses, private and institutional investors, hedge funds or REITs can both defer and reduce their capital gains taxes, depending on their holding period.
For instance, anyone investing capital gains from a previous transaction into an opportunity zone fund (OZF) for a minimum of five years would get a 10% capital gain tax reduction. If investors keep their money in the fund two more years, there’s an additional 5% reduction. By the ninth year, when the tax on the initial invested capital gain is due, investors will pay only 85% of the original tax. Most importantly, after ten years there is a 0% tax on any subsequent profits made. There is no limit as to the total amount OZF investors can save in taxes after a 10-year period, making it an extremely attractive prospect for patient capital.
Given the law’s stated purpose, the IRS and Department of Treasury have released a set of regulations to act as a guideline and safeguard against asset accumulation. For example, OZFs need to use capital gains for substantial improvements to the property (i.e., proportional to the value of the acquired building, excluding the value of the land), and do so within a 31-month period. Also, at least 50% of an OZF’s gross income must derive from business conducted within a qualified tract.
To avoid the turmoil caused by simultaneous exits from OZFs in 2029, the law provides an extra 20 years in which investors can realize their tax-exempt capital gains, namely until December 31, 2047. Due to the recent government shutdown, additional details about the implementation of the program have yet to be released by the IRS.
Georgia, California and Texas Pick Most Distressed Neighborhoods as Opportunity Zones
On June 14th, 2018, the Department of Treasury certified the final list of states’ nominations for the opportunity zone program. Selection criteria included an average poverty rate of 20% for eligible tracts, as well as a median family income of no more than 80% of the statewide median income. Governors could pick up to 25% of eligible tracts from their state, and the final tally included 8,764 opportunity zones located in areas with an average poverty rate of 31% and a local median family income of 59%.
However, from the overall selection, there is a great chance that investors are already eyeing some easy picks. There are many factors that determine an opportunity zone’s appeal, but some differences are apparent from the get-go. For example, governors could include up to 5% of ineligible tracts into their OZ selection, provided these areas were contiguous with an eligible tract and the median family income did not exceed 125% of the local median family income of the contiguous tract.
Some states chose to use this provision more than others. While Georgia, California, and Texas designated tracts from their most distressed communities, 28% of the nationwide selections were either college campuses having poverty rates below the required 20% or areas with low population density.
This fact has alerted activists and organizations to the dangers this piece of legislation might bring to already gentrifying areas. Critics argue that property improvements will lead to rent increases that displace residents, basically pushing distressed communities further out instead of addressing their fundamental issues. There are also concerns regarding the possibility of OZFs lowering demand for municipal bonds, a main funding resource for local authorities seeking to invest in vital infrastructure projects.
150 Opportunity Zones for Investors to Choose from in Harris County, TX
The race for a relatively small pool of highly attractive opportunity zones will drive up the cost of entry into these markets and nudge investors towards less obvious contenders, that nevertheless have the potential to act as a robust investment.
By applying our methodology, a list of Top 20 counties for investment in OZs emerges, led by Travis County in Texas with a total of 66 points. The county’s population has grown by 6.5% between 2014 and 2017, with Austin’s metro area adding 105 people per day in terms of net migration to the region. The area has 21 opportunity zones and a 12% poverty rate – below the required 20% and well below the national average of 30%.
As Texas has become a desirable location for many freelancers due to lower living and housing expenses, the tight labor market is putting pressure on employers looking for new talent. Some companies resort to increasingly varied and innovative office perks, but workers are also asking for a more conventional improvement: raises. While Texas prohibits local authorities from raising the minimum wage for private businesses, employees working in counties grouped around the Lone Star State’s great cities are clearly at an advantage. The average weekly wage in Travis County is $1,226, the largest amount among the counties making up the Austin metropolitan area, and 31% more than the Texas average, at $938.
Three other Texas counties make the top 20. Galveston County has a 12% poverty rate but offers only eight opportunity zones for investors to choose from, while Harris county has a whopping 105 tracts, with an average poverty rate of 16%.
Utah County―part of the Provo–Orem metropolitan statistical area―ranks seventh with 60.8 points. It had the highest employment growth of the first 20 areas for OZ investment, witnessing a 3% rise between 2014 and 2017. The county includes five eligible tracts.
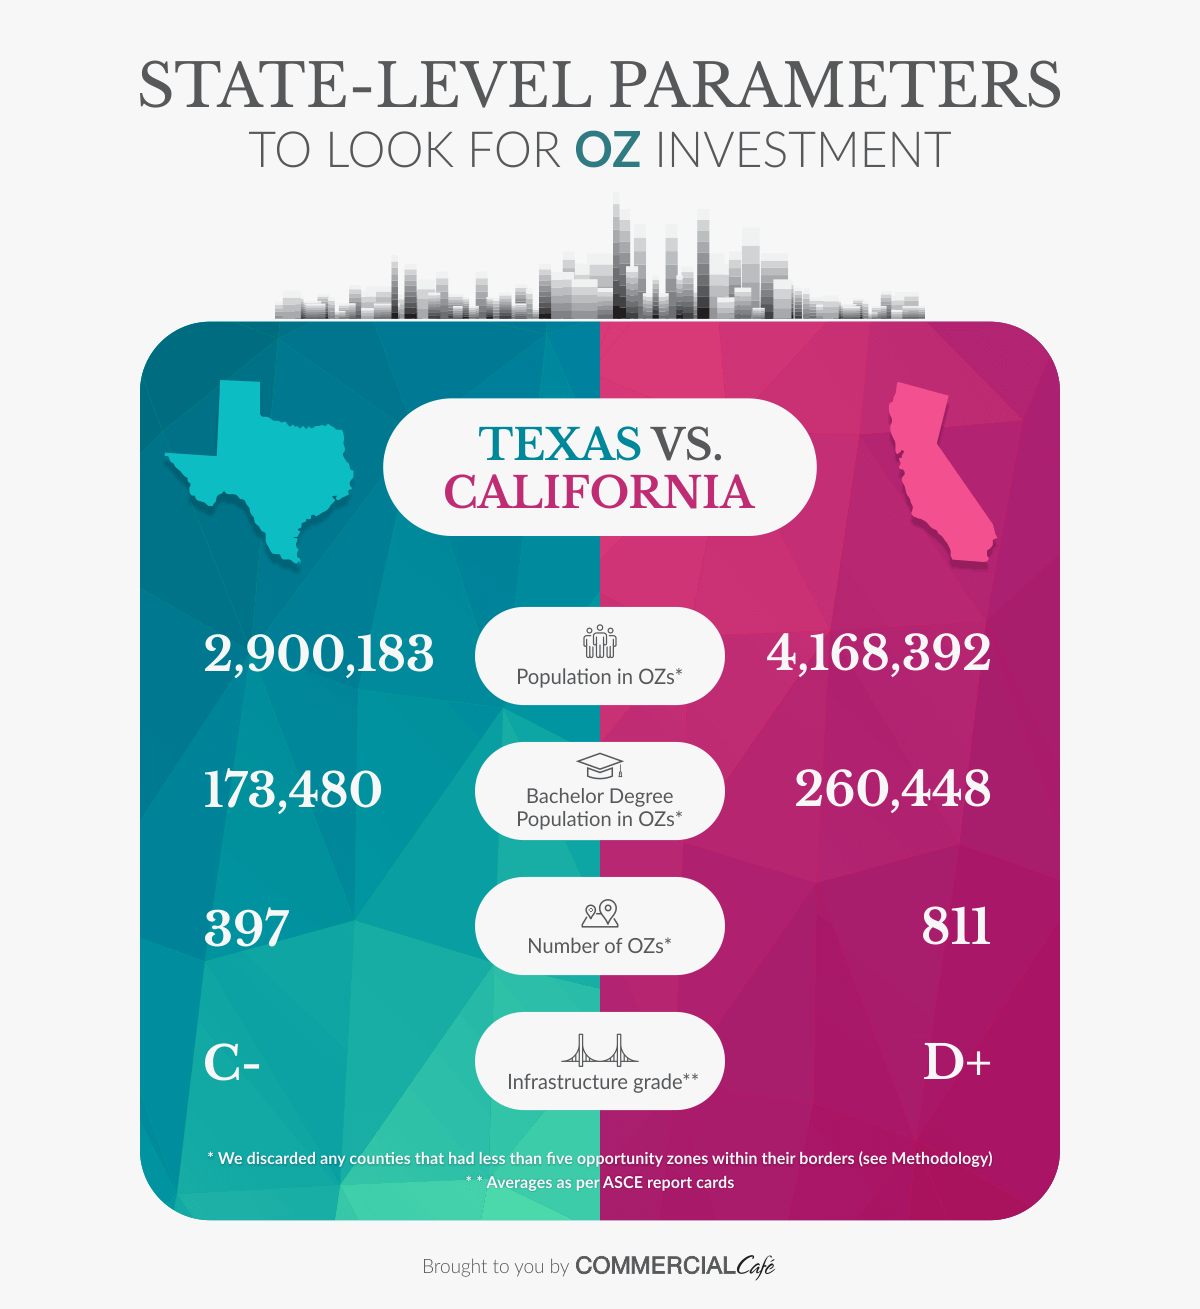
At state level, California and Texas are among the highest ranking in terms of the number of opportunity zones open to investors, with 679 and 628, respectively. The Lone Star State received a C- for its infrastructure, with its 53,488 bridges scoring highest (B), but its wastewater, flood control facilities and dams are in dire need of repairs, managing only Ds. California’s report card highlights the poor condition of its roads (D), bridges (C-) and transit (C-). The are 27 counties with over five OZs in the Golden State, with a population of 25 years and over of roughly 4.17 million in the eligible tracts. There are an estimated 260,500 residents with a bachelor’s degree within the area. Texas has 32 such counties, a total of 2.9 million people living in opportunity zones and approximately 173,500 college-educated residents.
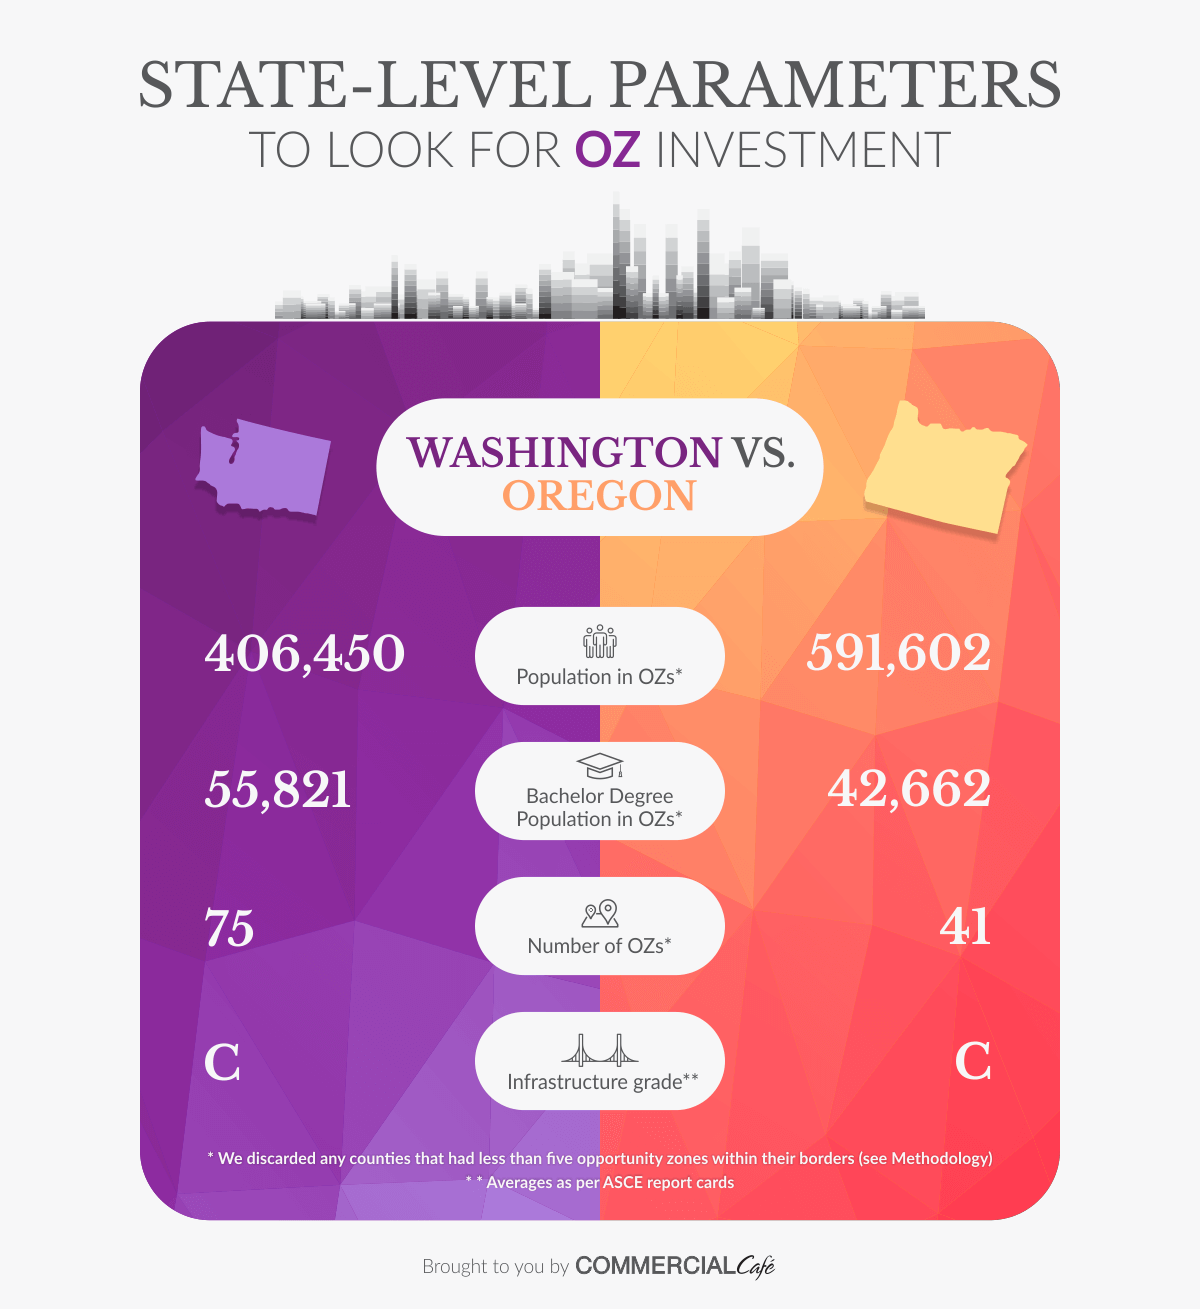
Washington state has seven counties with more than five opportunity zones and has received a C on its latest infrastructure report card. King County―which fell just a few points short of the Top 10 counties for investment in OZs―is currently adding a $262 million treatment plant for polluted water to the state’s stormwater infrastructure, which was graded as D+, the lowest score for this state. It has 56,000 residents with a bachelor’s degree and a 25 years or older population of 406,500 in opportunity zones. Oregon has the third best infrastructure score, although it still needs to take care of its 77 dams with high hazard potential. The working-age population in the state’s opportunity zones is roughly 592,000, with 43,000 college-educated residents.
Private Capital Meets Public Spending – The Vital Role of Infrastructure in the Success of OZs
According to the most recent report cards released by The American Association of Civil Engineers (ASCE), U.S. infrastructure scores a modest D+, with transit scoring the lowest among grade categories. The ASCE estimates that roughly $1.5 trillion would need to be spent by 2025 to close the nation’s growing infrastructure gap.
Infrastructure is essential for the effective positioning of private capital and the functioning of the economy overall. Poor infrastructure translates not only in a general loss of economic productivity, but also as a threat to the wellbeing of workers and the potential for major accidents due to failures like bridge collapses, inadequately maintained roads or compromised water supplies. While discussions are underway at the national level for a new spending package, some of the highest ranking counties in our top 20 have already recognized that expanding or upgrading their infrastructure can give them an edge in attracting investors.
In Clark County, Nevada, voters have approved 171 development projects worth roughly $432 million, and in 2018, a plan to connect Las Vegas’ office market to Victorville and Los Angeles via high-speed rail, called the XpressWest, was revived. By 2025, the Regional Transportation Commission of Southern Nevada is expected to deliver a light rail or an improved bus service linking McCarran International Airport with downtown Las Vegas, the medical district and the future UNLV medical school. According to its current report card, Clark County’s School District unfunded needs are in excess of $8.3 billion, with roughly $4.6 billion needed for upgrading existing facilities. In 2015 the Clark County School District was authorized to issue bonds to collect capital needed for upgrades. The program is expected to bring in $4.1 billion over the next ten years.
Wake County, North Carolina has a population of 1 million and is expected to add 250,000 new residents within the next decade. To avoid congestion, local authorities are planning a series of projects, including the expansion of the I-40, I-440 and I-540. The Wake Transit Plan proposes the construction of four new rapid bus lines by 2027 that would offer vital transit solutions for anyone living in Raleigh, Garner or Knightdale, both housing opportunity zone tracts.
Much of the future success of opportunity zones depends on the existing conditions of each region at the time the law was passed and the degree to which local authorities and communities organize to direct incoming capital in a way that leads to sustainable, long-term growth. Urban areas that have taken steps to increase walkability and expand their public transit lines provide an attractive investment target. Risk-averse investors will be eyeing counties that are already considering large-scale spending packages for their energy, transportation and communications infrastructure.
Methodology
For the purpose of this study, we used the list of 8,764 approved opportunity zones provided by the US Department of Treasury – CDFI Fund as a starting point. We excluded unincorporated areas and the state of Alaska from our list. We discarded any counties that had less than five opportunity zones within their borders. The resulting numbers were further trimmed down as we eliminated any entries with incomplete data for our chosen indicators.
We turned to the U.S. Census Bureau for data regarding population growth, poverty rates and population with a bachelor’s degree in each area. For information about employment growth and GDP growth* we used the numbers provided by the Bureau of Labor Statistics and Bureau of Economic Analysis, respectively. Finally, the US Department of Treasure – CDFI Fund provided the data for the total number of opportunity zones in each county.
Points for all indicators were distributed directly proportional to their value, except for the poverty rate indicator, for which points were awarded in inverse proportion. Entries could gather a maximum of 100 points. Between 0 and 20 points were allocated for each of the growth indicators (employment, population and GDP). Counties received between 0 and 10 points based on their population with a bachelor’s degree – the higher the number, the more points awarded. Entries could garner between 0 and 15 points, depending on the total number of opportunity zones within the area. For the poverty rate indicator, between 0 and 15 points were awarded in inverse proportion, with a lower poverty rate leading to more points.
* As per the Bureau of Economic Analysis’ records, the most recent GDP growth numbers at county level are from 2015, according to their latest update on December 12, 2018.
Opportunity zones have the potential to become some of the most promising areas for commercial real estate investors. Check out the top commercial real estate markets in the U.S.:
Disclaimer
This study is for general informational purposes only and does not constitute and should not be relied on as a basis for an investment decision. The information presented is subject to change without notice and may or may not apply depending on the circumstances. Always contact a qualified investment consultant if you need advice regarding buying, selling or otherwise transacting in any investment.


Diana Sabau
Senior Content Writer, CRE News & Market Analysis
Drawing on years of intense research in the U.S. commercial real estate market at Yardi Matrix, Diana now applies her expertise as a writer for the CommercialCafe blog. Her articles focus on CRE investment, labor market trends, and technology, and have been picked up by prestigious publications including the New York Times, GlobeSt, The Real Deal, NAIOP, MSN, and Bisnow.