Manhattan Office Sales in Q2 2019 Just Short of $2B, Trophy Office Space Leases Hit $94/Sq.Ft.


Executive Summary
-
- Office sales volume drops 26% y-o-y, closes Q2 at $1.9 billion
- Average sale prices drop to $556/sq.ft., lowest in five years
- Google buys Milk Building for $592 million in largest Q2 office transaction
- Average asking price for trophy office space hits $94/Sq.Ft. in Q2, A+ vacancy nearly 7%
- Non-traditional office space surpasses 16MSF in Manhattan
- New office space hits Chinatown in Q2, over 1MSF on track for delivery in Q3
It was a slow start to the year on the Manhattan office market, followed by a slightly warmer Q2. Sales picked up a little steam as the year has advanced, but still stopped short of market performance in 2018. Manhattan office sales in Q2 2019 amounted to just under $2 billion, marking a 26% year-over-year drop. The average sales price continued its downward trend and rested at $556 per square foot. Overall asking rents saw a slight uptick year-over-year, mainly driven by the spike in trophy office space rates. Vacancy in office buildings equal to or larger than 25,000 square feet rested at 7.5% overall. Alternative, shared, and coworking office space accounted for 3.3% of the total Manhattan office inventory, surpassing 16 million square feet in Q2.
Read on for more on how the NY traditional and coworking office market fared in Q2 2019, major deals closed, and new office developments coming online.
Manhattan Office Sales in Q2 Down 26% Y-o-Y
Following a strong 2018 that recorded over $15 billion in sales volume, activity on the Manhattan office market was notably slower during the first half of 2019. Investment activity in the first three months of this year was the second lowest in the past five years, second only to the Q3 2017 sales volume tumble. Activity picked up a little steam during the year’s second quarter, seeing an uptick both in number of deals closed and in dollar volume. Even so, the $1.9 billion worth of office assets to trade on the Manhattan office market in Q2 marked a 26% year-over-year drop in office sales.
Office Sale Prices Reach $556/Sq.Ft., Lowest in 5 Years
A total of nine office sales closed in Q2, encompassing 3.5 million square feet of Manhattan office space. The average price per square foot for a Manhattan office property decreased 37% year-over-year in Q2 2019, from $887 to $556. Prices rested at less than half of the peak values recorded in 2016, when NYC office assets traded for as much as $1,212 per square foot. In fact, office prices in Q2 marked the lowest per-square-foot-average in five years. Trends show that up to the start of last year, prices fluctuated above the $1,000 per-square-foot mark approximately every two quarters. For the past year, however, prices have been adjusting on a downward trend. Compared to the previous quarter, the average prices in Q2 were 27% lower.
Google Grows NYC HQ, Pays Top Dollar for Milk Building
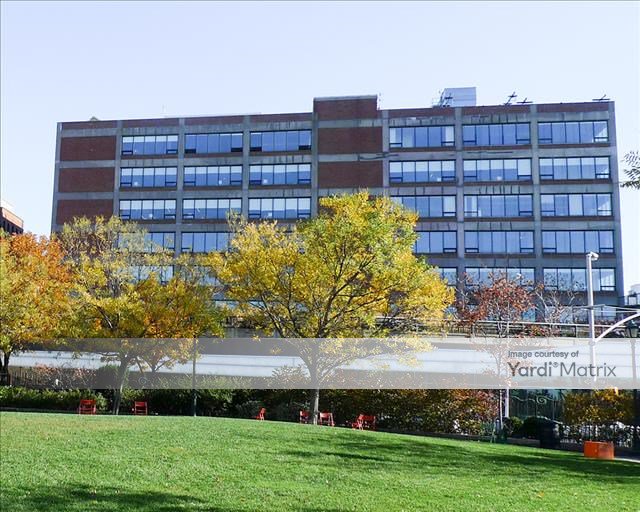
Milk Building, 450 West 15th Street, Manhattan, NY
The tech juggernaut that has become almost synonymous with the internet nabbed the Chelsea Market building for $2.4 billion, in what was the top office deal of 2018. In May of this year, Google acquired the neighboring Milk Building for close to $600 million, which ended up being the top office transaction of the quarter. The sale works out to $1,821 per square foot. Encompassing 325,000 square feet of Meatpacking District office space, the property was originally built in 1936 as a warehouse. At the start of the 1970s, it was converted to an arts, entertainment, and fashion center, and then, in a significant renovation, to office in 2014 by Jamestown. Convenient perk for the new owner: the Milk Building is connected to the Chelsea Market via skybridge.
The second-priciest office asset to change hands in Q2 was the Central Midtown office building at 521 Fifth Avenue. A joint venture between SL Green Realty Corp., LaSalle Investment Management, and Quantum Global Real Estate sold the 500,199-square-foot, Class A office building to NYC investor-developer Savanna. At just under $380 million, the deal works out to $758 per square foot.
SL Green Realty, the city’s largest office landlord, paid $272 million for the majority and controlling interest stake in the Master Printers Building at 460 West 34th Street. The transaction was the quarter’s third-largest office sale, and the company’s first major investment in the Hudson Yards neighborhood.
Average Asking Price for Trophy Office Space Hits $94/Sq.Ft.
The overall average asking full service rents for Manhattan office space in properties that are 25,000 square feet or larger rested at $75.60 per square foot at the close of Q2. Class A+ office space saw the most significant spike in rents, closing the quarter at $94.12 per square foot, which marked a 4% increase compared to the close of Q1. Class A office rents, however, marked a slight decrease of 1% from $69.29 per square foot at the close of Q1 to $68.42 per square foot at the close of Q2. Average asking rents for Class B Manhattan office space wrapped up Q2 close behind at $63.28 per square foot, while Class C office asking rents averaged $49.77 per square foot at the end of June.
Overall vacancy in the Manhattan office market was 7.50% at the close of the quarter. Trophy office space across the city was 93.30% occupied, while Class A properties were at 8.80% vacancy. Class B and Class C office properties wrapped up the year’s second quarter with 6.40% and 6.30% vacancy, respectively.
Non-Traditional Office Space Surpasses 16MSF in NYC
In 2012, Manhattan took the lead over other U.S. markets for most coworking spaces. According to the latest Yardi Matrix shared office space report, Manhattan remains the coworking capital of the country. Meeting the rising demand exerted by the growing entrepreneurial community has fueled the rapid, large-scale growth of collaborative space providers like Regus and WeWork into 100,000+ square-foot spaces. According to Yardi Matrix market data, shared and coworking office space in Manhattan has grown to just over 16 million square feet as of mid-July. While this represents only roughly 3% of the office market’s total inventory, the non-traditional office trend continues to expand at a fast pace, and its market share is poised to follow suit.
Chinatown Welcomes New Office Midrise, Hudson Yards’ Tallest Tower Opens for Business
Two office projects were delivered to market during Q2, the largest of which was the impressive 30 Hudson Yards. Officially completed in April, the 2.8 million-square-foot office tower topped out at a height of 1,296 feet last July. Tenants at the tallest tower of Related and Oxford Properties Group’s megaproject include Warner Brothers, which leases roughly 1.5 million square feet. Additionally, Wells Fargo Securities has over 500,000 square feet in the building, and global investment firm KKR occupies the top ten office floors, encompassing approximately 343,000 square feet.
New office developments are still a rarity in most other Manhattan neighborhoods, but one such gem was completed this past quarter, in June. The second Manhattan office project to come online in Q2 was the boutique office condominium built by Yeung Development at 100 East Broadway. Rising 14 floors and encompassing 63,732 square feet of office space, the multi-tenant Chinatown property also includes retail, dining, and three levels of parking on the first three floors.
More Hudson Yards office space is expected to come online during the current quarter with the Skidmore, Owings & Merrill-designed 35 Hudson Yards slated for completion this month. Containing nearly 557,000 square feet of commercial space, the building includes premium office space, retail, hotel, and amenities.
The Hudson Commons expansion is also scheduled to wrap up this month. The 17 additional floors constructed above the existing structure encompass 277,000 square feet of new office space. Cove Property Group and equity partner Baupost Group’s overhaul of the Ninth Avenue building was designed by Kohn Pedersen Fox and features 14 private terraces and a full suite of amenities, such as meeting room and conferencing facilities, tenant lounges, a bike room, and a 140-car garage.
Methodology
We used detailed Yardi Matrix data to analyze all office transactions with price tags equal to or exceeding $5 million to close in Manhattan during the second quarter of 2019. Our sales analysis, based on data recorded up until July 19, 2019, includes completed office buildings equal to or larger than 50,000 square feet that changed owners during the quarter. In the case of mixed-use assets, only properties featuring over 50% office space were taken into account. We counted portfolio deals as single transactions and excluded distressed sales altogether. To make sure the trends and comparisons presented in our analysis are valid, we excluded portfolio, partial interest and ground lease deals from our calculation of the average price per square foot. Lease rate, vacancy, and coworking space data refers to buildings equal to or larger than 25,000 square feet. Lease rates listed were averaged to the asking full service-equivalent rents per square foot for spaces recorded in Yardi Matrix as “available” up until July 19th.While every effort was made to ensure the timeliness and accuracy of the information presented in this report, the information is provided “as is” and neither CommercialCafe nor Yardi Matrix can guarantee that the information provided is complete.
Property images courtesy of Yardi Matrix.


Ioana Ginsac
Senior Content Writer, Industry News & Reports
Ioana is a content writer who has been covering all-things-CRE (and more) for several Yardi network publications since 2017. You will find her byline regularly in industry news and market reports, but also on articles covering sustainable development, green urbanism, and innovation, all of which she has been passionately learning about for more than a decade. Her work has been referenced by publications including AmericanInno, Bisnow, BusinessInsider, Commercial Property Executive, Curbed, Fast Company, Forbes, GlobeSt.