Manhattan Office Report – Q3 Sales Volume Takes a Tumble


Executive Summary
- sales volume dips below $1B mark for the first time in 5 years
- Q3 2017 sees average prices drop 19% year-over-year
- 375 Hudson Street fetches $465M in the biggest sale of the quarter
- 768 KSF One Soho Square on track for Q4 delivery
After a sluggish start to the year in Q1 and a lukewarm Q2, the Manhattan office market failed to regain traction in the year’s third quarter. With a tepid sales volume of $991 million and the lowest number of quarterly deals closed in the past five years, Q3 2017 might signal a return to normalcy for the highly sought-after Manhattan market. Having reached a five-year peak in the first months of 2015, when 21 office buildings traded for a total of over $10 billion, sales activity in the borough has been fluctuating and eventually winding down to much more sustainable levels this year.
Q3 Office Sales Volume Falls 67% Y-o-Y
The Manhattan office sales market showed a pronounced downward trend compared to the previous quarter, as Yardi Matrix data reveals. Total sales volume fell a sharp 67% year-over-year and 74% from Q2 to Q3, even though the number of transactions closed stayed roughly the same as in the previous quarter. Just six notable office deals closed in Manhattan during Q3 2017, totaling $991 million and 3.1 million square feet of space—a steep drop compared to Q2, when seven sales closed for $3.8 billion in volume and 5.9 million square feet. The year’s third quarter was in fact the weakest quarter of the past five years in terms of sales volume, dropping below the $1 billion mark for the first time.
Average Price per Square Foot Slides Back below $1,000
The average price per square foot for office buildings trading on the Manhattan market decreased 19% year-over-year and 21% compared to Q2, resting at $821 at the close of the year’s third quarter. The drop in prices is not, however, a signal that the market is losing its appeal, but rather a result of seasonality and reoccurring market fluctuations. The average price recorded in Q3 2017 is roughly on par with the average of the past five years.
The Largest Sale of Q3: 375 Hudson Street
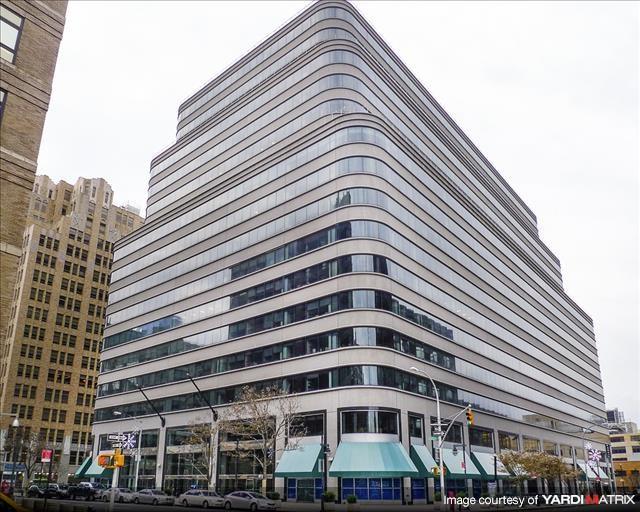
375 Hudson St., Manhattan (Yardi Matrix)
The largest office transaction closed during Q3 2017 in Manhattan was the $465 million sale of 375 Hudson St. in the Hudson Square submarket. The 19-story, 1 million-square-foot high-rise was acquired by Trinity Real Estate and Norges Bank in August, from seller Tishman Speyer. According to Yardi Matrix data, Trinity acquired a 51% interest in the Class A asset, while Norges Bank retained a 48% ownership stake following the deal. Hines Interests also acquired a 1% interest in the building.
Pipeline: 3M Square Feet of Office Space on Track for Q4
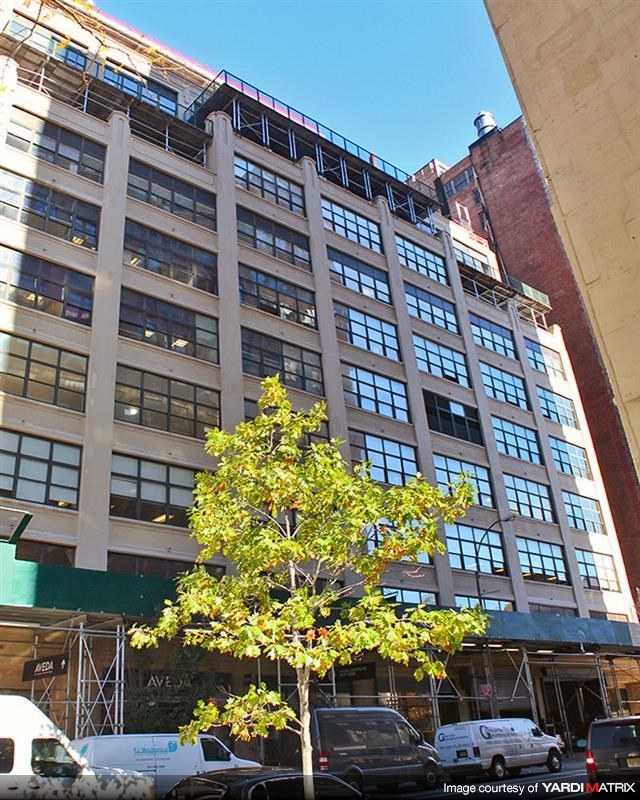
One Soho Square, Manhattan (Yardi Matrix)
There was a single office building totaling over 50,000 square feet to come online in Manhattan during Q3 2017, bringing the total market inventory to 465 million square feet. The next quarter looks more promising and is expected to deliver six new projects to the market, encompassing a total of 3 million square feet. The largest development scheduled for delivery in Q4 is the 768,000-square-foot One Soho Square, owned by Stellar Management and designed by Gensler. The spec project is set to include two 13- and 15-story buildings incorporating office and retail space, as well as a 26,079-square-foot showroom. MAC Cosmetics, Glossier, Trader Joe’s and Cineflix Enterprises have already signed on to occupy space within the new Hudson Square building.
Another notable project currently underway is the makeover of the Verizon Building at 375 Pearl St., at the Manhattan end of the Brooklyn Bridge. Originally built in 1975, the 32-story building owned by Sabey is undergoing a long-awaited revamp. Upon completion, the tower’s limestone facade will be traded in for floor-to-ceiling glass curtain walls, and the building will be used as office space and data storage.
Discover premium office listings across the U.S. with CommercialCafe.com. Use our interactive map and filters to find the best fit for your business needs:
Methodology
- Data source: Yardi Matrix;
- We considered transactions of completed properties, recorded up until October 9th, 2017;
- Minimum amount per transaction: $5,000,000;
- Square footage parameters: over 50,000 square feet;
- We count portfolio deals as single transactions;
- In the case of mixed-use assets, only properties featuring over 50% office space were taken into account;
- We excluded ‘ownership stake,’ ‘ground lease,’ ‘controlling interest,’ ‘portfolio’ and ‘undisclosed’ deals from our calculation of the average price per square foot;
- We excluded distressed sales.
By Ioana Neamt


Contributor
Our contributor content includes articles written by guest authors who are professionals in a variety of relevant fields and have contributed their expertise and detailed understanding of a range of topics, including: PropTech; real estate marketing tools and strategies, commercial real estate trends evolution; work-life balance management guidance and resources; workspace management and design; and more.