Which Cities Command the Highest Property Taxes for Office Buildings?


As the U.S. office market continues to thrive and investors keep pumping capital into this extremely profitable sector, there is a lot of talk regarding property taxes and their impact on the real estate environment. The decision to expand, invest or exit a particular city or market has to factor in all the costs–this, of course, includes state and local taxes.
Commercial property tax rates vastly differ from market to market, depending on how much that particular economy relies on property tax revenue, the varying property values, tax exemptions and incentives programs, and many other factors. The resulting difference in costs among markets can push companies to consider downsizing or even relocating to another city, where the costs of running a business are lower.
With a little help from Yardi Matrix and PropertyShark data, and a lot of combing through public tax records, we put together a list of the top 20 taxpaying U.S. office CBDs (central business districts). The list is arranged by the average taxes each CBD pays per 1,000 square feet of space (see ‘Methodology’). The list includes the most sought-after office investment markets in the country–check them out below, and see how much they each command in average yearly commercial property taxes.
New York City, DC CBDs Pay the Highest Property Taxes
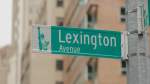
The New York City office market leads the pack and is basically in a league of its own. Its CBD houses 426 office buildings over 100,000 square feet, totaling 210 million square feet and commanding a yearly tax volume of $3.4 billion. This means that, as a property owner in the city’s core business district, you’ll need to pay an average of $16,302 in taxes per 1,000 square feet of office space. That’s much higher than what any other market on our list commands, once again emphasizing the fact that New York City is the most attractive office scene in the country. Taxes might be high here, but so are the returns and the investment opportunities.
The Washington, D.C., central business district comes in second, with an average of $10,247 in taxes per 1,000 square feet of prime office space. The CBD market boasts an office inventory of 78 million square feet, which commands $801 million in yearly property taxes. The District of Columbia enforces a tax rate of $1.65 for commercial properties with an assessed value below $3 million, and a tax rate of $1.85 for properties assessed above $3 million, according to public records.
Boston CBD Boasts High Taxes, Low Volume
Office properties within the Boston CBD command the third-highest property taxes among the markets we analyzed. At first glance, this might seem surprising, as the district’s office inventory totals just 22 properties and 7.8 million square feet, yet the average tax per 1,000 square feet is $8,609. The catch is that property taxes are a major source of revenue for Suffolk County in general–the current tax rate for commercial properties in the county is $25.37 per $1,000 in assessed property values. And that’s not even the highest rate in the state–Boston ranks 59th in the state in terms of commercial property tax rates, according to the Boston Business Journal. By comparison, the Miami office market, whose central business district boasts a similar square footage volume, commands an average of $3,717 per 1,000 square feet of space, landing the 12th spot on our list.
Austin and Houston CBDs Complete the Top 5
Two Texas contenders complete our top five, namely the Austin commercial real estate market, with an average tax of $7,827 per 1,000 square feet, and Houston, with an average tax of $7,280 per 1,000 square feet. The difference between the two markets becomes obvious when we look at the total CBD office inventory: Austin is home to 37 properties totaling 10 million square feet, while Houston’s central business district houses 50 office assets encompassing 41 million square feet. Property taxes will soon rise even higher in Austin, as the City Council recently voted to raise the tax levy by 11.2 percent, the Austin Daily Herald reports.
Chicago Boasts High Volume, Low Average Taxes
The Chicago Loop is home to the largest concentration of office space outside New York City, housing 143 properties totaling over 95 million square feet. And yet, the CBD fills the sixth spot on our list, commanding an average tax of $6,617 per 1,000 square feet of space. The Fort Lauderdale office market is a different story. With an average of $4,804 per 1,000 square feet of office space, the Fort Lauderdale CBD occupies the seventh spot on our list, even though it boasts the lowest office inventory among the top 20 markets presented in our chart above–3.5 million square feet across 14 properties.
Los Angeles CBD–Office Tax Haven?
If you’re looking to invest in California’s office real estate market, and you don’t want to spend too much on property taxes, then you might want to pick Los Angeles or Sacramento instead of San Francisco or San Jose. The San Francisco CBD boasts the highest average taxes for office properties in California, landing the 10th spot on our national chart. The average tax amount per 1,000 square feet here is $4,357, while San Jose follows close, with $3,794 on average. The Los Angeles commercial real estate market, on the other hand, commands an average of $3,042 per 1,000 square feet of office space, though it’s home to the largest office inventory among the Californian CBDs on our list–36.4 million square feet.
See a particular market missing from the top 20? Check out the full top 40 list
The top 20 positions on our list of average taxes paid per 1,000 square feet include most of the country’s most popular office markets. However, there are a few other markets that you might have expected to find higher up on this list–for example, Dallas or Philadelphia, each boasting over 25 million square feet of CBD office inventory.
Check out below the full list of the top 40 CBDs and the average property taxes they pay for 1,000 square feet of space:
Methodology
- Data sources: Yardi Matrix, PropertyShark, proprietary research;
- Square footage parameters: over 100,000 square feet;
- Property location filter: CBD primary;
- The average tax amount was calculated for all properties taking into account the above-mentioned criteria;
- Tax values were verified against Assessor and Tax Treasurer official public websites;
- Tax records may present a 0% to 15% error margin.
By Ioana Neamt


Contributor
Our contributor content includes articles written by guest authors who are professionals in a variety of relevant fields and have contributed their expertise and detailed understanding of a range of topics, including: PropTech; real estate marketing tools and strategies, commercial real estate trends evolution; work-life balance management guidance and resources; workspace management and design; and more.