California Q1 2018 Office Sales: Smaller Markets Pick Up the Slack for LA, San Francisco


Executive Summary
- Q1 Overview: Sacramento posts highest growth in dollar volume, average prices
- Los Angeles on cooldown after hot Q4 2017
- Bay Area office sales drop below $1B after 2-year streak
- Sacramento average prices reach 5-year high; sales spike 96% y-o-y
- Orange County prices inch above $300 per square foot
- San Francisco office sales down 88% y-o-y in Q1
- San Diego closes quarter with 2nd-lowest dollar volume in 5 years
Q1 Overview: Sacramento Posts Highest Growth
In terms of office sales, Los Angeles was the most active California market we analyzed, wrapping up Q1 with a $1.3 billion total. Bay Area office sales raked in $800 million in 13 transactions, which encompassed over 2 million square feet of inventory. Even though Sacramento came in third, this market posted the highest growth of the quarter—a 96% year-over-year increase in sales. As Sacramento office properties continued to attract significant investor interest and capital, market performance surpassed the peak values recorded in Q2 2017.
Sales activity was slowest during Q1 in the San Francisco, San Diego and Inland Empire office markets. San Francisco sales continue to tumble—so much so, that the market concluded Q1 with an 88% drop year-over-year. It remained, however, the priciest of the seven office markets we looked at for this report, and considerably ahead of the other six. San Diego began 2018 with the breaks still on and wrapped up Q1 with its second-lowest sales volume on record, and with a significant year-over-year decrease in prices.
Though the overall Orange County sales performance did not stand out this past quarter, the market fared well in terms of average price per square foot, which registered a 34% increase year-over-year, and marked the second time in five years that the average price inched above $300 per square foot. Due to low sales activity, no average price per square foot could be calculated for the Inland Empire office market in Q1.
Top Q1 Deals—Bay Area Property Sells for Upwards of $2,000 per Sq. Ft.
A total of 56 deals closed on the seven California office markets during this year’s first quarter, amounting to just over $3 billion. While quarterly sales activity varied greatly among the markets we analyzed, there was no attention-grabbing transaction in Q1, as no individual office asset traded for more than $200 million.
However, as the larger California office markets seem to still be cooling off and adjusting after a hot couple of years, investor choices are making waves on the smaller arenas. Shorenstein paid $161 million for one of Sacramento’s few Class A trophy office towers, a sale which accounted for nearly half of the market’s Q1 sales volume.
American Realty Advisors paid nearly $140 million for a 3-story, 60,000-square-foot mixed-use property in Palo Alto. The Mayfield property was developed by The Minkoff Group and completed in 2016—the great location, the fact that VISA crowns the tenant roster, and the wide variety of amenities available within walking distance are a few reasons why the price tag of $2,165 per square foot was well worth it.
Los Angeles Sales on Cooldown after Hot Q4 2017
Activity in the Los Angeles office market cooled significantly during Q1 2018, following the nearly record-breaking $3 billion sales volume gathered in Q4 2017. The 21 transactions that closed during 2018’s first quarter totaled $1.3 billion, marking a 20% year-over-year decrease in sales volume. While not among the market’s best performing quarters, sales in Q1 remained above the $1 billion threshold.
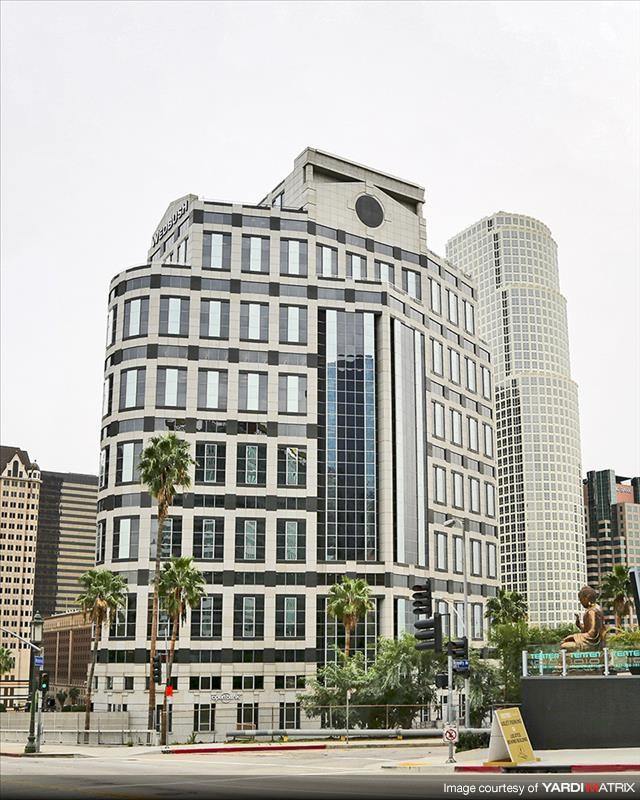
Wedbush Center, 1000 Wilshire Blvd, Los Angeles, CA (courtesy of Yardi Matrix)
In terms of the average price per square foot, the L.A. office market wrapped up Q1 at $375. Marking a 34% year-over-year increase, Q1 prices rested comfortably above the five-year average, even though they dropped 11% compared to the previous quarter.
Just under 3.4 million square feet of inventory changed hands in the first three months of the year. In a market where over 4 million square feet of office space are traded per quarter on average, this metric shows further proof that Los Angeles office sales cooled significantly after an exceptionally hot final quarter of 2017.
The priciest office asset to sell in Los Angeles so far this year was the Wedbush Center at 1000 Wilshire Blvd. The 21-story Class A Downtown Los Angeles office building commanded $196 million in February, when it was acquired by New York-based private investment firm Cerberus Capital Management. Previous owner Lincoln Property Co. had recently completed a $4 million property renovation, which repositioned the building’s ground floor lobby areas, and added a full-service bar and café and restaurant amenity. According to sale advisor NKF Capital Markets, the freeway-adjacent DTLA landmark sold at 86% occupancy, and boasts a strong tenant roster anchored by financial services firm Wedbush Securities.
Bay Area Office Sales Dip Below $1B after 2-Year Streak
Office sales in the Bay Area have dropped below the $1 billion mark for the first time in two years, in a steep 37% decrease year-over-year—13 major deals totaling just over $800 million closed between January and March 2018. However, data trailing five years shows that Q1 tends to be the market’s slowest, so Bay Area office sales should rebound in the coming months.
The average price per square foot recovered from the previous quarter’s dip below the $300 mark. Average prices rested at $391 at the close of Q1 2018, climbing 18% year-over-year, and 35% compared to Q4 2017.
Nearly 2.2 million square feet of Bay Area office space changed hands during 2018’s first quarter. Developers managed to (almost) keep up, as 1.7 million square feet of new product was already brought to the market this year.
In the largest deal to close during Q1 in the Bay Area, a Palo Alto office building occupied by a VISA R&D unit was reportedly purchased for $138 million in cash. The buyer, SVF Sherman Palo Alto, is associated with American Realty Advisors, and the property in question is 385 Sherman Avenue. Completed in 2016 by The Minkoff Group, this 68,164-square-foot mixed-use property boasts excellent accessibility, was designed to achieve LEED Gold certification, and includes two levels of sub-grade parking, as well as several residential units. Even considering Palo Alto’s almost mythical appeal to techies and the fact that it continues to be a particularly strong market, this sale is one of few to have fetched more than $2,000-per-square-foot.
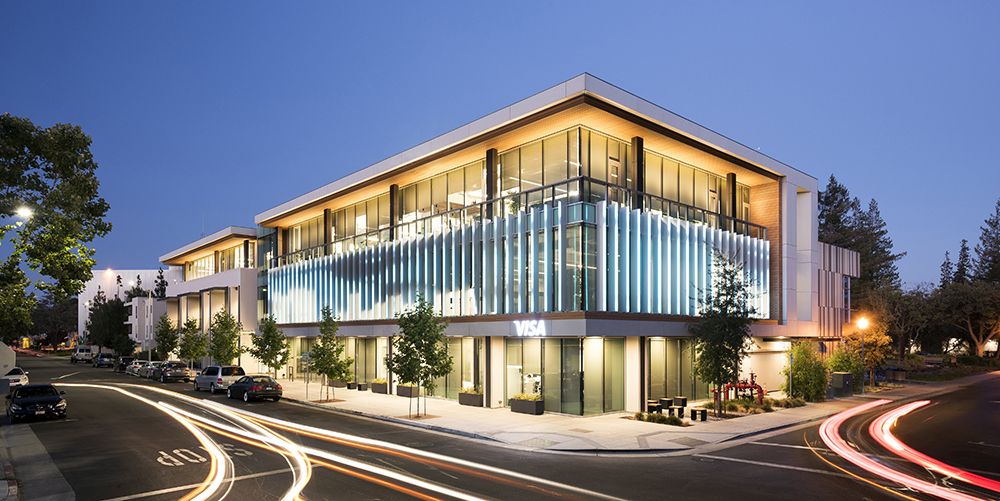
385 Sherman Avenue, Palo Alto, CA (image courtesy of The Minkoff Group)
Sacramento Office Sales Spike 96% Y-o-Y; Average Prices Reach 5-Year High

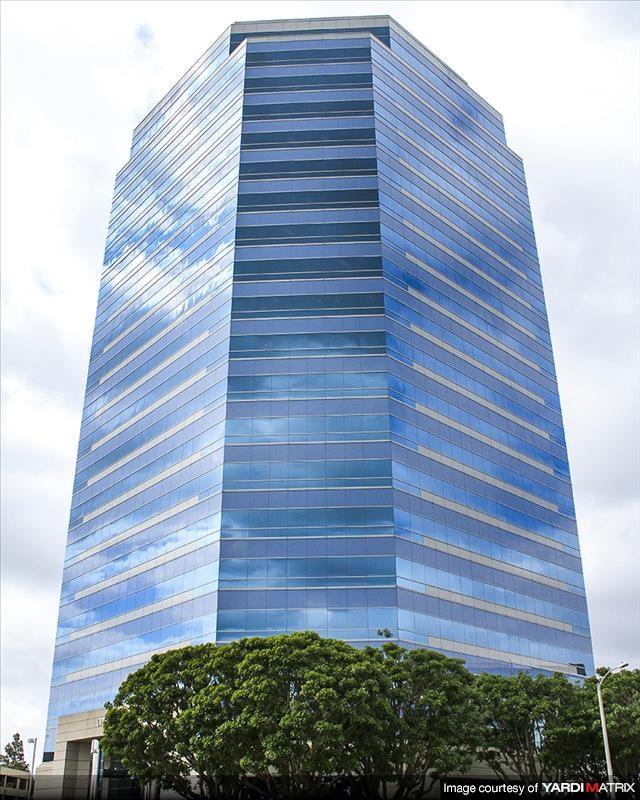
U.S. Bank Tower, 621 Capitol Mall, Sacramento, CA (courtesy of Yardi Matrix)
The Sacramento office market was still looking up at the close of this year’s first quarter. Office sales picked up steam by the end of last year, and the market fared even better over the course of Q1 2018. Seven major deals closed for a total of $352 million—a 45% uptick compared to the previous quarter, and a 96% increase year-over-year.
Notably, the average price per square foot reached a five-year high, shooting up 174% compared to Q1 2017. The average price rested at $346 at the close of Q1, marking the second time in five years that Sacramento office prices exceeded $300 per square foot.
Office sales activity at the start of the year showed there is significant interest in Sacramento office space—nearly 1.7 million square feet of inventory traded in the first three months of the year, which was 18% more than in Q1 2017, and 26% more than the inventory traded in Q4 2017.
The top transaction of the quarter was Shorenstein’s purchase of the U.S. Bank Tower in Downtown Sacramento. Closed with a price tag of $161 million, this deal accounted for nearly half of the market’s quarterly sales volume. JLL Executive VP Rob Cole told the Sacramento Business Journal that “the broad depth of investor interest that the property received is a reflection of the strengthening position of the Sacramento market.” Co-developer and former co-owner of the 26-story Class A trophy tower, Britannia Pacific Properties, has also expressed confidence in the market’s potential: “Sacramento has been a great investment market for the group and we look forward to recycling the proceeds into other local developments over the next few years.”
Orange County Average Office Prices Inch above $300 per Sq. Ft.
City Tower, 333 City Blvd West, Orange, CA (courtesy of Yardi Matrix)
Even though the $266 million amassed in Q1 office sales marks a 16% year-over-year decrease, this tally represents a solid start to the year for the Orange County office market. Notwithstanding the occasional surges in quarterly sales, the Q1 dollar volume is not a far throw from the five-year average.
Sales closed between January and March encompassed nearly 973,000 square feet of office space—a 27% year-over-year drop and unusually slow for a market where at least 1.2 million square feet of product is moved each quarter.
The average price per square foot, however, has been holding above $200 for eight consecutive quarters. Resting at $314 per square foot, the Q1 average price represents the second time in five years that this metric has surpassed the $300 mark.
Of the five major transactions recorded in Q1, the priciest O.C. office asset was City Tower. Commanding more than $338 per square foot, the 20-story, LEED Gold-certified Orange City office tower was purchased by KBS Capital Advisors for $147 million. The property recently underwent a $3 million renovation program that included upgrades to the lobby, corridors, and elevator cab interiors. According to sale advisors with NKF Capital Markets, the tower was 78% leased at the time of sale, with the roster featuring notable tenants like UC Irvine Medical Center, Enterprise Rent-A-Car, Travelers Insurance and York Risk Services Group.
San Francisco Office Sales down 88% Y-o-Y in Q1
San Francisco office sales have been yo-yoing for the past year and a half. During this year’s first quarter, the San Francisco office market fared worse than the record low of Q4 2017—Q1 2018 concluded with a steep 88% year-over-year drop in sales of properties larger than 50,000 square feet. Only four deals closed on the market through March, totaling $209 million, and encompassing just over 372,000 square feet.
In terms of the average price per square foot, however, San Francisco remains by far the priciest market. Although it slipped 5% year-over-year in Q1, San Francisco’s average office price of $561 per square foot still has no contender in sight among California’s office markets.
The largest deal to close in Q1 was Kilroy Realty Corp.’s purchase of the Oyster Point Tech Center. Located on the north end of the thriving South San Francisco submarket, this three-building, 146,000-square-foot laboratory and office project sold for $111 million. According to KRC statements released at the time of sale, two-thirds of the project was leased on a long-term basis to an investment-grade, global health care diagnostics company.
San Diego Scores 2nd Lowest Quarterly Sales Volume in 5 Years
Gateway at Torrey Hills North, 3580 Carmel Mountain Road, San Diego, CA (courtesy of Yardi Matrix)
While still coming down from its record-hot Q3 2017, the San Diego office market almost fell into the other extreme and wrapped up this year’s first quarter with the second-lowest sales volume since Q1 2014. The five deals to close during Q1 2018 raked in just over $151 million in office sales, marking a steep 60% decrease year-over-year, and an almost 70% drop compared to the previous quarter. Sales recorded in San Diego often exceed $300 million per quarter, according to sales data trailing five years, proving that this market maintains healthy fundamentals, regardless of the occasional hiccups.

Gateway at Torrey Hills South, 3570 Carmel Mountain Road, San Diego, CA (courtesy of Yardi Matrix)
The average price per square foot followed sales volume on a downward trend, dropping 35% and resting at $160 at the end of Q1. This also marks the first time in two years that San Diego office prices slipped below the $200-per-square-foot threshold.
San Diego’s priciest sale of the quarter accounted for nearly 70% of the total Q1 2018 sales volume—in January, the Irvine Co. paid $105 million for the 197,832-square-foot Gateway at Torrey Hills office complex. The Class A property is conveniently located along Interstate 5 and includes the four-story Gateway at Torrey Hills North and Gateway at Torrey Hills South multi-tenant office buildings. The working community is located in Del Mar Heights—one of San Diego county’s most desirable submarkets—and was 80% leased at the time of sale, according to the Cushman & Wakefield Capital Markets team that represented the seller.
Silicon Valley Development Drives the California Office Pipeline in Q1
Just over 2 million square feet of new office space was delivered during the first three months of the year, with 84% of it located in the Bay Area—the busy South Bay-Peninsula office pipeline churned out 1.7 million square feet of new inventory during Q1 and is scheduled to yield 6 million more during Q2.
Notable projects completed by the end of March include Apple’s new campus, Central and Wolfe, in Sunnyvale, Calif. The 882,857-square-foot clover leaf-shaped corporate campus built by Level 10 opened its doors early this year. Designed by architecture firm HOK, the property raises the bar even higher for Silicon Valley—the LEED Platinum campus consists of three architecturally dramatic structures, a stand-alone amenity building and a seven-story parking structure.
Only 200,000 square feet of new product was brought to the Los Angeles market through March, while nearly 3.4 million square feet of office space traded during Q1. Completed projects include the 75,000-square-foot creative office property at 5500 West Jefferson. The Gensler-designed building was developed by a Hackman Capital Partners affiliate, which transformed a 1940s industrial warehouse into an ultra-modern workplace that Apple was reportedly eyeing last year for its original content division.
While just under 140,000 square feet of new office space was delivered to the San Francisco office market during Q1, over 5.5 million square feet of new product is slated to come online during Q2. Boston Properties’ Salesforce Tower, newly crowned tallest-building in San Francisco, topped out last year at 1,070 feet and 61 stories, and is scheduled for completion by the close of this month. Encompassing over 1.4 million square feet, the Yerba Buena office tower is only overshadowed by Apple’s now infamous 2.9 million-square-foot Cupertino spaceship campus, which is also slated for completion before May.
Methodology
For this report, we relied on Yardi Matrix data to analyze all office transactions to close in the Bay Area, Inland Empire, Los Angeles, Orange County, Sacramento, San Diego and San Francisco office markets during the first quarter of 2018 (January through March), and we selected only those carrying price tags equal to or larger than $5 million each. Our research, based on sales data recorded up until April 10th, 2018, includes completed office buildings that are equal to or larger than 50,000 square feet. Regarding mixed-use assets, only properties including over 50% office space were taken into account. Portfolio deals were counted as single transactions, while distressed sales were excluded altogether. To ensure the trends and comparisons presented in our report are valid, we excluded ‘ownership stake,’ ‘ground lease,’ ‘controlling interest,’ ‘portfolio’ and ‘undisclosed’ deals from our calculation of the average price per square foot.
Although we have made every effort to ensure the accuracy, timeliness and completeness of the information included in this report, the data is provided “as is” and neither CommercialCafe nor Yardi Matrix can guarantee that the information provided herein is exhaustive.


Ioana Ginsac
Senior Content Writer, Industry News & Reports
Ioana is a content writer who has been covering all-things-CRE (and more) for several Yardi network publications since 2017. You will find her byline regularly in industry news and market reports, but also on articles covering sustainable development, green urbanism, and innovation, all of which she has been passionately learning about for more than a decade. Her work has been referenced by publications including AmericanInno, Bisnow, BusinessInsider, Commercial Property Executive, Curbed, Fast Company, Forbes, GlobeSt.