California Q4 2017 Sales Report—Office Investment Still on Cooldown


Executive Summary
- Los Angeles average price per square foot climbed to $469;
- Bay Area office investment reached highest dollar volume in 5 years;
- San Diego sales activity cooled down after red-hot Q3;
- Sacramento office investment tripled compared to Q3;
- San Francisco wrapped up slowest quarter in 5 years;
- Orange County office sales slipped during Q4;
- Q4 office sales concluded good year for the Inland Empire.
California’s markets have continued cooling down from the overall intense investment activity seen across the board during 2016. Roughly $22 billion in sales volume was accumulated in 288 major 2017 deals, across the 7 office markets we looked at. This signifies a 17% decrease in sales, compared to the previous year’s roughly $26 billion volume. California sales closed during 2017 encompassed 60 million square feet of office space, which was 11% less than the 68 million square feet of inventory that changed hands during 2016.
Q4 Overview: Los Angeles, Sacramento Sales Spike
According to Yardi Matrix data, all the California office markets we analyzed recorded a drop in sales from Q3 to Q4, with the exception of Los Angeles and Sacramento, which saw an uptick in investment activity. Additionally, L.A. and the Bay Area were the only two markets to draw the quarterly tally above the $1 billion mark. Wrapping up Q4 with $407 million in sales, the San Diego office market cooled down after a red-hot Q3. Sales activity during Q4 was slowest in the Inland Empire, Orange County and San Francisco office markets, with San Fran wrapping up its slowest quarter on record.
In terms of the average sale price per square foot, the Los Angeles office market was the only one to see an increase during Q4, with prices climbing to $469. The Bay Area came in second, with an average price of $293 per square foot, followed by San Diego ($252 per square foot) and Sacramento ($184 per square foot).
Just over 13 million square feet of office space changed hands during last year’s fourth quarter, 46% of which traded in L.A.—more than the inventory sold in the next two office markets combined (Bay Area and San Diego).
Suburban Office Assets Take the Cake in Q4
A total of 56 office deals closed during Q4 2017 in California, amounting to just over $4.3 billion in sales volume. This marked a 49% year-over-year decrease from Q4 2016. The largest quarterly sales in each market were suburban office properties, the exceptions being the Riverpark Towers in downtown San Jose and the Natomas Corporate Center in Sacramento. The Pacific Corporate Towers, located in the L.A. suburb of El Segundo, traded in the largest deal of the quarter, marking also the largest California office sale of the year. The top Q4 office transaction in San Francisco was Gemini Rosemont’s purchase of 600 Clipper Drive in Belmont, while the largest trade on the San Diego office market was that of a 10-building portfolio located in the Mission Valley East and Sorrento Valley office submarkets.
Nearly half of the top 10 California office sales of the year were recorded on the Los Angeles market. San Francisco takes second place, as it was home to three of the year’s priciest office transactions. Q3 was the Bay Area’s best performing quarter in 2017, with one deal closed in September landing second spot in our top 10, very closely behind number one. Last but not least, the $443 million August sale of the Five Point Gateway portfolio also secured a spot for the Orange County office market in the 2017 Top 10.
Read on to learn more about how each market concluded the year, as well as what the California office pipeline delivered and what’s expected in 2018.
Average Price Per SqFt Climbs to $469 in Los Angeles
Pacific Corporate Towers, 100-200 North Sepulveda Blvd (Yardi Matrix)
Los Angeles was the only one out of the seven California office markets we researched to see an uptick in the average price per square foot during Q4 2017. This metric was on a steady rise throughout the year, wrapping up Q4 at $469 per square foot—just 9% below the peak value recorded in Q4 2016.
With regard to sales volume, the past quarter marks L.A.’s second Q4 in five years to close above the $2 billion mark, 21% behind the $2.7 billion in sales recorded during Q4 2016. Although it wasn’t one of the market’s best quarters overall, sales amassed during Q4 2017 were noticeably above average.
Over 6 million square feet of inventory changed hands on the Los Angeles office market between October and December 2017. As usual, L.A. takes the “top deal” award—Starwood Capital Group paid $605 million for BlackRock’s three-building, 1.6 million-square-foot office complex known as Pacific Corporate Towers, marking not only the biggest sale of Q4, but also California’s largest office sale of the year.
Transactions closed on the Los Angeles market in 2017 amounted to $7 billion in sales—
Q4 Sales Push Bay Area Office Investment to Highest Dollar Volume in 5 Years
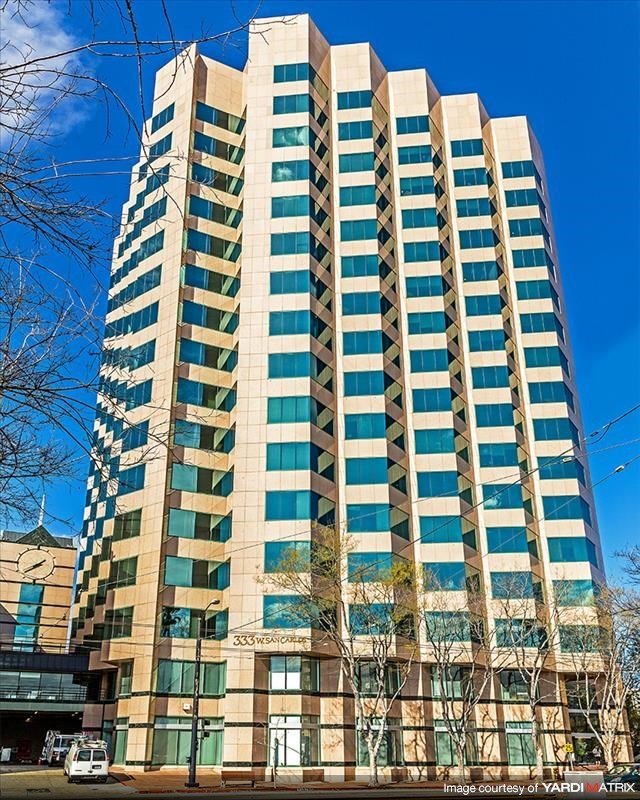
Riverpark Tower I, 333 West San Carlos Street, San Jose (Yardi Matrix)
The Bay Area office market concluded Q4 2017 with 14 transactions closed and $1.4 billion in sales volume—marking a 29% drop compared to Q3 and a 17% year-over-year decrease.
As to the average sale price per square foot, Q4 ended a good six-quarter streak, as prices finally dipped below the $300 mark. The average price per square foot for office assets trading in the Bay Area fell 19% year-over-year and a sharp 27% compared to the previous quarter, resting at $293 at the close of December 2017.
Close to 4 million square feet of space traded in Q4, which is roughly on par with the numbers recorded in the past five years. The largest of the 14 transactions closed in Q4 was recorded in December, when DivcoWest and the Rockpoint Group paid $284 million for SteelWave’s RiverPark Towers I and II in downtown San Jose. Built 22 years apart, the granite-clad, 16-story towers encompass roughly 603,000 square feet of Class A office space.
Total office investments in the Bay Area in 2017 raked in nearly $6 billion—the highest dollar volume of the past five years, proving that the market has not lost its appeal to buyers. Even though the 2017 average sale price per square foot ($339) slipped 1% compared to 2016 ($342), an overall increase in office investment activity made up for it. Nearly 16 million square feet of Bay Area office space changed hands in 2017 (7% more than in 2016), while the total sales volume also rose 17% compared to the previous year.
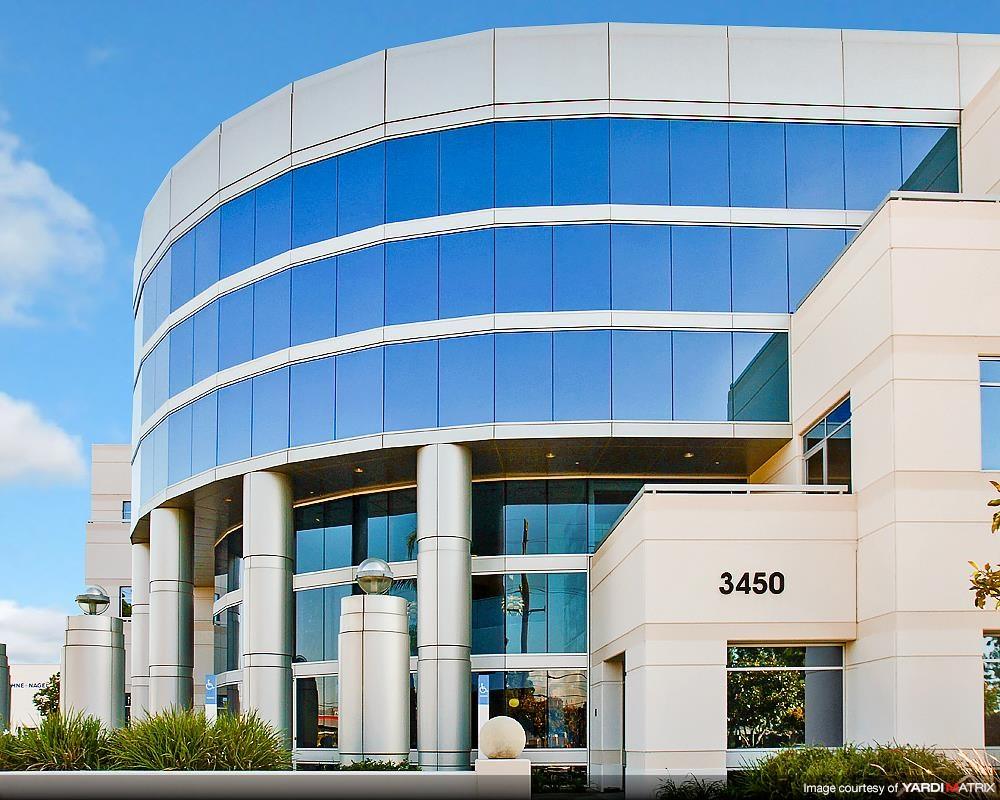
San Diego Sales Activity Cools Down After Hot Q3
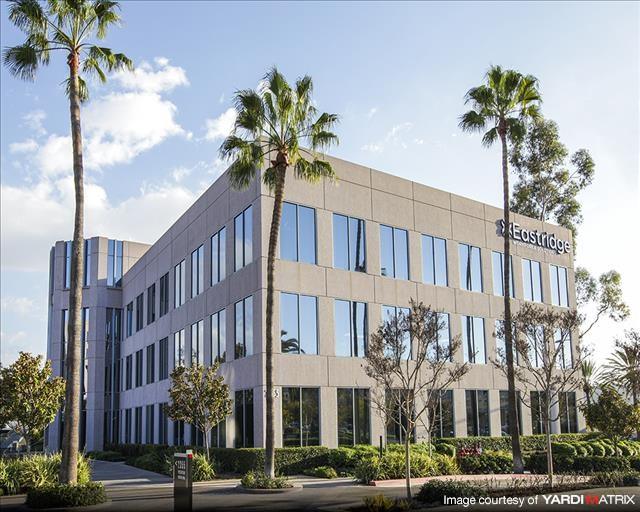
Mission City Corporate Center, 2355 Northside Dr, San Diego (Yardi Matrix)
After reaching a two-year peak in Q3, the San Diego office market wrapped up Q4 2017 with $450 million in sales volume—a 58% drop compared to the previous quarter and a 26% year-over-year decrease.
Q4 was the eighth consecutive quarter with an average sale price holding well above $200 per square foot. The market concluded the year’s final quarter with an average price per square foot of $252, marking a modest 7% increase year-over-year.
San Diego’s biggest deal of the quarter closed in October, when Canadian REIT City Office entered the California market with a hefty portfolio buy. The Vancouver-based investor paid $175 million for the 10-building Mission City Corporate Center and Pacific Center Court office portfolio.
Despite quarterly fluctuations, 2017 was a pretty good year for the San Diego market. The yearly sales volume added up to $1.8 billion, which is the market’s second-highest in 5 years, and 11% more than the 2016 investment total. What’s more, the sales price per square foot in 2017 passed the $300 mark and reached a five-year peak, averaging $311 per square foot—14% higher than the numbers recorded in 2016.
Sacramento Office Investment Triples Compared to Q3
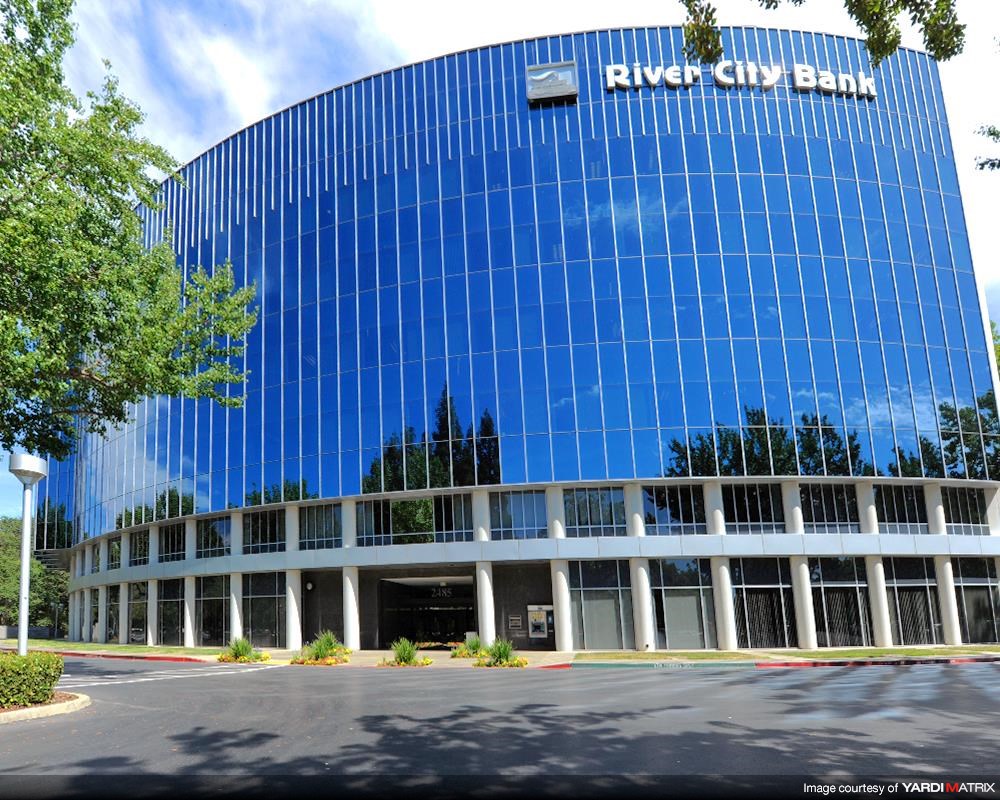
Natomas Corporate Center, 2485 Natomas Park Dr., Sacramento (Yardi Matrix)
Office investment activity on the Sacramento market picked up steam after a disappointing Q3, closing the quarter with $198 million in sales. While the Q4 dollar volume swelled compared to Q3, it rested a full 55% below Q4 2016 values. Ample fluctuations, however, are not unusual on a smaller office market like Sacramento.
The average price per square foot also took a downward turn, falling 24% year-over-year to $184.
Of the six transactions to close in Sacramento during Q4, the priciest deal was recorded in November, and accounted for nearly 30% of the total quarterly sales volume. Evergreen Co. paid $56 million for the Natomas Corporate Center—a Class A, institutional-quality two-building office portfolio totaling 293,000 square feet.
Investments on the Sacramento office market amounted to an annual dollar volume of nearly $700 million. While Sacramento doesn’t attract the same amount of capital as Los Angeles or the Bay Area, the market managed to tick off its second-highest sales volume in 5 years. At 20 major deals closed and 3 million square feet of office space transacted, 2017 was overall an OK year for Sacramento.
San Francisco Wraps Up Slowest Quarter in 5 Years
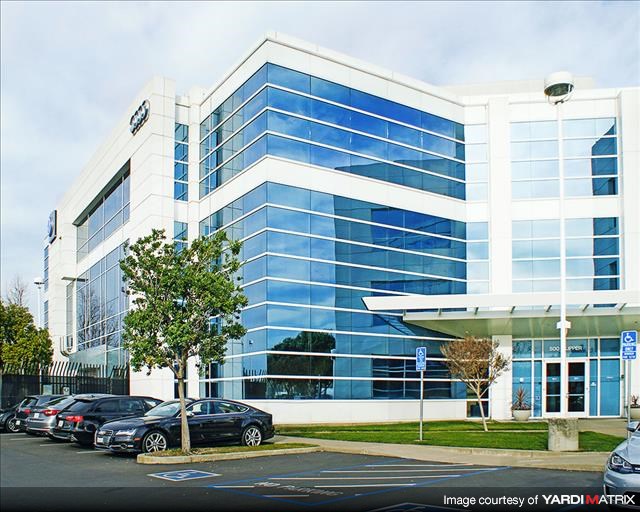
600 Clipper Dr., Belmont (Yardi Matrix)
Office sales activity on the San Francisco market has been slowing since Q4 2016 and hit the brakes during Q4 2017. December concluded the market’s slowest quarter in the past five years, with a sales volume of $105 million amassed in only two transactions. With that, sales took a 96% year-over-year tumble in Q4, with less than 300,000 square feet of office space changing hands.
Due to low office sales activity, no reliable average price per square foot could be calculated for the San Francisco office market in Q4 2017. The largest sale of the quarter was recorded in October, when Gemini Rosemont completed the acquisition of the 158,269-square-foot Class B office building at 600 Clipper Drive in Belmont, for upwards of $89 million.
A total of 29 major deals closed on the San Francisco market in 2017, adding up to an annual sales volume of $3.6 billion—a steep 58% drop compared to 2016, and the second-lowest dollar volume, according to data going back five years. Even though investment activity slowed significantly in 2017, San Francisco remains California’s priciest office market, with an annual average of $552 per square foot.
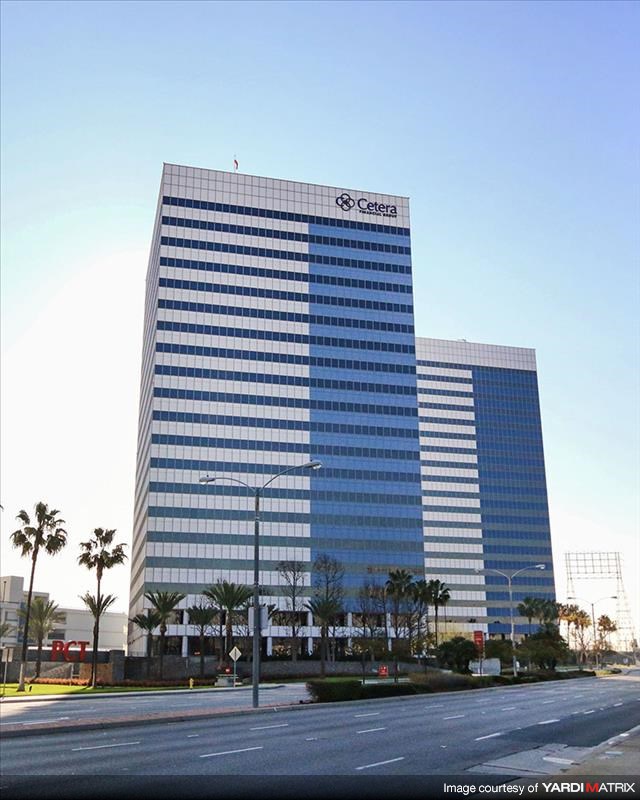
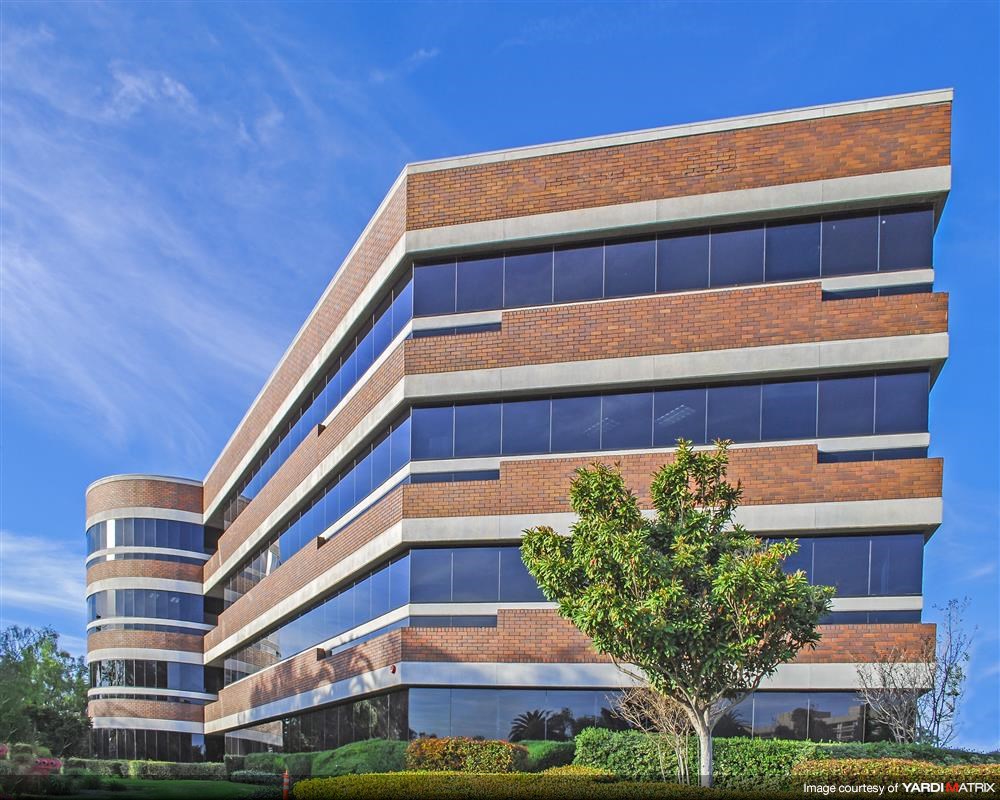
Orange County Office Sales Slip During Q4
PacSun Corporate HQ, 3450 East Miraloma Ave., Anaheim (Yardi Matrix)
The Orange County office market wrapped up the year with an unusually slow final quarter. With $63 million in sales, Q4 2017 marked a 91% year-over-year drop. Moreover, the dollar volume amassed during last year’s final quarter is a mere 4% of the total 2017 O.C. office sales volume.
Three transactions of assets larger than 50,000 square feet were completed between October and December 2017, encompassing nearly 400,000 square feet. With that, the average price per square foot slipped back below the $300 mark, and rested at $203 per square foot, marking a 26% year-over-year decrease.
The biggest deal to close in Q4 accounted for 43% of the total quarterly sales volume—The Pacific Sunwear Global Headquarters building in Anaheim commanded $27 million, which Hines and Oaktree paid in October, checking off the joint venture’s ninth acquisition in 6 years on the North Orange county submarket.
Despite a strangely sluggish Q4, total sales recorded on the Orange County office market in 2017 amounted to $1.8 billion, marking the second-highest sales volume in the past five years. Both dollar amount and sales prices inched upwards last year—total 2017 O.C. office investments were 4% higher than in 2016, and the average sale price reached a five-year record of $247 per square foot.
Q4 Office Sales Conclude Good Year for the Inland Empire
Empire Corporate Center, 800 North Haven Ave., Ontario (Yardi Matrix)
Although Q4 was the slowest quarter of the year for the Inland Empire office market, it closed what turned out to be a pretty good year overall. The $29 million in sales amassed during Q4 were just enough to nudge the yearly sales total to $324 million, roughly on par with the 2015 volume—not bad for a primarily industrial real estate market.
Two major office transactions closed during Q4, totaling roughly 147,000 square feet. Due to such low office sales activity, no reliable average price per square foot could be calculated for the Inland Empire office market in Q4 2017. However, it is worth noting that the largest office sale of the quarter commanded $16.5 million—TA Associates Realty sold the Empire Corporate Center in Ontario to MGR Real Estate, in October.
California Q4 Office Completions and 2018 Pipeline
Notable projects that were completed during the year’s final quarter include The Boardwalk and two buildings of the Five Point Gateway project, the three totaling 1.2 million square feet, located in Irvine. The Bay Area also welcomed two new projects in Q4: the 496,500-square-foot Endeavor in Santa Clara and the 229,000-square-foot America Center II in San Jose.
California’s office markets yielded roughly 13 million square feet of new office inventory, combined. The sprawling Bay Area market welcomed the most new office space last year and is poised to hold first place this year, with roughly 10 million square feet already on track for delivery before the end of December 2018. Despite a very slow final quarter in terms of sales, the San Francisco market has 8.4 million square feet of office space in the pipeline, scheduled for completion during this year.
Methodology
For this report, we relied on Yardi Matrix data to analyze all office transactions to close in the Bay Area, Los Angeles, Orange County, Sacramento, San Diego and San Francisco office markets, during the fourth quarter of 2017 (October through December), and we selected only those carrying price tags equal to or larger than $5 million each. Our research, based on sales data recorded up until January 1st, 2018, includes completed office buildings that are equal to or larger than 50,000 square feet. In the case of mixed-use assets, only properties made up of over 50% office space were included in the analysis. Portfolio deals were counted as single transactions, while distressed sales were excluded altogether. To ensure the trends and comparisons presented in our analysis are valid, we excluded portfolio, partial interest and ground lease deals from our calculation of the average price per square foot.


Ioana Ginsac
Senior Content Writer, Industry News & Reports
Ioana is a content writer who has been covering all-things-CRE (and more) for several Yardi network publications since 2017. You will find her byline regularly in industry news and market reports, but also on articles covering sustainable development, green urbanism, and innovation, all of which she has been passionately learning about for more than a decade. Her work has been referenced by publications including AmericanInno, Bisnow, BusinessInsider, Commercial Property Executive, Curbed, Fast Company, Forbes, GlobeSt.