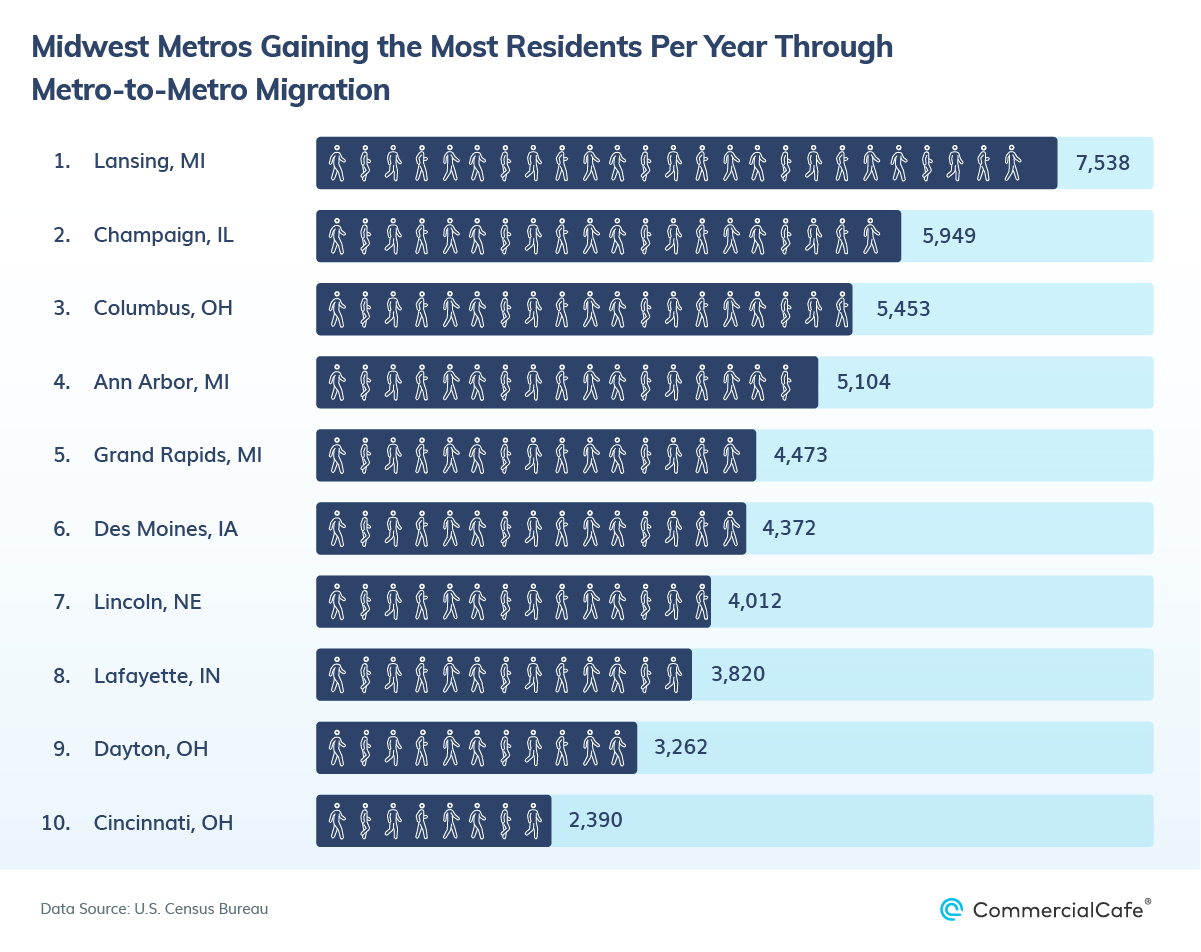
Which Midwest Metro Areas Are Gaining the Most Residents from Other Metros?


The U.S. Census Bureau recently released data on national metro-to-metro migration trends, which showed that metros such as Phoenix; Inland Empire, Calif.; and Dallas were drawing the most residents from other areas of the country.
However, while metros in the Sun Belt are attracting the most residents overall, certain areas in the Midwest are also attracting residents from other Midwestern metros. In fact, the best-performing Rust Belt cities already proved that many areas in the Midwest have successfully revitalized their economies. Specifically, smaller metro areas with budding STEM sectors are attracting the most movers at the state or regional level due to a combination of factors, ranging from job opportunities and affordability to urban renewal efforts.
#1 – Lansing, Mich.
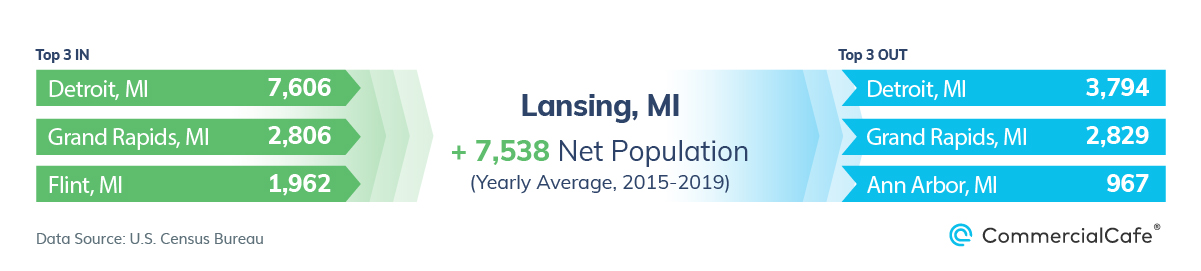
Lansing, Mich., was the fastest-growing Midwest metro with an average of 7,538 net residents gained per year through metro-to-metro migration. Notably, the state capital gained the most residents from Detroit, although other metros in the state also contributed to its growth. Meanwhile, the area’s population exchanges with Grand Rapids, Mich., stayed mostly flat.
Home to many of the state’s government institutions, the Lansing metro area — also known as Mid-Michigan — is culturally and economically significant. However, Lansing is also a college town: It’s home to Michigan State University, as well as many other institutions of higher education. Other factors that drive employment in the metro — such as several major General Motors operations and a robust insurance sector — also boosted Lansing’s domination in metro-to-metro migration within Michigan, making it the Midwest’s fastest-growing metro from this source.
#2 – Champaign, Ill.
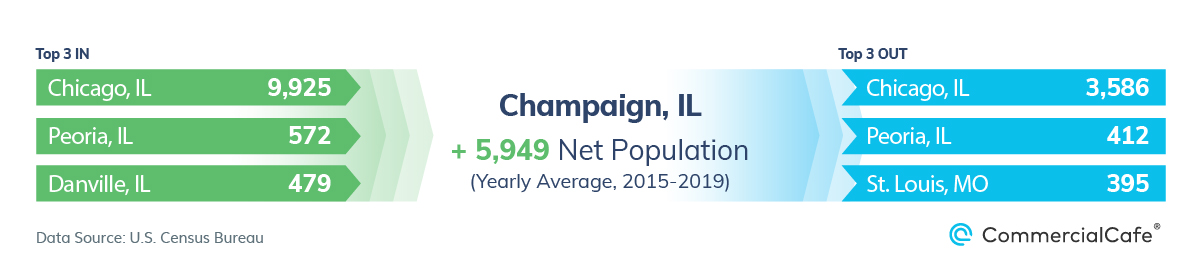
Next up on the podium was Champaign, Ill. — the Prairie State’s only entry in the top 10 — which gained just under 6,000 net residents per year from other metros. Notably, this figure is equivalent to 2.7% of the metro’s population in 2020 — the largest margin on our list.
Similar to Lansing, Champaign’s primary sources of in-migration were other metros in the state. However, while Lansing drew its population growth from several Michigan urban centers, Chicago was Champaign’s biggest population source, by far. In fact, the much-smaller Champaign metro area gained 6,500 each year from Chicago alone.
In addition to being home to the University of Illinois and Parkland College, which provide a steady inflow of young professionals into the metro, Champaign has also benefited from the tech boom: A number of notable startups began here, and the metro also hosts operations for several Fortune 500 companies, including Abbott, Caterpillar, IBM, and State Farm.
#3 – Columbus, Ohio
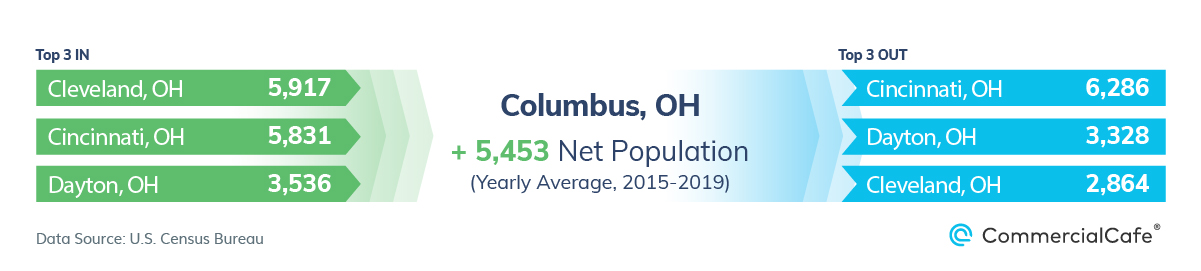
Columbus was the highest-ranked Ohio metro on the list, gaining a net 5,453 in population, on average, each year. And, despite losing net population to Cincinnati (which also made the list at #10), Columbus won residents from other metros in the state, including Cleveland and Dayton.
Similar to many other entries on our list, Columbus is a significant educational hub, leading to a high degree of educational attainment in the metro. Here, government jobs are supplemented by a diverse economy, which includes finance, defense, manufacturing and logistics. Six Fortune 500 companies are also headquartered in the city, including Cardinal Health and American Electric Power, further driving job opportunities — and likely drawing new residents, as well.
#4 – Ann Arbor, Mich.
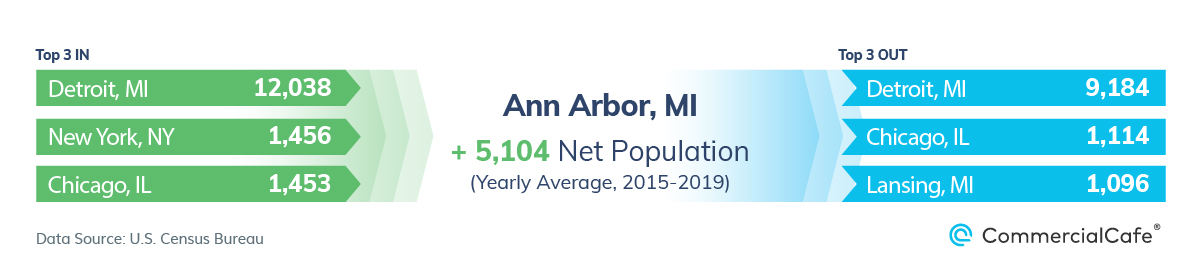
Ann Arbor, Mich., reached #4 on our list with a yearly net population gain of just more than 5,100 people. And, while most of its new residents were the result of in-migration from Detroit, Ann Arbor differs from the previous entries because it has also grown considerably thanks to out-of-state relocations: New York City and Chicago were the other two largest sources of in-migration to the metro.
Ann Arbor is also a university town: It’s home to the University of Michigan, the largest employer in the metro with more than 35,000 workers. Besides education, the automotive industry also plays a large part in the metro’s economy, housing R&D and manufacturing centers from General Motors and Toyota, among others. High tech and biotech are also increasingly prevalent, diversifying the local economy and likely contributing to Ann Arbor’s popularity.
#5 – Grand Rapids, Mich.
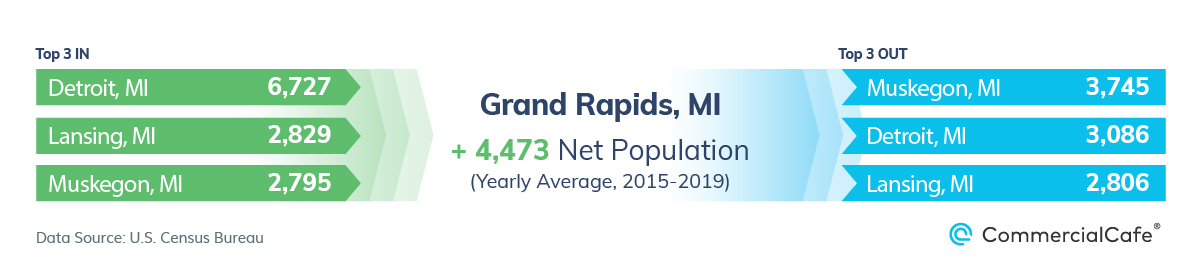
In our ranking of Rust Belt industrial cities that showed the best recovery, Grand Rapids, Mich., took the top spot — thanks to its employment opportunities, wage growth, and rise in the number of young professionals. Metro-to-metro migration trends also support these findings, as Grand Rapids gained 4,473 net residents per year, mostly from other metros in Michigan.
Notably, Grand Rapids stands out in our top 10 through its economy, which still mainly hinges on manufacturing. To that end, the metro has successfully traversed the difficult transition to adapt to modern manufacturing methods in fields such as automotive, aviation, and consumer goods, with furniture still being one of Grand Rapids’ main exports. Meanwhile, healthcare, agribusiness, and information technology are also growing in importance in the local economy.
#6 – Des Moines, Iowa
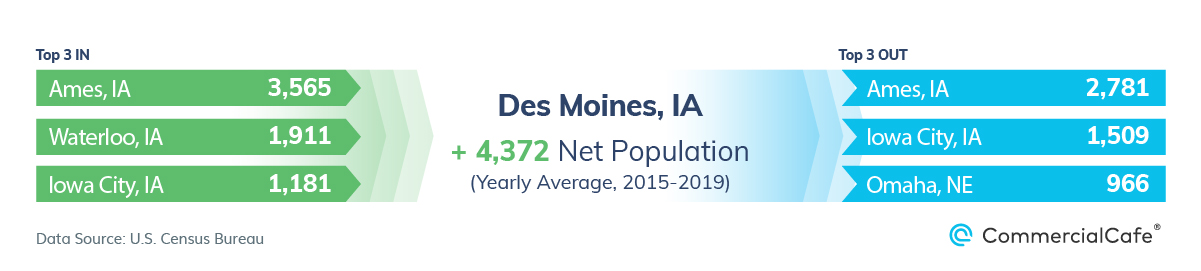
Des Moines, Iowa, gained 4,372 net residents per year, reaching #6 on our list. The state capital demonstrated itself as a hotspot within the state, as the majority of its population inflow was sourced from other metros in Iowa.
Des Moines has a history as a major center of the insurance industry, with many insurance companies hailing from the metro or at least having a significant presence here. Tech has also grown in importance in recent times, with giants such as Facebook, HP, and Microsoft all establishing operations in Des Moines. And, the metro’s status as Iowa’s cultural and entertainment heartland also likely contributed to its population inflow.
#7 – Lincoln, Neb.
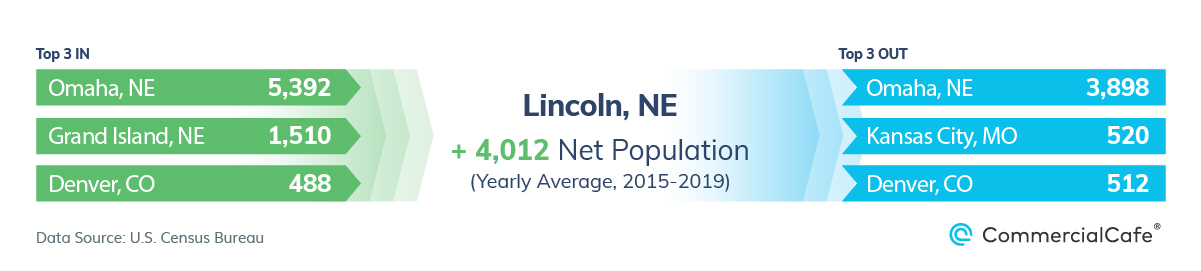
Lincoln, Neb., was another state capital to be its state’s only entry. The net 4,012 residents gained by Lincoln per year can mostly be traced to relocations from Omaha, Neb., and Grand Island, Neb. Moreover, these new residents compensated for the trickle of Lincolnites toward out-of-state destinations, such as Kansas City and Denver.
Lincoln’s economy includes a standard Midwestern mix of services and manufacturing, although the University of Nebraska is also a major contributor by both supplying an educated workforce, as well as providing employment in the metro. Other industries — such as telecommunications and finance — provide further economic diversification, and the expansion of tech within the metro has led to it being considered part of the Midwest’s burgeoning “Silicon Prairie.”
#8 – Lafayette, Ind.
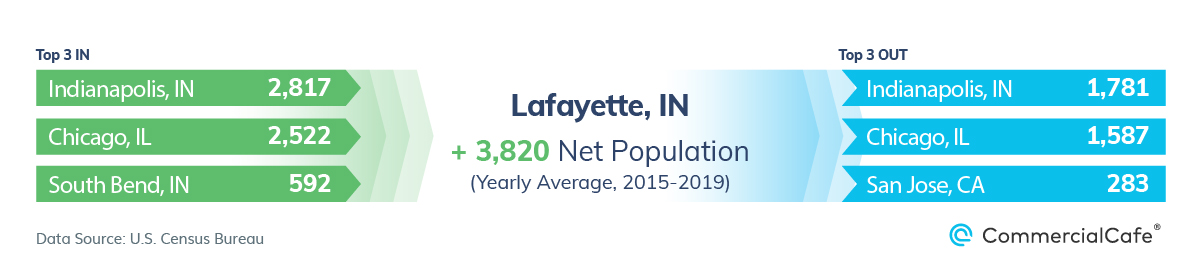
Lafayette, Ind., gained 3,820 net residents per year — enough to grant it the title of 8th-fastest-growing Midwest metro through in-migration. This yearly gain also represented 1.7% of the metro’s total population — the second-largest among all top 10 metros and surpassed by only Champaign, Ill.
Lafayette is another metro relying on the benefits of institutes of higher education. One such institution in the metro is Purdue University, which is attended by approximately 50,000 students each year and provides job opportunities in the area. This is also supplemented by other colleges (such as Ivy Tech) and the result is an educated workforce that benefits local companies, which mainly operate in the manufacturing, automotive, and pharmaceutical industries.
#9 – Dayton, Ohio
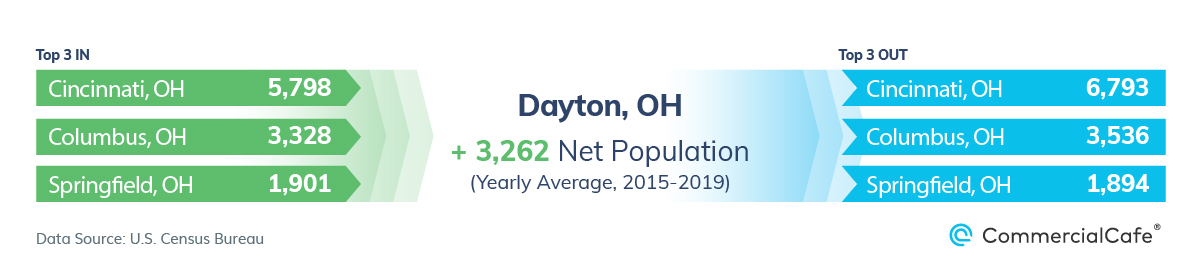
Gaining an average of 3,262 in net population per year from exchanges between metros, Dayton, Ohio, earned the ninth spot on our list. Notably, the area’s positive population influx relies on smaller metros in the region, as it loses 1,000 net residents to Cincinnati, Ohio — the next entry on our list.
Dayton is a major manufacturing and logistics hub, with companies operating in industry, aeronautics, and defense, among other fields. However, the metro’s economy has also diversified into insurance and healthcare, in addition to the government employment provided by its status as the seat of Montgomery County.
#10 – Cincinnati, Ohio
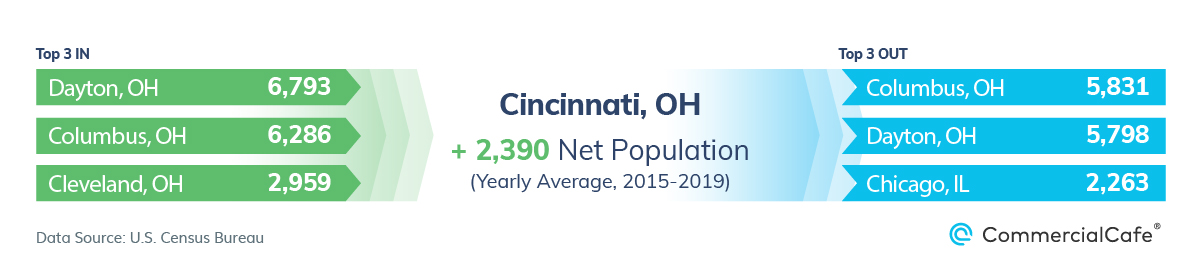
Cincinnati, Ohio, closed out the list with 2,390 net residents gained yearly — mostly from other in-state metros, like Dayton and Columbus, but not enough to rank above them.
Cincinnati is another Midwest success story in economic adaptation and diversification, leading it to be one of the largest economic centers in the region. Its status as the largest metro in Ohio means it’s also a cultural and educational hub, likely encouraging the population inflow from other areas in the state. The metro’s economic significance is further underscored by the Fortune 500 companies headquartered here, the foremost of which is Procter & Gamble.
Overall, metro-to-metro migration trends at the national level are likely to continue their southward and westward movement. However, college towns with diversified economies — such as the ones on our list — can still experience population growth from relocations through relative affordability; opportunities for education and employment; and adaptation to the needs and wants of Millennials and Gen Zers looking to settle down.
Methodology
- We looked at migration between metropolitan statistical areas in the United States as determined by the U.S. Census Bureau, highlighting the 10 metros in the Midwestern U.S. that are gaining the most residents per year in this way. For the purposes of clarity and brevity, we used the common metro names in place of the official Census names for the metro areas.
- Yearly net population gain is calculated by deducting the number of residents lost to other metros between 2015 and 2019 from the number of residents gained from other metros between 2015 and 2019.
- Yearly percentage growth in residents from in-migration was calculated based on 2020 population figures.
- Metro-to-metro migration estimates for 2015-2019 were released by the U.S. Census Bureau in September 2021.
- Non-internal migration, as well as migration to or from places that are not part of a metropolitan area, were excluded.
- For each of the top 10 metros, the top three sources for in-migration into the metro and the top three destinations for in-migration out of the metro were highlighted.


Lucian Alixandrescu
Senior Content Writer, CRE Industry Reports & Studies
Lucian is a senior content writer for CommercialCafe, specializing in commercial real estate research and data-driven reporting since 2019. With deep expertise in industrial real estate, office markets, demographics, and economics, he produces comprehensive market studies and insights on national and regional CRE trends. He also reports on adjacent subjects such as population shifts and the job market. His reports have been cited by and featured in The New York Times, Forbes, NBC, Bisnow, The Business Journals, and Yahoo Finance. Lucian holds a background in language and literature studies and brings more than 5 years of previous freelance writing experience to his commercial real estate journalism.