Decade in Review: Office Building Sales Total $873 Billion Since 2010


A decade is a long time, and so much has occurred in our country and around the world in the last 10 years. In particular, rising real estate prices have been one of the prevailing themes throughout the 2010s. Coming off the heels of the Great Financial Crisis, the U.S. economy has trended upward for almost the entire decade.
Using data provided by Yardi Matrix, we looked at the evolution of office markets across the U.S. during the last decade. While it wasn’t all up and to the right, it was largely a good decade to be in real estate—even if was preceded by a not-so-great period.
Summary:
- Top Deals of the Decade
- Top Five Active Markets by Year
- Price Per Square Foot Evolution
- National Sales Volume vs. Square Footage by Year
- Office Completions Since 2010
- Top 20 Largest Properties
In Manhattan, 10 Deals in 10 Years Approach $19 Billion
Manhattan is the epicenter for high-end real estate in the U.S. As such, since 2010, the nation’s 10 largest commercial real estate transactions were in Manhattan. Almost $19 billion changed hands in just those 10 transactions.
Google’s purchase of Chelsea Market at 75 Ninth Avenue in 2018 logged the highest sales price of the last decade. Jamestown sold the 1.1-million-square-foot property for $2.4 billion—or $2,180 per-square-foot. And just eight years prior, Google purchased the adjacent building, 111 Eighth Avenue, for $1.77 billion making it the sixth highest priced sale of that last decade.
SL Green Realty’s purchase of 11 Madison Avenue in 2015 was the second-largest transaction of the decade, coming it at nearly $2.36 billion. The historic trophy property—originally completed in 1932—has almost 2.3 million square feet of office space. The sale represented a price per square foot of $1,021.
Willis & John Hancock Towers Boost Chicago & Boston
Sales were tempered outside of Manhattan, which is a testament to its prominence. Excluding Manhattan, seven of the 10 highest sales were in Boston and Chicago, with San Francisco, Washington, D.C., and Dallas with one entry each.
In Chicago, 233 South Wacker—also known as Willis Tower and arguably the most iconic of the city’s buildings—was picked up by The Blackstone Group in 2015 for $1.3 billion.
In Boston, Normandy Real Estate Partners sold the John Hancock Tower at 200 Clarendon Street to Boston Properties in 2010 for $930 million. This transaction marked the second-highest sale price outside of New York City in the last decade.
Manhattan #1 in National Sales Volume
Manhattan not only logged the largest sales of the decade, but it also had the largest number of transactions for every individual year of the decade, as well.
In 2010, more than 19 million square feet of office space traded in Manhattan for just over $6.4 billion. This represented 12% of all square footage traded in the country that year and 18% of the total transaction volume.
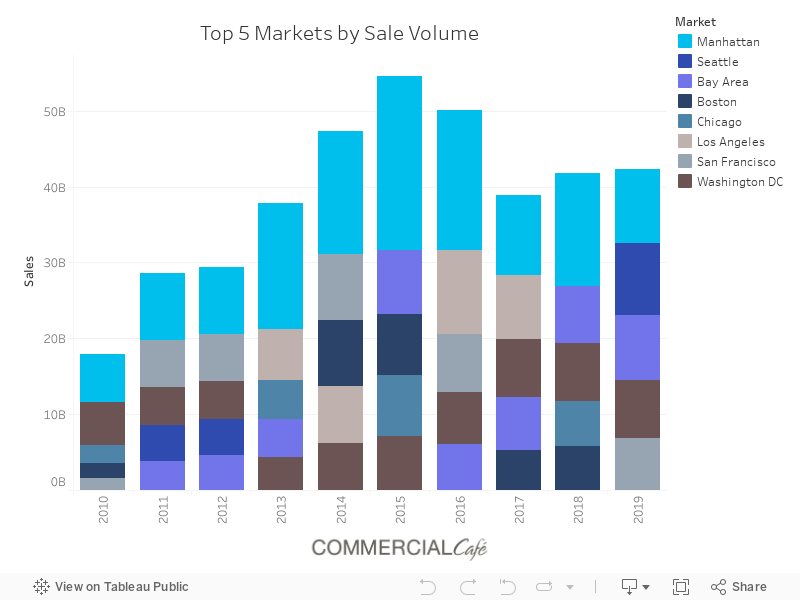
Volumes peaked in 2015, when more than $23 billion was spent on 31.25 million square feet of office space, which represented 19% of the nation’s transaction volume that year. Skyrocketing valuations caused by large amounts of deployable capital led to a record-low compression of cap rates, and Manhattan ended the decade off it’s 2015 highs with 11.2 million square feet trading for $9.72 billion—10% of the national transaction volume.
Washington, D.C. was the only market other than Manhattan that sustained a top-five position throughout the decade—reaching as high as the second position with roughly $5.7 billion in sales volume in 2010. Similarly, the Bay Area entered the top five in 2011, but has fluctuated quite a bit. Its best year was 2015, when it reached the second position with more than $8.4 billion in sales volume.
DC & Chicago PPSF Decline as Other Markets Grow
The national price per square foot started the decade off at $211 and ended at $291. However, this metric can vary widely from market to market. Once again, Manhattan was in a league of its own, exploding 164% since the start of the decade to $1,054 per square foot—more than double that of Los Angeles’ $432 per square foot.
While overall prices rose throughout the country, not every market followed suit. For instance, Chicago fluctuated and ended the decade at $188 per square foot, below the $234 where it began, the largest decline of the top five cities. Washington, D.C. had the second-largest decline of the top markets. It ended the decade at $321 per square foot—roughly 11% below its 2010 price of $361 per square foot.
After Peaking in 2015, Volume Settles as Prices Continue to Rise
Manhattan’s transaction volume trend mirrors the nation overall. The transaction volume for the entire nation peaked in 2015 at more than $123.3 billion—an increase of 253% from 2010—with more than 500 million square feet of office space traded that year. However, since then, sales volume has retreated from those highs to settle around $100 billion for each of the last few years.
Nonetheless, valuations have continued to increase and will likely extend into the new decade. It’s also worth noting that the divergence in transaction volume to total traded square footage reached its largest gap last year, when the national average price per square foot climbed to $291. As an example the same amount of money in 2019 purchased roughly 36 million square feet less than it did in 2018.
One World Trade Center Leads Resurgence of Urban Office Development
A previous study revealed that office construction favored either the suburbs or the city, but rarely both. On a national scale, much of the development last decade was in the suburbs. But, last year, office construction in urban cores outpaced that of suburbs. Indeed, while development overall has trended upward since 2011, urban office construction has consistently trended upward and is likely to continue.
The graph above illustrates the prominence of the urban office construction resurgence. Note that the number of completions stays roughly in the 600s for most of the decade, but the amount of square footage added continues to rise. Likewise, since 2015, the number of buildings completed has decreased every year, but the square footage of delivered office space has continued to rise—meaning larger buildings.
Obviously, larger buildings tend to be in dense cities and, yet again, New York City dominates with eight of the decades top 20 largest developments in the U.S.
At the top of the list, One World Trade Center was the largest office property built in the nation in the last decade. At 94 floors, the 3.1-million-square-foot tower is not only the tallest building in the U.S., but in the entire Western Hemisphere as well. It was completed in 2014—13 years after the fall of the twin towers.
Other notable entrants were 3 and 4 World Trade Center at 2.8 and 2.5 million square feet, respectively, as well as 30 and 10 Hudson Yards which have more than 4.5 million square feet between them.
On the other coast, the second-largest property built in the last decade was completed in Cupertino, CA—the 2.88-million-square-foot Apple Park. Part of the 150-acre property formerly housed the computer systems division of Hewlett-Packard, and it was also surrounded by apricot orchards. The Apple Park property is roughly 80% landscaping and was officially completed in June 2018.
The largest adaptive reuse in the nation was completed last year in Chicago. The 601W Companies purchased the Old Post Office building in 2016 and spent three years and $800 million updating the 2.8 million-square-foot landmark property on the river in the Loop.
Rounding out the top 10 is Oklahoma City with the addition of the Devon Energy Center in 2011. The 1.61-million-square-foot tower stretches 52 floors and is the most iconic building in the city’s skyline.
Methodology:
We considered transactions of completed properties, from 2010 to 2019; Data extraction on Jan 21.
Minimum amount per transaction: $5,000,000.
Square footage parameters: at least 25,000 square feet.
Sales volume includes ownership stake, controlling interest, and remaining interest deals.
Portfolio deals are counted as single transactions.
Only properties featuring over 50% office space were considered.
“Ownership stake,” “ground lease,” “controlling interest,” “portfolio” and “undisclosed” deals were excluded from the average price per square foot calculations.
Distressed sales were excluded.
Portfolio transactions were excluded from top deals.


Patrick McGregor
Patrick McGregor is a senior writer covering the real estate industry and overall economic trends in the United States for several Yardi product publications. He also holds an MBA from Thunderbird School of Global Management. Patrick was previously a commercial real estate analyst at Yardi Matrix for five years. His work has appeared in the New York Times, Bisnow, GlobeSt, The Real Deal, Business Insider, The Denver Post, The Motley Fool, and more.