Top U.S. Cities Add 682 Million Square Feet of Office Space in 10 Years


Key takeaways:
- 682 million square feet of office space have been added across the country in the last 10 years.
- Campus-style tech companies greatly influenced the suburban expansion throughout the U.S.
- New York City, Chicago, and San Francisco grew the most on the fringes of the urban cores.
The expansion of office space can tell us a lot about business, such as: where the demand is, what drives development in a given area, whether a specific type of industry drives a specific type of expansion, and how all of these things relate to the movement of people.
Using data provided by Yardi Research Data, we identified properties with at least 25,000 square feet across 20 top markets based on primary and secondary locations, as well as whether they were urban, suburban or in the central business district (CBD). We then analyzed the office footprint within each area from 2008 and 2018 to see where the expansion and growth was in the last decade. For consistency, “urban” does not include the central business district; these metrics were calculated separately.
One thing to keep in mind when analyzing growth data is size. Suburban geographies are larger than their urban centers and, consequently, can handle far more growth. But the suburbs also tend to have more square footage already. So, while 4 million square feet added to a secondary urban location may represent a high growth rate for that designation, the same addition in a large suburban location may be quite low relative to the existing stock.
Regional Growth Favors Urban or Suburban, Rarely Both
Regionally, the areas of growth were relatively distinct. Urban areas in the Pacific Northwest grew by nearly 32%, adding a total 112 properties and 19.8 million square feet. The Midwestern urban areas added 192 properties and 21.6 million square feet—an increase of 18.5% in the last decade.
The urban areas of the Northeast region—which includes Philadelphia, New York City, and Boston—grew by 16.5%. This is surprising given how dense these cities already are and represents more than 55 million square feet across 290 properties. What’s more, this designation doesn’t even consider the central business districts, which collectively grew by 5.3% for an additional 24 million square feet.
Also, no region added more square footage than the Northeast—at 130.5 million. The Southwest region added more than 108 million square feet of office space in the last 10 years, but in contrast to the Northeast, a full three-quarters of the added square footage was in suburban locations. This relationship makes a lot of sense given the composition of these two regions—with dense cities like New York City and Boston in the northeast and the sprawling suburbs of Dallas-Fort Worth and Houston in the southwest; similar to Los Angeles and Orange County in southern California.
The Western region was no different. Approximately 58 million square feet were added as a whole, 43 million of which was in the suburbs. This includes markets like Denver, Salt Lake City, Las Vegas, and Phoenix, which exemplify suburban sprawl. Driven by this phenomenon, “tech corridors” have also sprung up—such as Buckhead in Atlanta, the Platinum Corridor in Dallas, and Silicon Slopes in Salt Lake City.
Part of the reason for the greater expansion in the west is the availability of cheap land for development, as well as the adoption of office campuses versus office buildings. Companies like Google and Facebook also introduced a plethora of new employee amenities—like free snacks and meals, the ability to bring pets to work, and free transportation to and from work—creating an overall relaxed atmosphere that’s been historically absent in the office buildings of dense city centers.

Salt Lake City: An Early Silicon Valley
The Bay Area is punctuated by one of the most striking suburban expansions. In 2008, primary suburban locations held most of the market’s office space with 141 million square feet. But, 10 years later, the same area added another 28 million square feet—an increase of 20%. This is an impressive feat, to be sure, given that almost all this development was in Silicon Valley.
Companies that defined this transformation include big names like Hewlett-Packard, Intel, Facebook, Google, and Uber. From one of the country’s first radio stations to the first silicon computer processing company to today, Silicon Valley has been the center of the tech world for more than half a century, and it remains home to many companies whose products have changed our lives.
However, with skyrocketing costs of living and the increasing ease and popularity of remote working, Silicon Valley’s popularity is starting to wane. For example, Salt Lake City has recently seen impressive growth on the heels of the Bay Area. Silicon Slopes—Utah’s tech corridor along I-15 south to Lehi and Provo—has accounted for most of the development, adding more than 9 million square feet of office space since 2008.
The area has also drawn tech industry giants the likes of Oracle, Visa, and Tesla. The presence of these companies in turn draws plenty of talent to the area and drives demand for various workspace options. A thriving coworking scene plays a key role in the productivity of freelancers or remote workers, as many want the option to conduct their daily activities in a dedicated space. CommercialCafe.com can help you find the best coworking solutions across all major U.S. markets:
Regional HQ Demand in Suburban Phoenix
Phoenix’s office growth followed suit and expanded largely in suburban locations. Much like Salt Lake City, the cheaper cost of living in Phoenix and access to an increasingly educated workforce has incentivized large corporations such as IBM and Boeing to move or expand their offices here.
Of the 131 properties added in the last 10 years, 111 were suburban, representing 11.6 million square feet. Most of this growth was in the east valley along the 101 in Chandler, Tempe, and Scottsdale. Though, the single largest addition was in the urban part of Tempe along the lake. The Marina Heights campus—completed in 2017 and State Farm’s regional headquarters—has 2 million square feet of office space across five buildings.
Seattle and Portland Grow Together
The Pacific Northwest markets of Seattle and Portland grew by 17% and 11.2%, respectively, and in very similar ways. The primary urban areas here expanded by far larger margins than the suburbs and the CBDs.
In the Seattle market, Bellevue, combined with the central neighborhoods of Lake Union, Denny Triangle, Belltown, and Pioneer Square, increased their office footprint by almost 50%, adding 13.9 million square feet. By comparison, the rest of the market added 8.25 million square feet combined. The expansion of Amazon’s campus is responsible for much of this growth, but it has also attracted many other businesses to the area, as well.
Portland’s primary urban areas—including the Pearl District, Chinatown, and the West End—collectively grew by 24%, adding 3.6 million square feet. All other neighborhoods in Portland collectively added 3.2 million square feet. Portland’s Urban Growth Boundary policies are at least part of the reason for the concentrated development in urban areas.
Diverse Growth Trends in the Lone Star State
The Texas markets have also had considerable growth, but in different ways. Like the Bay Area, Houston and Dallas-Fort Worth have had similar growth in the primary suburban areas. But expansion has been localized to only a few areas. In Houston, The Woodlands alone added over 5.7 million square feet. The Energy Corridor and adjacent neighborhoods—including Memorial Villages, Westchase, and Briargrove—added a whopping 47 buildings totaling 12.5 million square feet.
The Platinum Corridor, Plano, and Las Colinas grew the most in Dallas. These primary suburban locations collectively added 17.7 million square feet—a 19% increase in 10 years—but also represented more than half of all square footage added in the entire Dallas–Fort Worth market. Dallas continues to be a popular choice for many company headquarters, including Exxon Mobil and McKesson.
However, Austin’s entire suburban market grew more than 22%. Both primary and secondary locations added 11.2 million square feet across 98 properties. Yet, downtown Austin grew by a higher margin—more than 25%. In the last decade, 15 properties were built in Austin’s CBD—adding more than 2 million square feet—with Google, Deloitte and Cirrus Logic opting for downtown locations.
Austin has also become one of the cities that is drawing startups and tech sector jobs from the Pacific Northwest and Silicon Valley, largely due to the cheaper cost of living and highly educated talent. Other cities that have seen similar growth are Phoenix, Salt Lake City, and Nashville.
In general, Texas appears to have been quite attractive, but compared to Dallas and Houston, Austin’s expansion is far more significant given its size. While its population is less than one-third the size of Dallas and Houston, Austin had a similar amount of development, meaning Austin grew by a slightly larger margin than the other two.
Downtowns Take the Spotlight in Largest Cities
Suburbia isn’t the only place that’s growing, though. Growth is easier in less dense areas, but distressed neighborhoods have benefits, as well. For example, Philadelphia’s secondary urban areas have built 28 properties since 2008, adding more than 5.8 million square feet. Similarly, Chicago’s West Loop neighborhood of Fulton Market has considerably gentrified in the last decade and seen 1.9 million square feet of office space added across 11 properties, almost doubling its office space from 2008. Many historic manufacturing buildings have been transformed into class A office spaces, such as the 210 North Green Street building that added 69,185 square feet, and 811 Fulton Market with 61,700 square feet of office space.
Chicago is also one of only a few markets to see substantial growth in its CBD. It added 10 properties and 7.8 million square feet of office space to the Loop and River North, including the 1.2 million-square-foot 150 North Riverside Plaza.
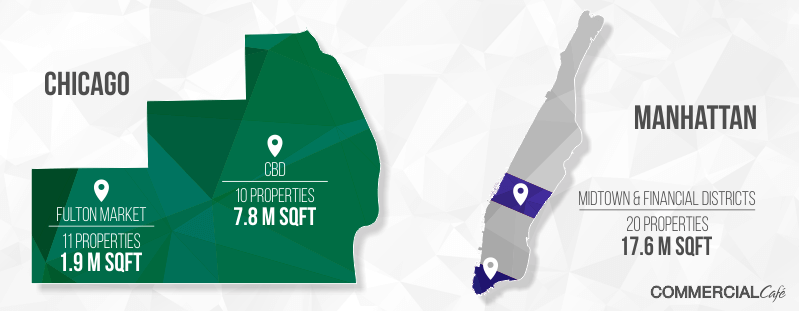
Manhattan and Los Angeles also added significant square footage to their CBDs. These iconic downtowns didn’t grow by a large margin given their existing inventory. But the fact that Manhattan’s Midtown and Financial Districts added 17.6 million square feet across 20 buildings in an extremely dense environment is impressive, nonetheless. Hudson Yards had completed two buildings by the end of 2018—10 and 55 Hudson Yards—totaling more than 3 million square feet.
Los Angeles’ CBD hasn’t seen quite the growth that Manhattan’s has, adding just 1.2 million square feet across 16 properties. 365,000 square feet of that was added as part of the 1.3 million-square-foot Wilshire Grand Center which also includes retail space and a hotel. Most of the construction occurred down the hill from Grand Avenue. Seven of the nine primary properties are within one block of South Broadway along the periphery of the primary downtown area. Despite the modest growth, though, its future is bright. A total of 32 projects are either slated to start or are currently under construction and will add almost 6 million square feet to LA’s downtown office footprint in the coming years.
LA’s primary urban areas added the most square footage. They grew by 10% in the last decade, translating to the addition of 8.7 million square feet of office space. These areas encompass Hollywood, Culver City, Santa Monica, and the Jefferson Corridor in Marina Del Rey—easily the largest amount of office square footage in the region.

In addition to these top-tier cities, Miami also added significant square footage to its CBD and primary urban neighborhoods. Excluding suburban locations, Miami added 18 properties totaling 3.7 million square feet. Two large contributions were the completions of the Wells Fargo Center and the Brickell World Plaza which collectively added more than 1.3 million square feet of office space.
San Francisco Grows in the Urban Fringe
The San Francisco market—ranging from Menlo Park north to Santa Rosa—has seen decent growth. As a whole, the market grew by 12%, adding 17.7 million square feet in the last decade. A full one-quarter of that was added in the secondary urban neighborhoods of SOMA and Civic Center. In the CBD, the 387,000-square-foot 350 Bush Street building was the only property built since 2008. However, the primary urban areas surrounding the CBD grew by about 4 million square feet across nine properties, one of which was the 1.42-million-square-foot Salesforce Tower.
Similarly, Minneapolis-St. Paul added very few properties to its CBD in the last 10 years: just four, totaling less than 1 million square feet. However, like San Francisco, the urban fringe saw plenty of development. The secondary urban neighborhoods grew by a whopping 37%—adding 4.2 million square feet—almost 40% of the total added space in the market. Wells Fargo’s Downtown East Campus project was the largest addition, adding 1.2 million total square feet of office space.
Downtown Growth Stalls in Boston and San Diego
Conversely, the CBDs of Boston and San Diego haven’t added any office space in 10 years. In San Diego, most of the expansion was in the primary suburban locations of Carlsbad, La Jolla, and University City. While in Boston, the neighborhood of Cambridge and the Seaport Innovation District added roughly 9 million square feet of office space in the last decade.
Both cities currently have a single property under construction though. Congress Square just added 247,486 square feet to Boston’s downtown this year, and 120,000 square feet of office space at Kettner & Ash will be added to San Diego’s, and both are projected to be completed this year.
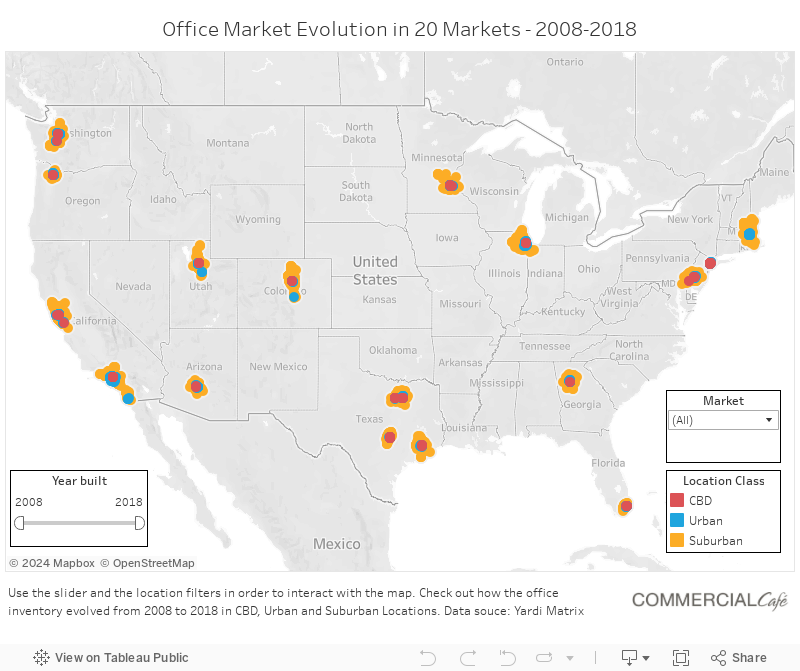
The interactive map below gives a visual highlight of how the expansion of space took place in all the markets we analyzed. You can select by market on the right and use the slider on the left to show the evolution of office space by year.
For those looking for commercial real estate – whether it be industrial, office, or retail space – CommercialCafe.com provides a comprehensive database of listings, covering all of the major U.S. real estate markets.
Methodology
We compared all office properties completed from 01/01/2008 to the total completed office inventory on 12/31/2018.
Market Inventories are highlighted based on the number of properties shown as ‘Completed’ and the total amount of ‘Office Square Feet’ incorporated in those properties, excluding square footage of other uses (i.e. retail, hotel, etc.).
Market inventory is divided in location ratings (CBD-Primary, CBD-Secondary, Urban-Primary, Urban-Secondary, Suburban-Primary, and Suburban-Secondary).
Square footage parameters: at least 25,000 square feet.
Regional Differences feature the Office inventory of 113 Commercial Markets.
Data extraction date: September 2019.
Data source: Yardi Research Data


Patrick McGregor
Patrick McGregor is a senior writer covering the real estate industry and overall economic trends in the United States for several Yardi product publications. He also holds an MBA from Thunderbird School of Global Management. Patrick was previously a commercial real estate analyst at Yardi Matrix for five years. His work has appeared in the New York Times, Bisnow, GlobeSt, The Real Deal, Business Insider, The Denver Post, The Motley Fool, and more.