The 6 Best Markets for Office Investment in 2018


A recent CommercialCafe study looking at the 2018 office construction pipeline showed that close to 75 million square feet of space are on track for delivery next year. What stood out from our analysis was that nearly half of the national construction pipeline is concentrated in suburban areas, with the Bay Area and DFW poised to add the most new office space in the coming year. Investors are shifting their focus outside the expensive and overbuilt CBDs, opting instead for strategically located development opportunities on the fringe. By all accounts, the U.S. office construction market seems to be gearing up for a busy 2018, so this is the perfect time for investors to plan their next move–and we mean to simplify that process.
Using as a starting point our initial study, where we zoomed in on the cities set to add the most new office space in 2018, we took a step back to see which markets present the best overall conditions for office investment in the coming year. With the aid of Yardi Matrix and Bureau of Labor Statistics data, we came up with a list of the six best markets for office investment in 2018, based on metrics such as employment numbers, vacancy rates, lease rates and the office construction pipeline. We also threw in three mid-strength markets worth investing in, should none of the top six contenders appeal to you. Read on to see which are our top picks for investing in office real estate in 2018.
Which Are the 6 Strongest Markets for Office Investment in the Coming Year?
Austin
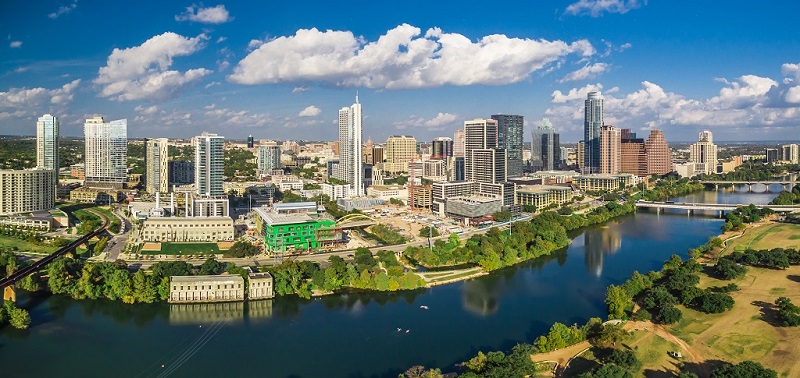
The Austin office market averaged 11-15% office vacancy throughout 2017. The market ranks 6th in annual tech-job growth, 10th in both rent growth and net absorption of tech submarkets (northwest Austin), and 11th in overall tech office rent growth. Tech jobs here actually grew four times faster than the national average and are expected to remain strong in 2018 as well. Austin’s 2017 office pipeline (15 properties and 2,572,749 square feet) was all competitive this year and represented 4.2% of existing stock. The 2018 competitive projections are forecast at 1,809,479 square feet, which represents 3.0% of existing inventory and an overall reduction of 30% compared to 2017. Additionally, smaller, co-working spaces are gaining significance in the Austin market, which will impact 2018 construction trends.
Boston

Boston averaged between 11% and 12% office vacancy in 2017. Desirable tech submarkets are priced at a premium here, while emerging submarkets often offer discounts–the overall average asking rent in tech submarkets is priced at a 16% premium in East Cambridge (where inventory has decreased). The Boston market also retained positive absorption, as vacancy dropped 0.4 percentage points to 12.0 percent last year. Large tenant move-ins have driven the 2017 Boston CBD market, with major shifts including Natixis Global Asset Management’s move into its new 150,000-square-foot headquarters at 888 Boylston St. in the Back Bay.
We expect suburban markets will not only maintain their growth, but improve their metrics in 2018. The greater Boston unemployment rate of 4.0% reflects young, well educated, talented people, and the Greater Boston area continues to perform at, or above, the level of many large metropolitan areas. WeWork announced that it will open its fifth location in Greater Boston at 200 Portland St. near North Station in early 2018, and the Boston office market will also see growth in the co-working office sphere. The market will bring on 3,160,716 square feet in 2018, which represents a 147% increase compared to 2017; in addition, the new supply represents 1.5% of existing stock.
San Francisco

San Francisco averaged 9-14% office vacancy this past year, and was the top high-tech job growth market for the sixth year in a row. San Francisco’s office market was most robust in the second half of 2017, with significant leasing activity, positive net absorption, and continued growth in average asking rates. Tenants such as Airbnb and Amazon signed significant leases in 2017, while Facebook signed for the entirety of the 436,000 square feet of office space at 181 Fremont St.
Nonetheless, slow job growth compared to other metros continues to restrain San Francisco, with roughly 3,200 jobs added year-over-year (a 0.59% increase). The unemployment rate was 3.5% at the end of the third quarter, a minimal 10 basis points higher than the same period year-over-year. We expect the office-employment metrics to begin increasing significantly in the second half of 2018. Average asking rates are likely to continue their upward trend, as 2017 showed an 8.4% increase year-over-year. Availability will tighten, and with large blocks of space coming off the market, we can expect these rates to continue the upward trend.
Seattle
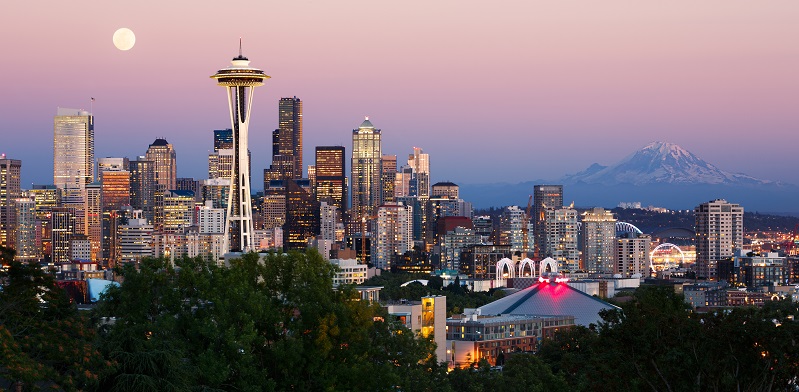
Seattle boasted between 11 and 12% office vacancy during 2017. In terms of construction activity, eleven properties totaling 3,225,875 square feet are scheduled to come online in 2018, representing 2.6% of the existing stock–the same as 2017.
Seattle saw significant activity in Q3 2017. Wright Runstad broke ground on Rainier Square and leased the complete 772,000 square feet of its office space to a local tech tenant. The Rainier Square deal replaced F5 Tower’s as the largest office lease of 2017. Class A vacancy is currently at 7.1%, with 3.5 million square feet of office space taken off the market last year. Class B vacancy is at 11.9%, with half a million square feet of office space reintroduced to the market. In 2017, the Northend, Southend and Eastside submarkets all saw more Class B space get vacated than occupied. We forecast that high demand will fuel leasing activity and rental rate growth in the Class A market, while Class B metrics will grow at a slower pace. There are three projects over 600,000 square feet expected to deliver by 2020, featuring a total of 2 million square feet of unleased space.
Atlanta
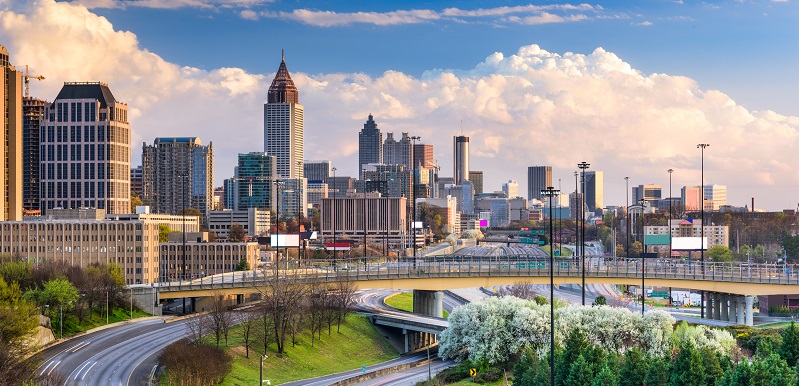
Atlanta is currently experiencing a growing national trend, as investors and office landlords are converting warehouse and flex buildings into office space. Areas like Chamblee and Armour Yards, and now Peachtree Corners, are models for this concept. The 120,000-square-foot 30 Tech Park property was renovated to incorporate a modern design with a creative loft office feel.
Atlanta has and is being fueled by double-digit tech-sector employment growth, and was among the top markets in the country for rising office rents over the past two years. A total of 9 properties featuring 691,793 square feet of competitive office space are scheduled for delivery in 2018–an 80% decrease compared to 2017. Supply reduction should allow for absorption to stabilize and drive lease growth in the second half of 2018. Atlanta’s technical office markets are expected to grow in 2018, with the largest players coming from foreign and non-native firms. Midtown’s Coda continues to attract tenants, with Keysight Technology leasing 50,686 square feet at the Tech Square building scheduled for completion in 2019. Accenture is also scheduled to add a 30,000-square-foot innovation hub in the Tech Square area.
Nashville

In Nashville, the tech sector’s share of major leasing activity has nearly doubled to 19% over the past five years, resulting in strong occupancy or net absorption gains. Competitive supply increased by 1,822,402 square feet in 2017, and an additional 389,518 square feet will be supplied in 2018, which represents less than 1.0% of the total inventory. Nashville’s rental increase is due to the delivery of new product at higher rates. For instance, asking rents in the West submarket increased 9.7% as a result of the delivery of Stocking 51, a mixed-use redevelopment in The Nations.
The year-to-date asking rate for deliveries is $35.26, and as new product delivers, rental rates will continue to push the market’s rent ceiling. Nashville’s growth is further fueled by a booming tourist economy and business-friendly local government, and efforts to increase density in the urban core have been successful. Downtown vacancy is also significantly lower year-over-year in the urban core compared to the suburbs.
Bonus: 3 Mid-Strength Markets for Office Investment in 2018
Washington, DC
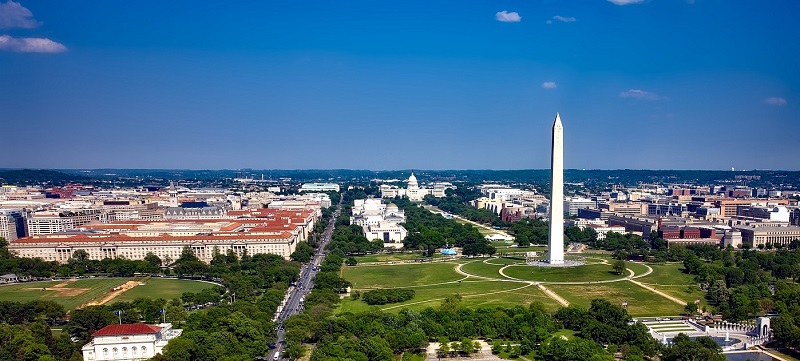
The Washington, D.C., office market continues to exhibit sub-par fundamentals, as vacancy rates hovered between 14 and 17% in 2017, and even more supply is underway. The market will introduce 5,234,629 square feet of competitive space in 2018, or 1.4% of the total inventory.
The trophy and Class A markets in the city core will continue to face headwinds, as vacancy is set to rise from 15% to 20% by 2020, forecasting a greater concessions potential in the next two years for type A offerings. However, the Class B and Class C markets in the core will remain tight, which will continue to push rents higher and drive activity within emerging markets such as Ballpark, NoMa, Union Market and Southwest.
Houston
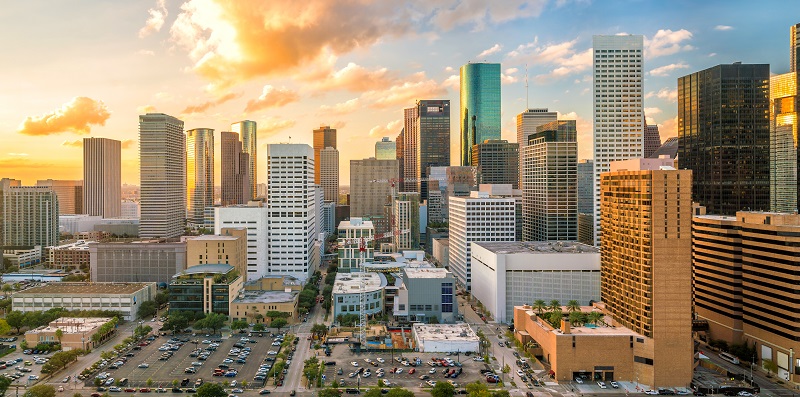
The state of the Houston office market is roughly on the same page as D.C. Vacancy rates hovered above average between 16 and 21% last year, and construction activity is still high. The deals on the market have been competitive, and there is a significant amount of capital looking for assets in Houston, with the premise that the market is at its bottom and better yields can be realized here relative to other major metros. However, office employment has not grown significantly, and we believe Houston recovery is at least 12-18 months away in the future. In addition, the Houston office market continues to struggle, as U.S. crude prices waiver around $50 per barrel. According to the U.S. Energy Information Administration (EIA), they are expected to stay in this range through 2018. The Houston market still remains “full of future potential,” with many well-located infill properties representing value-add opportunities to investors.
Los Angeles
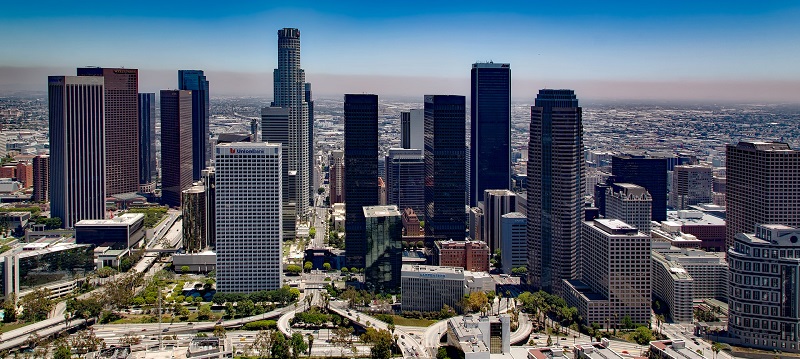
The Los Angeles office market has experienced positive net absorption this past year, and while vacancy has decreased only slightly due to the new deliveries in 2017, we do not foresee metro L.A. office development increasing in 2018. In 2017, 4,307,340 square feet across 23 properties were completed. In 2018, completions are projected to deliver 2,743,225 square feet and 12 new properties to the market–down 40% from 2017.
The metro Los Angeles unemployment rate currently rests at 4.4%, and thus we believe the L.A. economy is at a point of minimal growth. The entertainment industry and content generators continue to provide robust employment, and mature professional service sectors are likely to add additional headcount; however, this phenomenon will not significantly expand the office market.
Rents in the area are rising and landlords are cutting back on concession packages on the Westside. However, downtown ownership groups are supplementing their deals with more generous terms and conditions, while still maintaining face rents. Downtown trophy owners continue to reinvent and re-energize their assets through ambitious lobby and plaza renovations, such as City National Plaza, which is undergoing a multi-million-dollar improvement project.
Data sources: Yardi Matrix, Bureau of Labor Statistics
Images via Shutterstock


Doug Ressler
Doug Ressler is the Manager of Business Intelligence at Yardi Matrix, the sister division of StorageCafe and a leading commercial real estate data and analytics platform. Yardi Matrix provides comprehensive asset-level intelligence across U.S. multifamily, student housing, office, medical office and life sciences, industrial, and self-storage markets, supporting origination, underwriting, and asset management for clients worldwide.
Doug has over 12 years of industry experience in commercial real estate. Previously, Doug worked as an intelligence analyst for Pierce-Eislen.
Doug ‘s role involves the development of business and statistical research models that power data-driven insights for the commercial real estate industry.