There are many variables to consider when looking for commercial assets. You may be looking to lease space for your company or to purchase a building outright as an investment. Every market across the country has its own pros and cons, but historically the central business district is where the most desirable office assets lie.
Using data provided by Yardi Matrix, we analyzed 15 of the most popular central business districts in the country to compare prices for assets located within them. We’ve broken down the price-per-square-foot (PPSF) of transactions in the last nine quarters and separated them by A and B improvement ratings. We then created a calculator by which you can compare the price of similar-sized assets across CBDs or the amount with which you have available to invest to determine which CBD is in the sweet spot. This analysis only looks at one of the numerous variables that should be taken into account when performing due diligence on potential investments, and that is the median sale price.
Please take note of estimates for San Francisco office space, where the price of B class assets is higher than those of A class. This is due to an abnormality in the distribution of when properties sold in our time period. As such, there were only two B class properties that traded, and both were in the summer of 2018. By comparison, half of all the assets that traded in the CBD of San Francisco were between February and May of 2017.
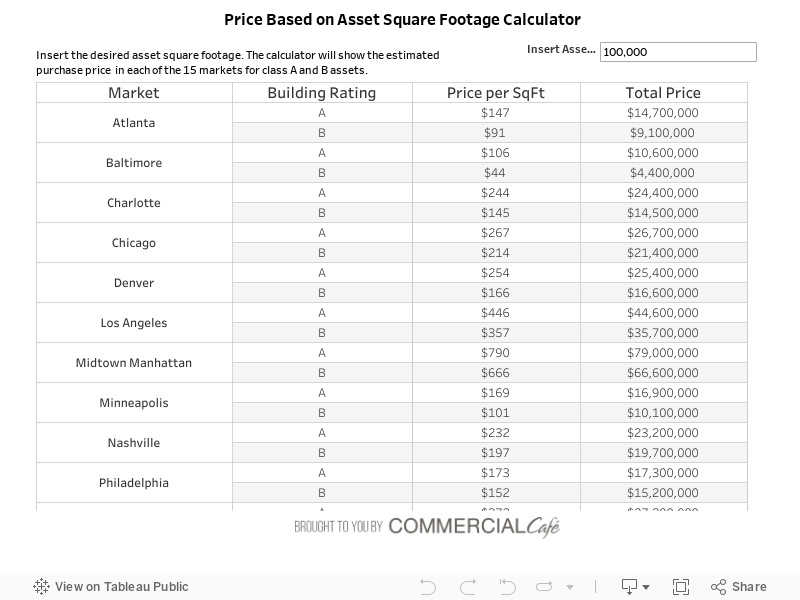
It’s no surprise that office space in Manhattan posted the highest median PPSF of the 15 CBDs we analyzed with A’s at $790 and B’s at $666. Midtown Manhattan also had one of the highest volume with a total of 35 transactions. Conversely, Baltimore office space was the cheapest with a median PPSF of $106 for class A’s and $44 for B properties as well as one of the lowest volumes with seven total transactions.
We saw the largest differences in Seattle office space and on the Sacramento office market, with PPSF differences between A’s and B’s of $205 and $171, respectively. This can be explained by the relatively low number of B’s that have traded overall. Also, the B’s that have traded have typically been smaller than the A’s, sometimes by a significant amount, as is the case with San Francisco and Sacramento.
Check out the square footage calculator below to calculate what size asset you can purchase with a specified investment.
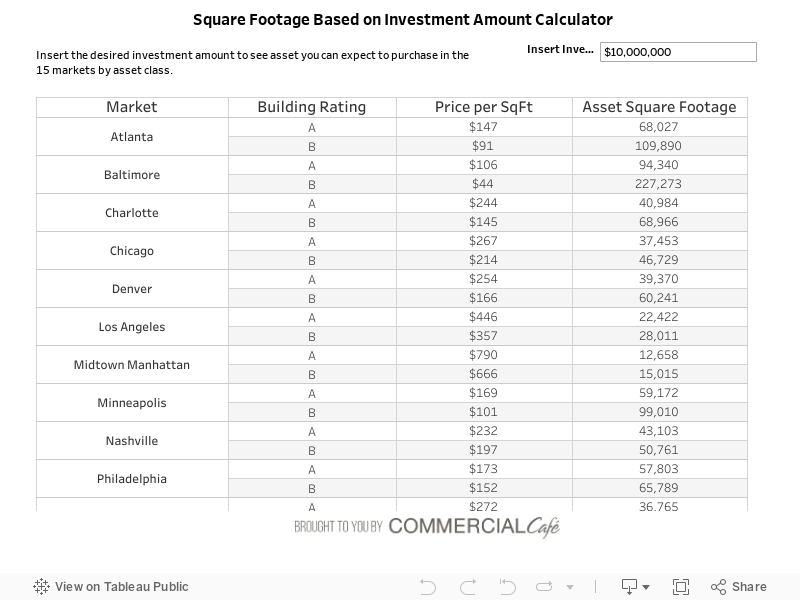
This calculator highlights the differences between CBDs. For example, while $36 million will get you 60,000 square feet of class A Washington, D.C. office space, for the same price you can get 245,000 square feet of class A office space in Atlanta.
Now, obviously, price isn’t the only variable to consider when making investment decisions. Each of these locations has different investment environments and risk profiles. Midtown Manhattan and the Chicago Loop are hot markets for big players and trophy assets, while Charlotte and Nashville may offer some more room to run. They both have growing tech sectors that are drawing startups from Silicon Valley, San Francisco, and Seattle in favor of both cheaper office space and a lower cost of living for employees.
The central business district isn’t always the most desirable location for assets though. South Bay represents a more decentralized market where the concentration of desirable assets spans north and westward; across Sunnyvale, Mountain View to Palo Alto. Other CBDs face competition from within their own MSA. Midtown Atlanta has had some impressive developments erected in the past years, including trophies like 1180 Peachtree and 1075 Peachtree. Seattle’s CBD also has competition from the Lake Union district thanks in part to Amazon.
Disclaimer: This content is for informational purposes only and does not constitute professional and/or financial advice of any kind.
Methodology
- Data source: Yardi Matrix.
- Median price was used to calculate price-per-square-foot for buildings.
- Transactions analyzed were of completed properties recorded between January 2017 and March 2019.
- Minimum amount per transaction: $5,000,000.
- All properties were over 50,000 square feet.
- Only individual property sales. No portfolio transactions.
- All markets included had at least 5 transaction over our selected period.


Patrick McGregor
Test
Patrick McGregor is a senior writer covering the real estate industry and overall economic trends in the United States for several Yardi product publications. He also holds an MBA from Thunderbird School of Global Management. Patrick was previously a commercial real estate analyst at Yardi Matrix for five years. His work has appeared in the New York Times, Bisnow, GlobeSt, The Real Deal, Business Insider, The Denver Post, The Motley Fool, and more.