
Initiatives that make up the U.S. startup economy may be small in scale, but they are large in number, increasingly diverse, and widely dispersed. Given the startup slump the economy has been experiencing during the past few years, we set out to identify where in the country entrepreneurs might find the best conditions for growing their businesses. We looked at the country’s 50 most populous urban centers, to identify the best cities for startups in the U.S.
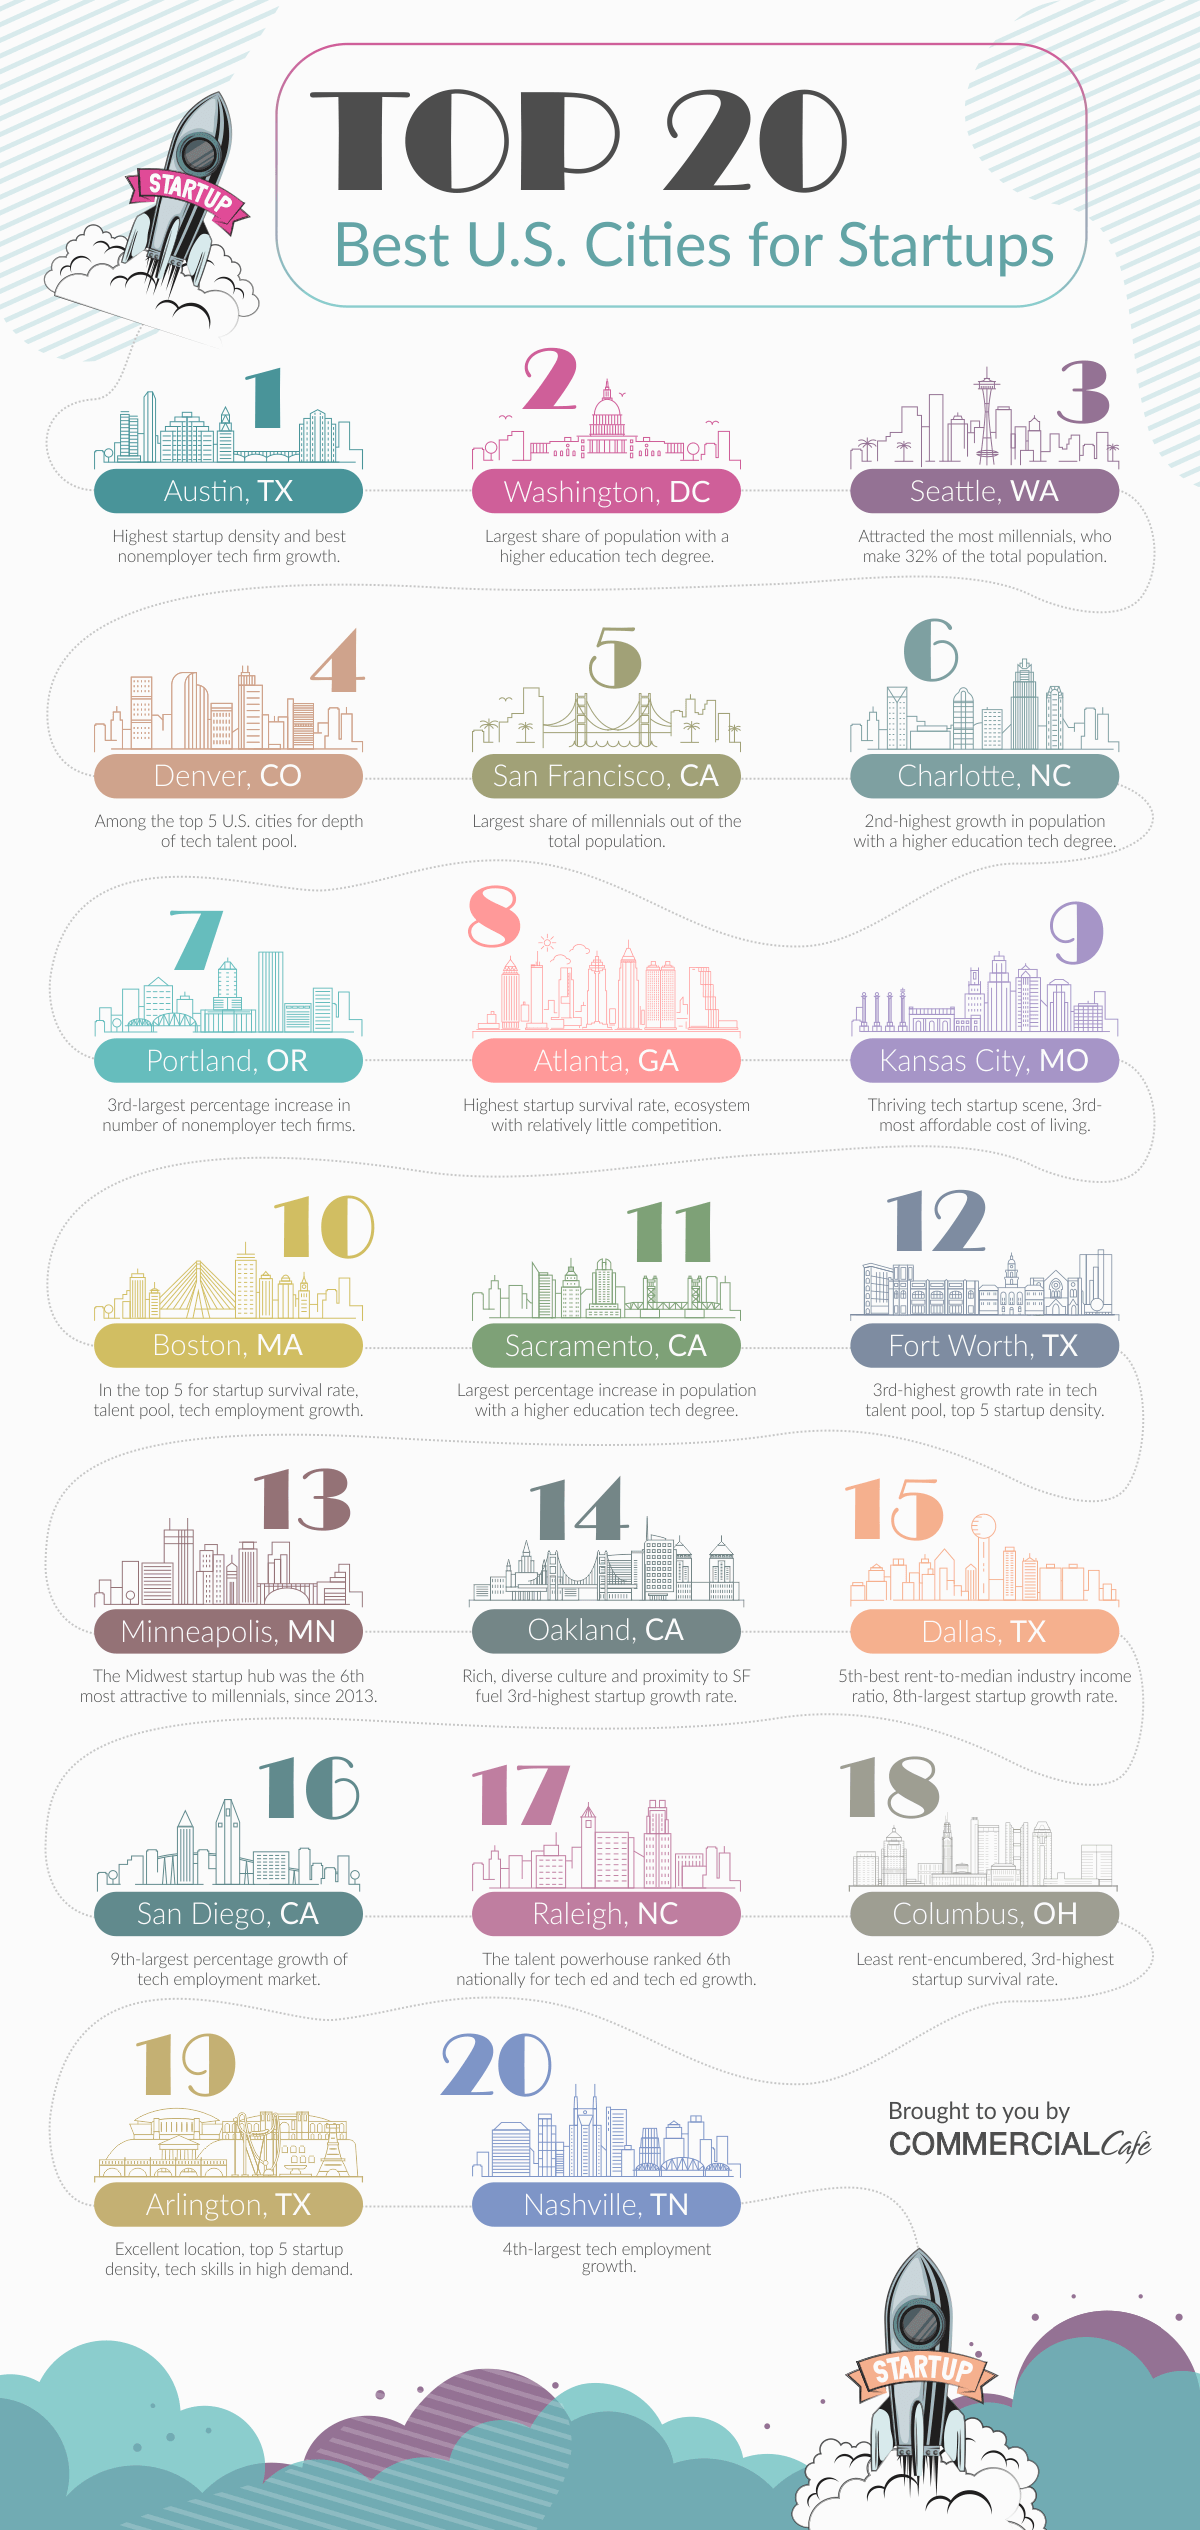
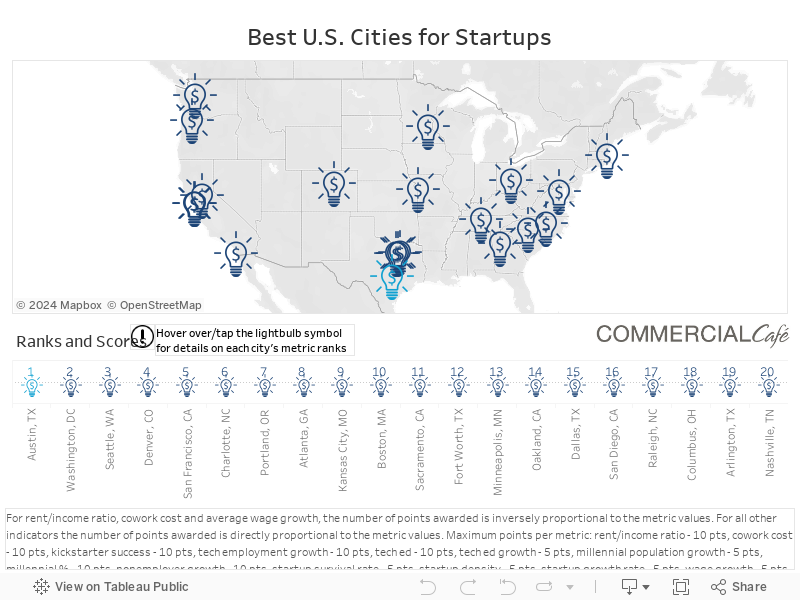
Our analysis focused primarily on factors relevant to early-stage tech startup success, detailed in the methodology section. The ranking below presents what we found to be the top 20 U.S. cities for early-stage startups. Austin continues to dominate, followed closely by talent-rich Washington D.C., and top millennial destination Seattle. The Denver startup scene continues to gain traction and climb national ranks, landing at number four. San Francisco rounds out the top five, ahead of Charlotte, Portland, and Atlanta. Read on to see the full list and highlights for each of the 20 cities.
According to the SBA 2018 Small Business Profile, there were over 30 million small U.S. businesses in 2017, employing nearly 59 million people, and accounting for approximately 48% of U.S. jobs. A recent entrepreneurship index going back to 2012 shows that, although access to capital and business ownership rate did not falter, job growth has been slowing since Q1 2017. While some researchers attribute it to rising market power, others say it’s due to the biggest breakthroughs having already been invented. More optimistic economy experts propose that it might be a simple case of implementation lag. For them, we might be living the times between the launch of revolutionary new technology and its visibility in productivity.
Whatever the case may be, startups create most of the new jobs in this country every year, having a direct impact on the economy of the cities they choose as their homes. The evolution of these small businesses often has the same timeline. For instance, small businesses start out as “nonemployer firms,” in which the owners wear all the hats. From establishing a business plan to securing a loan, to drawing investment capital, to successfully scaling operations, there are many factors that go into making a business happen and grow.
Navigate the slideshow directly below (swipe on mobile or use the slideshow left and right arrows) to check out highlights for each of the entries on the list.
Our analysis for wage growth, tech employment growth, tech ed growth, and millennial population growth is based on the most recent Census data available – 2017 – and goes back to 2013, covering a five-year period. Nonemployer growth is based on Census data for 2012 through 2016. Check out the methodology section for a detailed description.
Austin, TX
 When comparing the 50 most-populous cities in the U.S., Austin ranked first for startup density and for nonemployer growth, third for expansion of the tech jobs market, and fourth for growth in the millennial population. 2018 marked the eighth consecutive year in which Austin was the country’s fastest-growing major metro area. According to Census data, the city’s millennial population bracket increased 14% between 2013 and 2017, accounting for just over 31% of the local population. In terms of capital, the Austin startup community had one of its best years in 2018. According to PWC research, over $1.3 billion was invested, a local record in the two decades since the dot-com boom. The increased diversity of the local tech scene – which now includes e-commerce platforms, legal tech firms, tech-enabled services, health tech companies, food tech companies, and more – is slated to keep Austin in the lead of fertile startup cities for quite a while.
Freelancers, entrepreneurs, small businesses, and any creative professionals looking for local flexible workspace options can quickly and easily discover the best coworking space in Austin for their needs, on CommercialCafe.com!
Searching for a more traditional workspace layout? Explore the Austin office market with us!
Washington D.C.
 Washington D.C. is ranked first for tech education, having the largest percentage of the population with a higher education certification in a tech discipline. 12% of D.C. residents aged 25 to 39 held a bachelor’s degree or higher in Science and Engineering. However, the city ranked 11th in tech ed growth, having only seen a 7% increase in this education bracket. Average costs for coworking space in Washington D.C. account for roughly 3% of the median industry income, placing the capital 10th for this metric. The capital does not boast one of the country’s highest startup densities, but it did rank fifth for startup survival rate—we estimated that, in 2018, over 60% of new firms with up to four employees remained active past their first year. Tech talent abounds in D.C., and, although it’s not the cheapest talent around, wages have not exactly been skyrocketing. According to the most recent BLS data, wages for computer, mathematical, architecture, and engineering occupations in D.C. increased an average $942 in five years, the third-slowest wage increase on our list.
Searching for a more traditional workspace layout? Explore the Washington, D.C. office market with us!
Seattle, WA
 Out of the cities on our list, Seattle attracted the most millennials, seeing a five-year increase of 16%. At the end of that five-year period, they accounted for nearly 32% of the total population. Coming in second for tech education, the city boasted an 11.5% share of residents holding science and engineering bachelor’s degrees or higher. According to leading local entrepreneurs, the only thing the Seattle startup scene could use to sustain a thriving technology ecosystem is better local investor support. Although talent flocks to the city, new businesses are not created at a comparable pace. The number of startups only grew an estimated 1.6% year-over-year in 2018, with startup density at just over 14%. The number of nonemployer tech firms grew 2.5% over five years. Iinnovate Leadership Network and the University of Washington Bothell’s most recent report on the Greater Seattle innovation ecosystem indicates that, although 2018 has marked significant progress for the Puget Sound startup scene in terms of funding, over 50% of all VC investment came from outside the region, and early-stage funding was quite limited.
Freelancers, entrepreneurs, small businesses, and any creative professionals looking for local flexible workspace options can quickly and easily discover the best coworking space in Seattle for their needs, on CommercialCafe.com!
Searching for a more traditional workspace layout? Explore the Seattle office market with us!
Denver, CO
 Coming in at number four overall, Denver ranked among the top five for tech ed and millennial population growth. Not quite a “big city” yet, Denver’s burgeoning tech startup scene has the added advantage that the region itself draws young, vibrant, creative tech talent to build a life there. Nearly 8% of the city’s population aged 25 to 39 hold a science and engineering bachelor’s degree or higher, placing Denver fifth for tech ed, following a nearly 13% five-year growth in higher tech education-certified residents. Millennials make up nearly 32% of the population, ranking the Front Range city third. According to Census data, tech employment in Denver in computer, engineering, and science occupations grew 22% from 2013 to 2017. There was a roughly 3% five-year increase in the number of nonemployer firms. Another aspect that makes the city stand out to entrepreneurs pivoting to the Mile High tech scene is its characteristic collaborative dimension. The local startup community tends to put mentorship, relationships, and education first, which is perhaps what drives the impressive Denver coworking movement.
Freelancers, entrepreneurs, small businesses, and any creative professionals looking for local flexible workspace options can quickly and easily discover the best coworking space in Denver for their needs, on CommercialCafe.com!
Searching for a more traditional workspace layout? Explore the Denver office market with us!
San Francisco, CA
 San Francisco scored highest for share of millennials in total population – 32.3%, to be exact. The city ranked third for tech ed with 11.4% of residents aged 25 to 39 holding a science and engineering bachelor’s degree or higher. An estimated 4% more startups were founded last year than in 2017, landing San Francisco in third place for startup growth. For other important factors, however, Fog City ranked in the bottom 10. As startups increasingly struggle to draw funding in the shadow of regional giants like Facebook, Alphabet, and Apple, San Francisco ranked 18th for startup survival rate. In 2018, an estimated 59.5% of firms with up to four employees remained active after their first year. The generous wages offered by these same juggernauts also makes it quite difficult for very young firms with offices in San Francisco to attract the talent that is so essential to any innovative startup city. In fact, on our list, San Francisco ranked 18th for affordability of tech-skilled labor. All this is to say that the birthplace of the Silicon Valley phenomenon is not crumbling, but rather there are more and more signs saying that this tech scene is no longer in a high growth mode.
Freelancers, entrepreneurs, small businesses, and any creative professionals looking for local flexible workspace options can quickly and easily discover the best coworking space in San Francisco for their needs, on CommercialCafe.com!
Charlotte, NC
 While Queen City has already established its reputation as a thriving fintech hub, the community has been looking to diversify in recent years. Our analysis showed that these efforts seem to be paying off. Charlotte’s best scoring metric is the growth in tech ed-certified residents. The number of locals aged 25 and over holding a science and engineering bachelor’s degree or higher increased 15.4% in five years, which ranks Charlotte second on our list. The city’s next best strength is the increase in the number of nonemployer firms, of which the city saw a five-year increase of 3.2%. As far as the cost of living goes, Charlotte ranked among the less rent-burdened cities on our list, with the percentage of rent cost and cowork cost adding up to roughly 20% of the local median income for computer, mathematical, architecture, and engineering occupations. The same data also showed that wages for these occupations in the Charlotte area have increased an average $1,128 from 2013 through 2017. The Charlotte startup scene is also gearing up for growth the right way, with accelerator and mentorship programs such as Innovate Charlotte. Additionally, events like Seed the South, which seek to draw local funds for local entrepreneurs, are a bid to keep innovators thriving at home.
Freelancers, entrepreneurs, small businesses, and any creative professionals looking for local flexible workspace options can quickly and easily discover the best coworking space in Charlotte for their needs, on CommercialCafe.com!
Searching for a more traditional workspace layout? Explore the Charlotte office market with us!
Portland, OR
 Back in January, The Oregonian pointed out that although investment in Oregon startups reached a 20-year high last year little money went to early-stage startups. Just over a year ago, Inc.com pegged the vibrant Portland startup scene as the hottest new destination for entrepreneurs, The local newspaper also remarked that most investment goes into buying up startups that “made it,” whereas new firms are encouraged by circumstances to be “very capital efficient.” This environment does not seem to deter any of the local entrepreneurial spirit. In fact, Portland ranked third for increase in nonemployer firms with a 3.3% five-year increase in the number of single-person startups launched. The city also ranked among the top 10 for higher education in science and engineering. 2017 Census data showed a 12.6% increase in the number of residents with a bachelor’s degree or higher between 2013 and 2017, accounting for 6.8% of the Portland population aged 25 to 39. However, Census data also showed a mere 7.3% increase in the number of millennials during that time, landing Portland 20th for this metric. The city also ranked 18th for tech employment growth with a 10% increase in computer, engineering, and science occupation jobs.
Freelancers, entrepreneurs, small businesses, and any creative professionals looking for local flexible workspace options can quickly and easily discover the best coworking space in Portland for their needs, on CommercialCafe.com!
Searching for a more traditional workspace layout? Explore the Portland office market with us!
Atlanta, GA
 Of the cities we looked at, Atlanta ranked first for startup survival with an estimated 65.1% of firms with up to four employees active past their first year, in 2018. With a rich talent pool fed by institutions such as Georgia Tech and Emory University, Atlanta has earned its recognition as one of the country’s major hubs for startup companies. In 2017, millennials made up 28.6% of the city’s population, following a 15.3% five-year increase in numbers – a metric for which Atlanta ranked second, after Seattle. The city also ranked second for tech employment growth, with a 38% increase in computer, engineering, and science jobs over five years. “The A” also fared well in terms of talent affordability and living costs, ranking fourth for affordable tech wages, and among the top 10 cities for cost of living metrics – Atlanta apartments ranked 10th for affordability, and the cost of coworking space in Atlanta is fourth-most affordable our of the cities in this top 20. The metrics for which Atlanta ranked lowest include number of new nonemployer tech firms – ranked 17th, with only a 1.8% growth; tech ed growth – ranked 18th, with a 0.3% decrease in the number of residents holding a Science and Engineering bachelor’s degree or higher; and startup growth rate — ranked 19th, with an estimated 0.1% year-over-year increase in the number of startups in 2018.
Freelancers, entrepreneurs, small businesses, and any creative professionals looking for local flexible workspace options can quickly and easily discover the best coworking space in Atlanta for their needs, on CommercialCafe.com!
Searching for a more traditional workspace layout? Explore the Atlanta office market with us!
Kansas City, MO
 Kansas City ranked first for startup growth rate with an estimated year-over-year increase of 6.2% in the number of new startups in 2018 and ranked second for startup density. In 2018, out of the city’s total number of businesses of up to four employees, 15.6% were in existence for less than a year. Kansas City placed sixth for tech employment growth, boasting a 29% increase in computer, engineering, and science jobs over five years. Another important factor that bodes well for the KCMO startup scene is that the city ranks well among the most affordable U.S. office markets, as well as the least rent-encumbered, ranking third for rental affordability. However, the most recent report by local entrepreneurial network KCSourceLink found that, although the local innovative drive is strong, funding continues to be scarce for startups in their early stage. This might very well be why, despite the advantages it possesses, Kansas City ranked 13th for startup survival rate and 14th for nonemployer firm growth. Moreover, there are signs that tech-specialized labor pool is shrinking. According to Census data, there was a 1% five-year decrease in the number of Kansas City residents aged 25 and over that hold a bachelor’s degree or higher in Science and Engineering, which placed KC 19th for tech ed growth on our list.
Freelancers, entrepreneurs, small businesses, and any creative professionals looking for local flexible workspace options can quickly and easily discover the best coworking space in Kansas City for their needs, on CommercialCafe.com!
Searching for a more traditional workspace layout? Explore the Kansas City office market with us!
Boston, MA
 According to the latest Global Startup Ecosystem Report (GSER2019), Boston ranks among the top five startup environments worldwide, behind NYC and Silicon Valley, as well as among the sturdiest environments for biotech innovation and development. The research we conducted to identify the best cities for startups in the U.S. found that Boston ranks among the top five nationally for factors such as startup survival rate, specialized talent pool, and tech employment growth. With an estimated 65% of firms with up to four employees remaining active past their first year in 2018, Boston ranked second for startup survival. In 2017, 9.5% of residents aged 25 to 39 held a bachelor’s degree or higher in a science and engineering field, which placed Boston fourth for tech ed on our list. The number of jobs in computer, engineering, and science occupations increased 26%, landing Beantown in seventh place for tech employment growth. Despite being one of the most expensive places to live in the U.S., the city ranked 20th for rent affordability. Even so, Boston remains highly desirable to tech job seekers, indicated by the number of millennial residents growing 13%. However, most of these job seekers go into established companies or later-stage startups. According to the data we analyzed, Boston ranked 19th for growth in the number of nonemployer tech firms, as well as for density of startups younger than one year.
Freelancers, entrepreneurs, small businesses, and any creative professionals looking for local flexible workspace options can quickly and easily discover the best coworking space in Boston for their needs, on CommercialCafe.com!
Searching for a more traditional workspace layout? Explore the Boston office market with us!
Sacramento, CA
 Sacramento ranked first for three key metrics. With a 45% increase over five years in the number of jobs in computer, engineering, and science occupations, Sacramento placed first for tech employment growth. Census data showed that the number of residents aged 25 to 39 with a science and engineering bachelor’s degree or more increased by 16.6%, marking the largest percentage increase in tech educated talent pool. A 2017 report by JLL identified Sacramento as a “hidden gem” for its rich talent pool of computer programmers due to local science-grounded colleges like California State University at Sacramento and University of California at Davis. The report also noted the relative affordability of tech-skilled labor. In fact, among the cities on this list, Sacramento placed first for wage growth. BLS data on computer, mathematical, architecture, and engineering occupations showed that Sacramento saw the slowest average increase in median income. Moreover, the California state capital ranked among the top 10 for affordability of housing. Affordability of coworking space in Sacramento also ranked the city reasonably well – 11th for average cowork cost to median income ratio. The once sleepy government town is ripe for new tech companies to take shape here and feed the early-stage startup scene.
Freelancers, entrepreneurs, small businesses, and any creative professionals looking for local flexible workspace options can quickly and easily discover the best coworking space in Sacramento for their needs, on CommercialCafe.com!
Searching for a more traditional workspace layout? Explore the Sacramento office market with us!
Fort Worth, TX
 Fort Worth is coming into its own and embracing the startup scene. Efforts to capture and sustain economic development include plans by the city, chamber of commerce, transportation authority, and others to address the city’s issues with jobs, talent, funding, and image. Luckily, Fort Worth has quite a few advantages on which to build. The data we analyzed showed that the city is among the country’s least rent-encumbered, ranking fourth-most affordable for housing. Fort Worth has seen a 13.2% increase in the number of residents aged 25 to 39 that held a bachelor’s degree or higher in science and engineering, which placed it third for tech ed growth. Traditionally a manufacturing town, its inventive spirit carries into futuristic industries. Last year, the Fort Worth Now activation at SXSW festival showcased innovative local companies, with displays including a simulation of eVTOL (electric vertical takeoff and landing) technology, developed by the Bell Co. Fort Worth saw a 25% increase in the number of computer, engineering, and science jobs, ranking eighth nationally for tech employment growth. Even with some big companies now relocating elsewhere, with dedicated city efforts to support the startup community, the Fort Worth economy is looking up.
Freelancers, entrepreneurs, small businesses, and any creative professionals looking for local flexible workspace options can quickly and easily discover the best coworking space in Fort Worth for their needs, on CommercialCafe.com!
Searching for a more traditional workspace layout? Explore the Fort Worth office market with us!
Minneapolis, MN
 The collaborative community, great location, and affordable quality lifestyle attract over 30,000 working professionals to the Twin Cities Minnesota region each year. Minneapolis itself has become one of the hottest startup hubs in the Midwest. The city ranks sixth among the most attractive to millennials and has seen a 13% five-year increase in the millennial population. The median income for computer, mathematical, architecture, and engineering occupations has increased an average $1,661, which placed Minneapolis 13th for wage growth on our list. According to our estimations of rent-to-median income ratio, the city also placed 13th for housing affordability. The lowest cost on the list, however, was for coworking space. Minneapolis ranked second for affordable cowork cost with the starting price of monthly coworking time accounting for an estimated 2.4% of the median income.
Freelancers, entrepreneurs, small businesses, and any creative professionals looking for local flexible workspace options can quickly and easily discover the best coworking space in Minneapolis for their needs, on CommercialCafe.com!
Searching for a more traditional workspace layout? Explore the Minneapolis office market with us!
Oakland, CA
 Last year’s third-most sustainably powered city in the U.S., Oakland came in 14th overall on our list of top cities for startups in 2019. The local tech startup scene thrives on the community’s diversity. Oakland’s tech sector is actively encouraged towards sustainable and equitable growth, local hiring, and nourishing a rich cultural environment. As with most developing startup hubs, funding available for early-stage enterprises is limited. Among the cities on our list, Oakland came in ninth for startup density, third for startup growth rate, but 18th for startup survival. Tech talent available to new companies may also be in limited supply as Oakland’s proximity to San Francisco and the main hub of Silicon Valley makes it easy for established companies to take the lion’s share of the labor pool. The computer, engineering, and science occupations hiring market has expanded, and the number of jobs has increased 21%, placing Oakland 12th for tech employment growth. Many have chosen the East Bay as a respite from the notoriously high cost of living in San Francisco, supplying more specialized talent to the Oakland startup scene. Roughly 6.5% of residents aged 25 to 39 held a science and engineering bachelor’s degree or higher in 2017, following a 4.9% increase in numbers over five years. The millennial population bracket grew 12.9% during that same time, and in 2017 made up 28% of the city’s total population. Despite being one of the more rent-encumbered cities on our list, Oakland has plenty going for it in the way of innovative success.
Freelancers, entrepreneurs, small businesses, and any creative professionals looking for local flexible workspace options can quickly and easily discover the best coworking space in Oakland and the East Bay area for their needs, on CommercialCafe.com!
Searching for a more traditional workspace layout? Explore the Oakland office market with us!
Dallas, TX
 The larger element of Texas’ famous metroplex stood out in our analysis as one of the cheaper cities in which to live. Ranking third for cowork cost affordability and fifth for rent-to-income ratio, Dallas is a place where a tech salary can stretch a long way. BLS data showed that the median income for computer, mathematical, architecture, and engineering occupations increased on average $2,412. The Dallas Business Journal reported at the start of last year that technology workers in this metro area made 10% more than the national average. Dallas ranked 19th for wage growth on our list. Talent here is not cheap, but neither is it in short supply. Census data showed a 9% increase in number of residents aged 25 and over, holding a Science and Engineering Bachelor’s degree or higher, landing Dallas in eighth place for tech ed growth. The hiring market expanded by a 20% increase in the number of computer, engineering, and science jobs, placing the city 13th for tech employment growth. Dallas is one of only four cities in the country to have a regional U.S. patent and trademark office, a recognition of the strong innovative and disruptive spirit in the region. Dallas came in third for startup density, as 15.6% of the city’s total businesses of up to four employees were newer than one year. An estimated 62.7% were active past their first year in existence, which put Dallas in 10th place for startup survival rate.
Freelancers, entrepreneurs, small businesses, and any creative professionals looking for local flexible workspace options can quickly and easily discover the best coworking space in Dallas for their needs, on CommercialCafe.com!
Searching for a more traditional workspace layout? Explore the Dallas office market with us!
San Diego, CA
 San Diego had the second-highest startup growth rate in our top 20. In 2018, the city saw an estimated 4.5% year-over-year increase in the number of new startups founded. Out of the city’s total businesses of up to four employees, 15.4% were operating within their first year, ranking sixth for startup density. Additionally, an estimated 55.5% were operational past their first year of activity and although this is a good overall percentage, it landed San Diego 20th for startup survival rate. “America’s Finest City” is also one of its fastest-growing. Census data showed a 12.4% increase in the number of millennials between 2013 and 2017, at the end of which they made up 27% of the population. San Diego is already a well-established hub of tech startups, with an ever-growing networking and funding infrastructure. And with lower living costs and more affordable homes for sale and houses for rent in San Diego than in the Bay Area, it has been a magnet for innovative professionals. The city ranked ninth for tech employment growth, after a 24% increase in the number of computer, engineering, and science jobs. Even in the presence of large communications, biotech, and defense companies, there seems to be enough talent to go around. San Diego ranked seventh for nonemployer growth, with an average 2.7% increase in the number of new one-person enterprises.
Freelancers, entrepreneurs, small businesses, and any creative professionals looking for local flexible workspace options can quickly and easily discover the best coworking space in San Diego for their needs, on CommercialCafe.com!
Searching for a more traditional workspace layout? Explore the San Diego office market with us!
Raleigh, NC
 The resources of the Triangle Region have been a boon for Raleigh’s startup scene. With universities producing top talent, a competitive cost of living, and support networks such as the Research Triangle Regional Partnership, it is not surprising to see Raleigh among the 20 best cities for startups in the U.S. The City of Oaks came in sixth for housing affordability, with a rent-to-income ratio low enough to offset the city’s ranking of 14th for cowork cost. Nearly 7% of residents aged 25 to 39 held a bachelor’s degree or higher in science and engineering in 2017. The number of Raleighites aged 25 or over holding such higher-education degrees, increased 10.7% over five years. The city ranked sixth for tech ed and for tech ed growth. Expansion of the hiring market in computer, engineering, and science occupations landed Raleigh in 19th place for tech employment growth, following a modest 5% increase in the number of jobs. Entrepreneurial activity, however, is booming. Census data showed that there was a 3% increase in the number of nonemployer tech firms, placing Raleigh fifth. Nearly 15% of all Raleigh businesses with up to four employees in 2018 were in operation for less than a year – 11th for startup density – and an estimated 64.6% were active past their first year, landing Raleigh in fourth place for startup survival rate.
Freelancers, entrepreneurs, small businesses, and any creative professionals looking for local flexible workspace options can quickly and easily discover the best coworking space in Raleigh for their needs, on CommercialCafe.com!
Searching for a more traditional workspace layout? Explore the Raleigh office market with us!
Columbus, OH
 Columbus is the least rent-encumbered city on our list, with average local rent accounting for approximately 13.6% of the median income for computer, mathematical, architecture, and engineering occupations. With average costs for using coworking space in Columbus accounting for less than 3% of the median income, the city placed ninth for this cost of living metric. The number of millennial residents increased by 12.4% and now accounts for just over 28% of the city’s total population. The city ranked 13th for nonemployer firms growth, following a 2.2% five-year increase in the number of new one-person operations. Last year, an estimated 64.8% of startups with up to four employees were active past their first year in operation, landing Columbus third for startup survival rate. Meanwhile, 12.4% were still in their first year of activity, placing the city 18th for startup density. The Columbus ecosystem offers the kind of industry variety that creates plenty of opportunity for innovation. Within a couple of hundred square miles, the city offers manufacturing, farming, retail, brewing, e-commerce, and more. In 2017, the city won a sizeable federal grant to fund turning Columbus into the testing ground for intelligent-transportation systems. With large venture funds having recently come to town, Columbus is sure to climb higher on the list of top U.S. cities where tech entrepreneurs can thrive.
Freelancers, entrepreneurs, small businesses, and any creative professionals looking for local flexible workspace options can quickly and easily discover the best coworking space in Columbus for their needs, on CommercialCafe.com!
Searching for a more traditional workspace layout? Explore the Columbus office market with us!
Arlington, TX
 Although located in the heart of the largest metroplex in Texas, and fourth-largest nationwide, the cost of cowork office space in Arlington ranked best, and housing affordability ranked second. The city is home to the University of Texas Arlington, a notable driver of entrepreneurship in North Texas, yet Census data showed little in the way of millennial appeal and tech growth compared to the other 19 cities on the list. Arlington ranked 20th for population percentage of millennials, a bracket that made up 22.2% of the total population. According to Census data, there was a 0.2% increase in the number of residents aged 25 and over who held a bachelor’s degree or higher in science and engineering, landing Arlington in 17th place for tech ed growth. Only 2.1% of residents aged 25 to 39 hold similar certification, placing the city 20th for tech ed. Arlington also rounded out the list by ranking 20th for tech employment growth. The number of jobs in computer, engineering, and science occupations decreased by 16%. Startup indicators, however, paint a hopeful picture for Arlington’s potential to come into its own as a startup hub. The number of nonemployer tech firms increased 2.6%, landing Arlington in eighth place. With a 2.3% year-over-year increase in the number of startups last year, Arlington came in seventh for startup growth rate. An estimated 15.6% of startups with up to four employees were in their first year of activity, which placed Arlington third for startup density. Furthermore, an estimated 62.7% were active past their first year in operation, which put Arlington in 10th place for startup survival rate.
Freelancers, entrepreneurs, small businesses, and any creative professionals looking for local flexible workspace options can quickly and easily discover the best coworking space in Arlington and the wider Mid-Cities area for their needs, on CommercialCafe.com!
Searching for a more traditional workspace layout? Explore the Arlington office market with us!
Nashville, TN
 The Music City ranked second for nonemployer tech firms, increasing 3.7% over five years. The hiring market for computer, engineering, and science education occupations expanded with 36% more jobs, landing Nashville in fourth place for tech employment growth. An estimated 15.1% of the city’s startups with up to four employees were still in their first year in operation in 2018 – seventh for startup density – and 61.1% had been active for more than one year, placing the city 15th for startup survival rate. Nashville has long been a healthcare powerhouse and has only recently begun to come around to tech startups, so access to capital for non-health tech industry innovators can still be quite a challenge. A recent feature by Inc.com noted that tech talent outside the healthcare and music industries does not abound, yet it is in increasingly high demand. Census data showed that 3.8% of residents aged 25 to 39 held a bachelor’s degree or higher in science and engineering. This percentage placed Nashville 16th for tech ed on our list. Data also showed a rather slow increase in numbers for this segment of the population, only 0.5% in five years. While there have been notable tech startup exits, such as Emma, the $1 billion unicorn exit that pours mentorship and other resources back into the community has yet to happen.
Freelancers, entrepreneurs, small businesses, and any creative professionals looking for local flexible workspace options can quickly and easily discover the best coworking space in Nashville for their needs, on CommercialCafe.com!
Searching for a more traditional workspace layout? Explore the Nashville office market with us!
Methodology
Taking into account the significant current economic shift towards digital mediums, we focused our analysis on metrics we deemed relevant to the success of early-stage tech startups. Data on nonemployer firms and startups with up to four employees is essential to gauging if and how well the local business environment encourages entrepreneurial activity. Kickstarter success rates can be corroborated with insufficient access to early stage funding at a local level. Stats on higher education attainment in the workforce are highly relevant to the depth of the local tech talent pool. Looking at tech employment trends helps determine the level of interest and demand in the industry, locally.
We looked at industry wage growth and the share of housing rental and cowork cost out of the median industry income as factors relevant to cost of labor, important to the business owner, and cost of living, important to prospective employees. Millennials lead on adoption of technology, creating not just most of the demand for new technology, but also the population bracket most likely to work in a tech industry. Therefore, we considered it to be highly relevant to look at the share of millennials out of total local population, as well as millennial population growth for each city.
Choosing the Cities
For this ranking, we assigned composite scores based on several metrics to the 50 most populous U.S. cities for which data on all factors was available*. Population totals considered for city selection are according to U.S. Census estimates for 2017. This criterion was not factored into the scoring system.
The 20 cities ranked in this study are: Arlington, Texas; Atlanta, Ga.; Austin, Texas; Boston, Mass.; Charlotte, N.C.; Columbus, Ohio; Dallas, Texas; Denver, Colo.; Fort Worth, Texas; Kansas City, Mo.; Minneapolis, Minn.; Nashville, Tenn.; Oakland, Calif.; Portland, Ore.; Raleigh, N.C.; Sacramento, Calif.; San Diego, Calif.; San Francisco, Calif.; Seattle, Wash.; Washington, D.C.
Metrics, Scores, and Points
For each metric, the number of maximum points was evenly distributed between the lowest and the highest metric values. On this scale, a score was calculated for each city, based on its metric values. The factors (metrics) on which we based the composite scores are explained below. For rent burden, cowork cost and average wage growth, the number of points awarded is inversely proportional to the metric values. For all other indicators, the number of points awarded is directly proportional to the metric values.
“Nonemployer growth” tracks the average year-over-year growth in the percentage of tech businesses that have no employees and are subject to federal income tax, based on U.S. Census Bureau data from 2012 through 2016. Data for this metric was only available at metro level. Values scored represent a five-year trend and are expressed as percentages. The maximum weight for this metric is 10 points.
“Startup survival rate” refers to the percentage of new firms with up to four employees that made it through the first year of activity. We used the Microsoft Excel Forecast formula to estimate values for 2018/2017/2016/2015, based on the trend described by 2014 to 2010 U.S. Census Bureau data. Data for this metric was only available at metro level. Values scored represent 2018 estimates and are expressed as percentages. The maximum weight for this metric is five points.
“Startup density” refers to the percentage of businesses that have been active for less than one year out of each city’s total businesses of up to four employees. We used the Microsoft Excel Forecast formula to estimate values for 2018/2017/2016/2015, based on the trend described by 2014 to 2010 U.S. Census Bureau data. Data for this metric was only available at metro level. Values scored represent 2018 estimates and are expressed as percentages. The maximum weight for this metric is five points.
“Startup growth rate” tracks the year-over-year change in the number of startups in each city. We used the Microsoft Excel Forecast formula to estimate values for 2018/2017/2016/2015, based on the trend described by 2014 to 2010 U.S. Census Bureau data. Data for this metric was only available at metro level. Values scored represent 2018 estimates and are expressed as percentages. The maximum weight for this metric is five points.
“Kickstarter success” refers to projects that have reached their funding goals and unlocked their Kickstarter capital. For this study, we looked at the percentage of successful tech projects out of all Kickstarter tech projects in each city from 2009 through 2018. Values scored represent the success rate over the entire period. The maximum weight for this metric is 10 points.
“Tech ed” represents the percentage of a city’s population that holds a bachelor’s degree or higher, based on 2017 U.S. Census Bureau data on Science and Engineering degrees for the population aged 25 to 39. Values scored represent 2017 data. The maximum weight for this metric is 10 points.
“Tech ed growth” represents the change in totals population that holds a bachelor’s degree or higher in Science and Engineering, based on U.S. Census Bureau data from 2013 through 2017, for the population aged 25 and over, in each city. Values scored represent a five-year trend and are expressed as a percentage. The maximum weight for this metric is five points.
“Tech employment growth” refers to computer, engineering and science occupations, tracks job growth for each city based on U.S. Census Bureau data from 2013 through 2017 and is expressed as a percentage. Values scored represent a five-year growth rate. The maximum weight for this metric is 10 points.
“Wage growth” tracks the average year-over-year growth of the median income in each city, based on U.S. Bureau of Labor Statistics data for 2013 through 2017, for “computer,” “mathematical,” “architecture,” and “engineering” occupations. Data on median income was only available at metro level. Values scored represent a five-year average of wage growth. The maximum weight for this metric is five points.
“Rent/income ratio” refers to the percentage of average rent out of the median income. The average rent for each city was calculated based on February 2019 Yardi Matrix rent data. Median income was calculated based on latest available U.S. Bureau of Labor Statistics data for “computer,” “mathematical,” “architecture,” and “engineering” occupations (2017) and adjusted for inflation. Data on median income was only available at metro level. Values scored represent 2019 rent burden estimates. The maximum weight for this metric is 10 points.
“Coworking cost” represents the percentage of the average monthly starting price for coworking time, out of the median income. Coworking cost averages were based on March 2019 Regus online prices. Median income was calculated based on latest available (2017) U.S. Bureau of Labor Statistics data for “computer,” “mathematical,” “architecture,” and “engineering” occupations and adjusted for inflation. Data on median income was only available at metro level. Values scored represent 2019 cowork cost burden estimates. The maximum weight for this metric is 10 points.
“% Millennial” represents the percentage of millennials out of each city’s total population, based on latest available U.S. Census Bureau data. Values scored are 2017 demographic percentages. The maximum weight for this metric is 10 points.
“Millennial population growth” tracks the change in each city’s Millennial population, based on U.S. Census Bureau data from 2013 through 2017. Values scored represent the change in the millennial population over a total of five years. The maximum weight for this metric is five points.