Cali Q2 Office Sales Report – Bay Area, San Francisco Boast Highest Prices


The California office market had an overall strong second quarter, with 57 large transactions closed across six major markets: Los Angeles, the Bay Area, San Francisco, Orange County, Sacramento and San Diego (see ‘Methodology’). In-depth Yardi Matrix data shows that, while there are significant differences among markets, the Golden State boasts a strong office scene that continues to attract investors.
San Francisco, Bay Area Most Expensive Markets in Q2
In terms of office sales volume, Los Angeles leads the pack, with 19 major sales closing for a total of $2.2 billion in Q2 2017. The Bay Area was the second-most attractive market for investors in Q2, with 16 deals closed for a total of $1.1 billion, and the average price per square foot surpassing the prices found in L.A. Coming in third with seven deals closed for a combined volume of $777 million, San Francisco boasts the highest average price per square foot among all the six markets we looked at. Trophy office assets in the area traded at an average of $555 per square foot in Q2 2017, $232 more than what office buyers pay for office buildings in Los Angeles and more than double the average price in Orange County.
What our data shows is that San Francisco and the Bay Area were the most expensive office markets in California at the close of Q2, despite the fact that Los Angeles recorded a larger number of transactions and a much higher dollar volume. The Orange County office market also managed to attract a good deal of capital in the year’s second quarter, while smaller markets such as Sacramento and San Diego lagged behind the rest of the West Coast in terms of office sales activity.
Blackstone Parts Ways with LA Tower in Largest Q2 Sale
There were a total of 57 large office transactions that closed in the six California markets we looked at during Q2 2017. The bulk of transactions closed in Los Angeles and the Bay Area, while the other four markets each saw less than 10 notable office transactions close over the past three months. The 10 largest office sales of Q2 were a mixed bag. Six out of the 10 largest sales were portfolio or partial stake deals, including the largest trade of the quarter: the $573 million sale of the SunAmerica Center in Los Angeles.
Los Angeles Q2 Sales Volume Tops $2B Mark Again
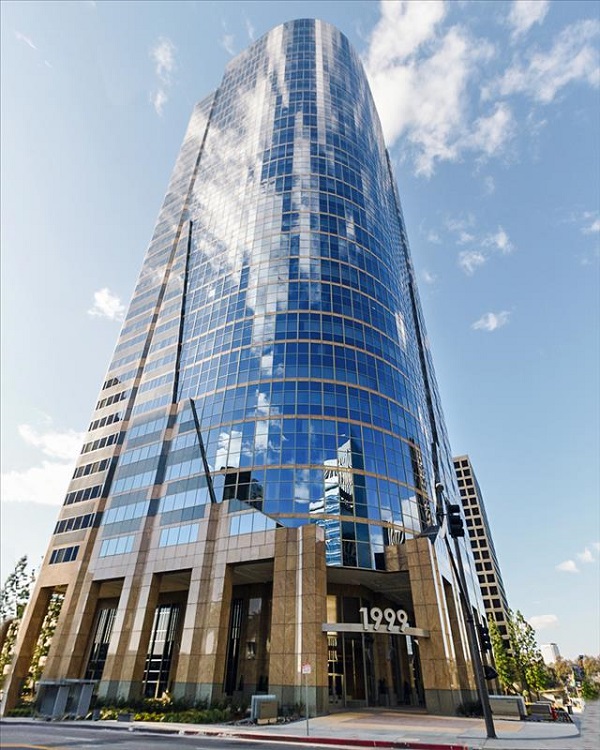
1999 Avenue of the Stars, Los Angeles (Yardi Matrix)
The Los Angeles office market is firing on all cylinders, leading the pack of California markets in terms of dollar volume and number of sales in Q2. A total of 19 large office transactions closed in the past quarter for $2.2 billion in sales volume–the market’s best Q2 volume in the past five years. The number of deals might have dropped compared to the year’s first quarter, yet dollar volume increased 39% from Q1 to Q2, signaling that buyer interest continues to be strong. Furthermore, the average price per square foot for office assets trading on the market increased 13% year-over-year, resting at $323 at the close of Q2. Prices also rose 16% from Q1 to Q2, to a level roughly on par with the five-year average.
The largest sale to close in Los Angeles in Q2–and the largest overall office sale of the quarter–was JMB Realty’s $573 million purchase of 1999 Avenue of the Stars in Century City. JMB Realty bought back its 66.6% interest in the property from Blackstone affiliate Equity Office Properties Trust in April, with the help of a $425 million permanent loan from Goldman Sachs. The $573 million price tag was nearly eight times higher than when Equity Office bought the partial stake from JMB in 1999, per Yardi Matrix data.
Bay Area Average Prices Surpass LA’s by 29%
The Bay Area office market was the second-best performing market among those we analyzed, even with a slight drop in sales volume. Ending the second quarter with 16 major deals closed, the Bay Area recorded its fifth consecutive quarter to top the $1 billion mark in terms of office sales volume. Close to 2.5 million square feet of space traded in Q2 2017 for a total of $1.1 billion–a 25% decrease year-over-year and a 14% drop compared to the Q1 volume. Nonetheless, in terms of the average price per square foot, the Bay Area market surpassed Los Angeles in Q2 by 29%. Prices reached an average of $416 per square foot at the close of the second quarter–the highest number in the past five years.
The largest transaction to close on the Bay Area market in Q2 was the $197 million sale of The Grove – Buildings III & IV in Los Gatos, Calif. King Asset Management acquired the two buildings from the Sand Hill Property Co. in June, with the help of a $70 million loan held by Principal Financial Group. Formerly known as Los Gatos Business Park, the 10-building R&D campus located on 21.5 acres is currently undergoing a massive makeover. All existing buildings are being demolished and replaced with Class A office developments, according to Sand Hill. The 137,168-square-foot Building III and the 105,332-square-foot Building IV were recently completed and are already pre-leased to Netflix.
San Francisco Boasts Highest Average Price per Square Foot
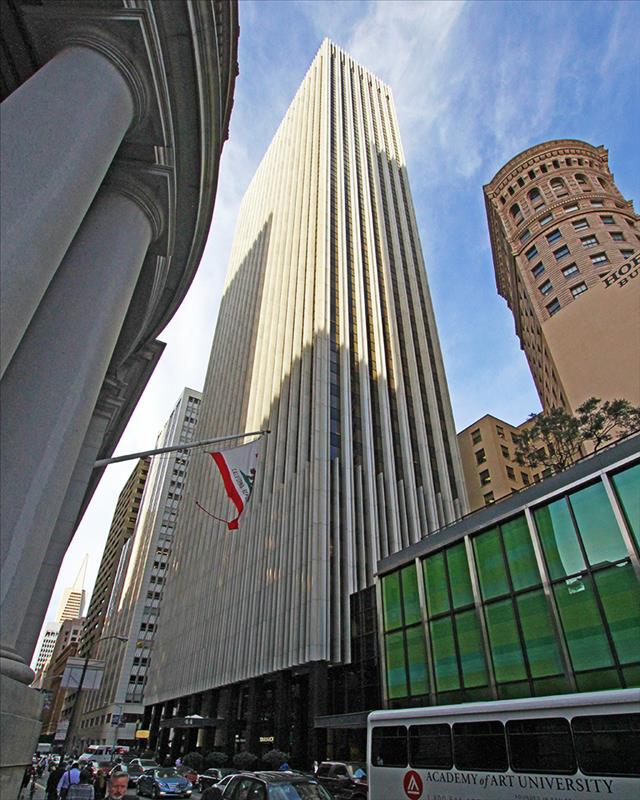
44 Montgomery St., San Francisco (Yardi Matrix)
The San Francisco office sales market lagged behind Los Angeles and the Bay Area in Q2 in terms of sales volume. Just seven notable office transactions closed on the market in the year’s second quarter, for a combined sales volume of $777 million–well below the average of the past five years and nearly half the volume recorded in Q2 2016. After 14 consecutive quarters of over $1 billion in sales volume, the market seems to have hit the brakes in Q2 2017. Still, despite the sudden drop in number of sales and dollar volume, San Francisco still boasts the highest prices among the California markets. The average price per square foot for office assets trading on the market did fall 16% year-over-year, yet rested at $555 at the close of Q2. Prices in San Francisco reached a five-year peak of $700 per square foot in the last two quarters of 2016, so the market might just be cooling down to a more sustainable level.
The largest deal to close in San Francisco in Q2 was also the second-largest sale of the quarter. Back in April, Beacon Capital Partners shelled out $475 million to acquire the property at 44 Montgomery St. from Seagate Properties. Located in the city’s Financial District, the 43-story, 746,384-square-foot tower was built in 1966 and renovated in 1992. Managed by Avison Young, the Class A property includes 2,000 square feet of retail space and is home to Monsanto and Related Cos., among others.
Orange County Office Sales Picking Up the Pace in Q2
The Orange County office market ended Q2 with nine major transactions and $462 million in sales volume–the market’s best second quarter in five years. The Q2 volume rose above the five-year average and climbed 44% year-over-year, even with a smaller number of deals closed. The average price per square foot for office properties trading on the market has been hovering above the $200 mark for the past five quarters, reaching $214 at the end of Q2. Though prices were on a slight downward path in the first two quarters of 2017, the total dollar volume and total square footage traded increased, signaling that investors might just be shifting their attention from Class A assets to more affordable options.
The largest deal to close in Orange County in Q2 was the $220 million sale of Centerview East & West in Irvine, Calif. In April, Emmes acquired the two 12-story, Class A office buildings from Shorenstein, in a deal funded by a $162 million loan held by KKR. The 280,870-square-foot Centerview East at 2010 Main St. was built in 1988 and is home to tenants such as ORION, the California State Teachers Retirement System and Mueller Prost. Located at 1920 Main St., the 280,890-square-foot Centerview West currently houses tenants including NAI Capital, Avanath Capital Management and Colony American Finance.
Sacramento, San Diego Lag Behind Other California Markets
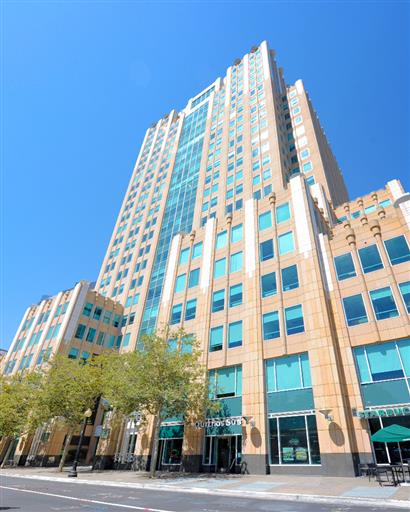
Park Tower, Sacramento (Yardi Matrix)
The Sacramento office market is moving into Q3 with rising prices and increased buyer interest, judging by the numbers recorded in the second quarter. Quarterly sales volume more than doubled compared to Q1, reaching $276 million at the close of Q2. A total of four large office transactions were recorded during the past quarter, at an average of $338 per square foot–the highest number of the past five years.
The largest office deal to close during Q2 was the $121 million sale of the 25-story Park Tower building at 980 9th St. Hines Interests purchased the 447,000-square-foot, Class A+ property from CIM Group, with the aid of an $88 million permanent loan held by Aareal Bank, according to Yardi Matrix data. The LEED Gold-certified asset includes 11,500 square feet of retail and is home to tenants such as Golden Pacific Bank, Newmark Cornish & Carey and Regus.
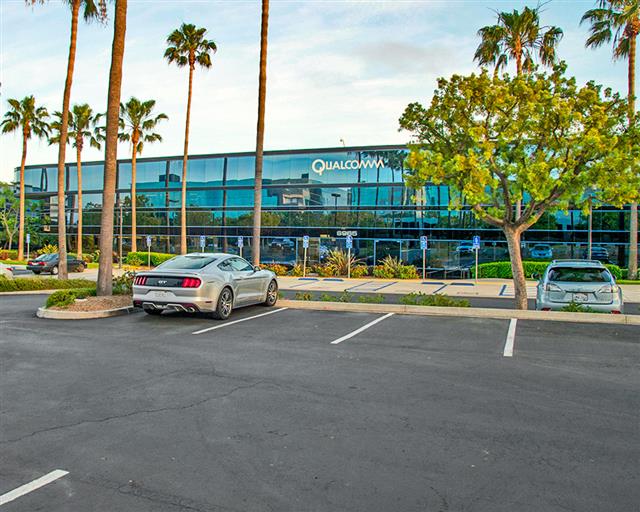
Sorrento Heights Innovation Center, San Diego (Yardi Matrix)
San Diego proved to be the weakest market among those we analyzed, with only two notable deals closed during Q2 2017, for a total of $46 million. Our data, which includes sales recorded up until July 19th, shows that the past quarter was the slowest in five years for the San Diego office market. The overall sales volume fell below the $100 million mark for the first time in five years, with only two properties changing hands, totaling 182,290 square feet of space. On the other hand, the average price per square foot actually increased from Q1 to Q2, resting at $253 at the close of the second quarter–above the average of the past five years.
The largest deal to close in San Diego was the $26 million sale of the Sorrento Heights Innovation Center in Sorrento Valley. The 124,290-square-foot Class B property at 6965 Lusk Blvd. was built in 1990 and is home to Qualcomm. HCP bought the property from Colony Partners in June, at nearly $210 per square foot, per Yardi Matrix.
More Than 11M Square Feet of Office Space on Track for Q3 Delivery
There were 15 large office deliveries across the six markets we looked at in Q2, adding 3.2 million square feet of space to the California office scene. In Los Angeles, the most notable delivery was the Wilshire Grand Center, the tallest building in California and west of the Mississippi, while in Cupertino, the Apple Park project at 10435 North Tantau Ave. also reached completion. The Bay Area, Orange County and L.A. markets were the busiest in terms of office construction in Q2, while San Francisco, Sacramento and San Diego each saw one major office project come online.
The third quarter of 2017 is expected to bring 40 large office projects comprising over 11 million square feet of space to the California market. A total of 16 projects are currently in the works in the Bay Area, 10 in San Francisco, 7 in Los Angeles, 4 in San Diego and 3 in Orange County, all scheduled for completion in Q3. The largest delivery of the quarter will be Apple’s 2.9 million-square-foot development at 10955 North Tantau Ave. in Cupertino, which has been in the works since 2014. In San Diego, BioMed Realty will complete its 316,000-square-foot i3 project at 4775 Executive Drive, while in San Francisco, HCP will finalize work on The Cove at Oyster Point I & II. Trammell Crow will also complete its Boardwalk project at 18691 Jamboree Road in Irvine, Calif., adding 550,000 square feet of office space to the Orange County market.
Methodology
- Data source: Yardi Matrix (download raw data);
- Markets: Los Angeles, Orange County, San Francisco, the Bay Area, San Diego and Sacramento;
- Square footage parameters – over 50,000 square feet;
- Minimum amount per transaction – $5,000,000;
- Transactions recorded until July 14th, 2017;
- We excluded ‘ownership stake,’ ‘ground lease,’ ‘controlling interest’ and ‘portfolio’ deals from our calculation of the average price per square foot;
- *Some of the prices were calculated based on ‘tax-transfer’ formula.
By Ioana Neamt


Contributor
Our contributor content includes articles written by guest authors who are professionals in a variety of relevant fields and have contributed their expertise and detailed understanding of a range of topics, including: PropTech; real estate marketing tools and strategies, commercial real estate trends evolution; work-life balance management guidance and resources; workspace management and design; and more.