Healthcare and Business Occupations Top the Fastest Growing Jobs in the US


Job growth in the United States is a hot topic right now as unemployment is the lowest it’s been since the 50’s. Monthly jobs reports are causing stock market fluctuations as well. There are many variables that go into that report, such as the types of jobs, the industries, and the expected term (seasonal vs full-time).
Using data from the Bureau of Labor Statistics, we looked at the fastest growing jobs over the last 10 years. Interestingly, there has been virtually no change in where jobs are located on a state level from 2009 and 2018, even though California alone added almost 2.5 million jobs across all industries.
Personal Care Aide Jobs Almost Triple in a Decade
The graph below shows the seven jobs that experienced growth of over 100% in the last 10 years.
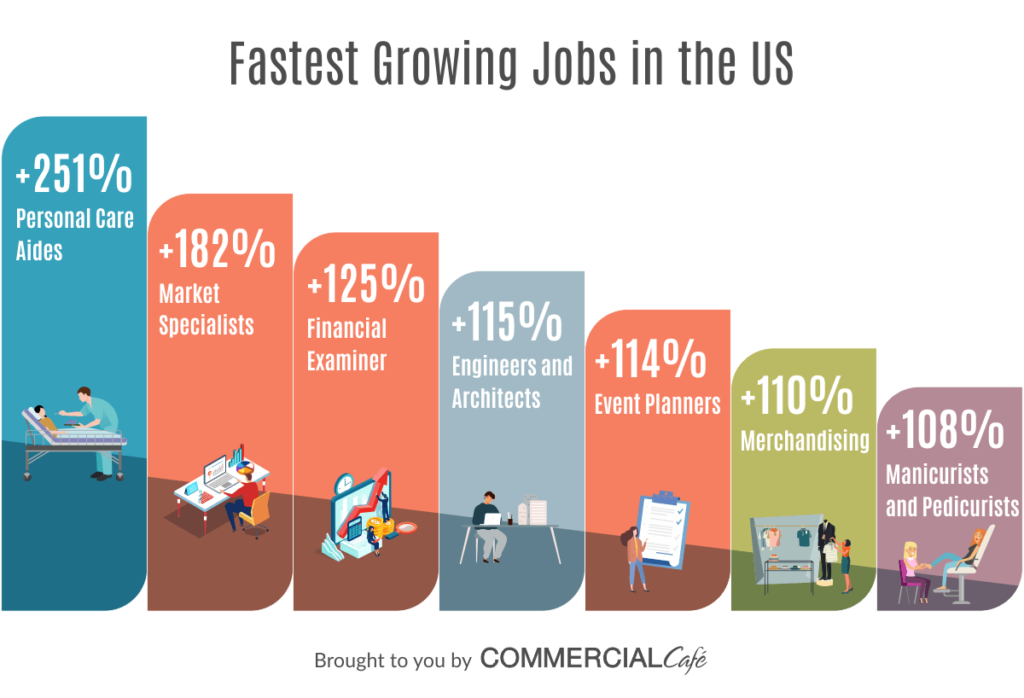
Personal Care Aide jobs rose 251% in the last 10 years, reaching over 2.2 million jobs. As the US population ages and the Baby Boomer generation retires, more jobs in healthcare will continue to be needed. Market Specialist jobs have grown by 182% over the same period to a total of 638,000. As technology evolves to provide new ways of data accumulation, the need to translate that data should increase as well.
It should be highlighted that even though these are the fastest growing jobs in the last 10 years, the number of jobs can vary widely. While Personal Care Aide is the fastest growing job with over 2.2 million jobs currently, Financial Examiners, the third fastest growing job, has just under 60,000 jobs nationwide.
Healthcare and Business Jobs Grow the Most
Below is a map of the continental US showing which job has grown the most in each state over the last 10 years. Hover over the states to see the fastest growing job in each state.
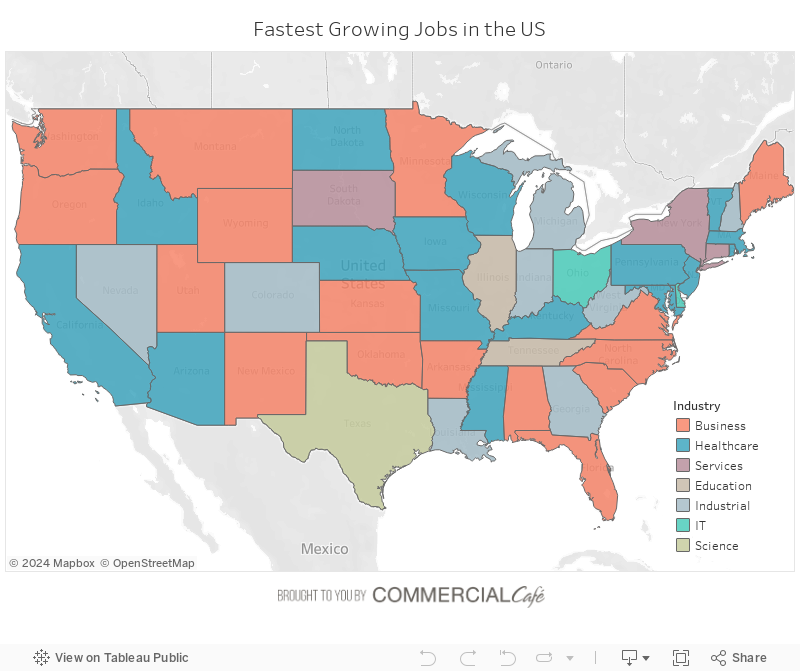
When broken out by industry type on the state level, we see that business and healthcare jobs have grown the most in 30 of the 48 continental states. In addition to Personal Care Aides and Market Specialists, Human Resource Specialists are also growing quickly in seven states including Washington, Minnesota, and Virginia.
The fastest growing jobs in IT by state only had two entrants, Ohio and Delaware. In Ohio, Operations Research Analyst jobs have grown from under 1,000 jobs to almost 4,000, a 294% increase in 10 years. These jobs use techniques in advanced mathematics, optimization and big data to help businesses function more efficiently. App Developers in Delaware have also seen a similar increase. In 2009, there were 1,300 jobs in software development for applications. In 2018, that number has grown 260% to almost 5,000.
Conservation Scientist jobs, included in the sciences industry, are the fastest growing jobs in Texas. The energy industry in Texas between Midland-Odessa and Houston is a probable draw for these jobs due to the inherent environmental impacts of this industry.
Business Related Jobs Most Prevalent Nationwide
The maps below are interactive. Select the industry or a group of industries on the right. The top map shows the breakdown of how the 12 industries make up the job markets of the 48 continental states. The bottom is the distribution of total jobs.
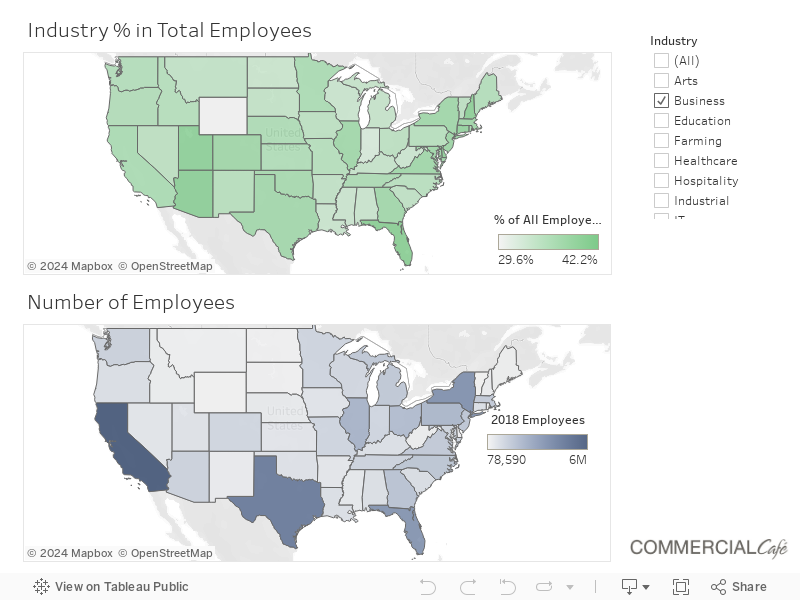
Business and Industrial jobs make up the largest percentages of the job market in most states. Business related occupations are in the majority though. The only state to have less than 30% of its workforce in business related jobs is Wyoming at 29.6%. Jobs in management, administrative, and financial operations make up the majority of these jobs.
The change in industry is also apparent when we change the target industry. For example, the trend in farming in the last decade is eye-opening. California accounts for most of the farming jobs in the country and it’s not even close. California has added over 45,000 farming jobs in this time period, a 25% increase, while most other states reduced the number of farming jobs. Still, farming only accounts for 1.3% of California’s total workforce.
While the dispersion of jobs across the continental US will vary, the concentration of the workforce by state is almost identical to what it was 10 years ago. California alone has over 16.8 million employed, almost 12% of all jobs in the continental US. In fact, about one-third of all jobs are in four states: California, New York, Texas, and Florida.
Are you looking to open or expand a business? CommercialCafe.com allows you to select among top local listings for office spaces across the U.S.:
Methodology
- Data from BLS Occupational Employment Statistics 2009 and 2018.
- Occupations that had less than 5,000 positions nationwide in 2018 were excluded.
- Occupations that had less than 500 positions by state in 2009 were excluded.
- Occupations with a BLS suffix of “All Other” were excluded.


Patrick McGregor
Patrick McGregor is a senior writer covering the real estate industry and overall economic trends in the United States for several Yardi product publications. He also holds an MBA from Thunderbird School of Global Management. Patrick was previously a commercial real estate analyst at Yardi Matrix for five years. His work has appeared in the New York Times, Bisnow, GlobeSt, The Real Deal, Business Insider, The Denver Post, The Motley Fool, and more.