Top 50 US Cities Ranked by Progress of Urban Sustainability


What makes a city green? The definition refers almost entirely to best practices that ensure sustainable development. According to the 2018 Citizen Centric Cities report released by Arcadis, sustainable urban centers are “places that are planned and managed with consideration for social, economic, environmental impact, providing a resilient habitat for existing populations, without compromising the ability of future generations to experience the same.” In this article, we identify the 50 cities in America that are making the largest strides toward improving the lives of their residents, as well as the ease of doing business, by embracing urban sustainability.
The data we used is compiled from sources we deem to be credible, and focuses on urban, environmental, and health improvement factors. For each city, we looked at the reduction in CO2 emissions, improvements in air quality, differences over time in the share of walking and biking commuters, the increase in number of Leadership in Energy and Environmental Design (LEED) certifications earned, the growth in environmentally focused occupations, as well as ratings given by the American Council for an Energy-Efficient Economy (ACEEE). Each metric is detailed in the methodology section.
Find out how your city fared in the ranking below.
Top 10
The data we analyzed showed that Washington, D.C. is the greenest lantern in the land, maintaining its high standards and urban development policies geared toward sustainability. Next, New York City’s high walkability, growth in LEED certifications, and well-rated sustainability oriented policies pushed it up to second place. Placing third overall, Denver achieved top 10 scores for its increase in green jobs and in LEED-certified building, as well as for the city’s growth in the adoption of green commuting. Boston’s highly rated policies to increase efficiency in city government and real estate development code requirements scored highest in our ranking for that metric, landing the city in fourth overall. Los Angeles is fifth, scoring high for its significant increase in LEED-certified buildings and sustainable city policies.
Chicago came in sixth, partly due to its goals to improve walkability and access to transportation, as well as increase efficient energy usage in lower-income areas. Seattle, at seventh, fared well with respect to increases in walking and biking commuters, as well as city policies—such as strategies to mitigate urban heat islands and plans for distributed energy systems. Baltimore stands in eighth, ranking high for its reduction of CO2 emissions and for green commuting. Atlanta is ninth, with good scores in CO2 reduction and median air quality improvements. Portland takes 10th place overall, scoring well for its growth in green jobs, increase in LEED certifications and sustainability-oriented city policies.
#11 through #20
Kansas City lands 11th, with great scores for improvement in median air quality. In 12th place, San Francisco ranks well for its increase in walking and biking commuters, as well as sustainability oriented city policies. Startup sweetheart Austin is 13th overall in “green progress.” The city scored well for its LEED-compliant buildings, as well as its high rating by the American Council for an Energy-Efficient Economy (ACEEE). Minneapolis—14th on our list—recently adopted new policies regarding transparency about energy in existing buildings; the ACEEE city scorecard also lauded the City of Lakes for its community-wide initiatives. Cincinnati’s overall score placed the city 15th and was noted for its increase in LEED-certified building construction and the number of residents adopting green commuting.
St. Louis’ best scores were for its increase in the number of walking and biking commuters, growth in environmentally focused occupations, and lowering of CO2 emissions. Philadelphia follows in 17th place, scoring fairly well in terms of sustainability minded city policies and its increase in LEED-certified building. Cleveland placed 18th, scoring well for its reduction of CO2 emissions, as well as its overall improvement of air quality. Phoenix’s strongest suits were median air quality improvement and city efforts geared toward sustainability. ACEEE ranked Long Beach among the leading cities for local government operations due to its ongoing efforts to convert vehicles and energy consumption to efficient alternatives the data we analyzed showed that the city has done well in reducing its energy-related CO2 emissions.
#21 through #30
Pittsburgh came in 21st, ranking well for its noteworthy community-facing clean energy initiatives, which were scored highly by ACEEE. San Jose came up next, ranking fairly well for growth in environmentally focused occupations and LEED-certified building. San Diego ranked 23rd overall, with good scores for city policies, walking and biking commuters, and its increase in LEED certifications. San Antonio ranked 10th for its improvement of median air quality—the best recorded performance of all Texas cities on our list for this metric. Nashville boasts the highest growth in walking and biking commuters; it was also in the top 15 for its improvement of median air quality.
Columbus is one of six cities to earn full credit for water efficiency from ACEEE; our research also noted progress in terms of air quality improvement and LEED-compliant construction. Oakland came up just ahead of Long Beach for its progress in LEED-certified building practices, and is the fourth-best-rated California city in terms of sustainability oriented administrative policies. Indianapolis recorded the third-best score for its improvements to its median air quality; it also ranked 17th nationwide for its reduction of energy-related CO2 emissions. Sacramento’s strong suits were city policies geared toward sustainable practices, as well as the city’s growth in green jobs. Riverside scored among the top 10 cities for growth in green jobs.
#31 through #40
Houston’s strongest score was due to its increase in the number of LEED-certified buildings, followed by its progress made toward cleaner air. Virginia Beach scored among the top cities for its air quality improvements and for lowering its CO2 emissions. Dallas’ highest scores were for green-commuting residents and LEED buildings. Notably, Louisville recorded the second-highest score on the median air quality index. Miami ranked among the top five cities for growth in commuting by foot or bicycle; its second-best scoring metric was its increase in LEED-certified building.
Charlotte’s highest score was for its increase in the number of LEED-certified buildings; in fact, according to the ACEEE scorecard, the city’s retrofit strategies improved 30% of buildings, with a projected reduction of 1,100 metric tons of CO2. St. Petersburgh’s best score ranked 11th for reduction of energy-related CO2 emissions. Detroit, however, placed first for that index; this city has made the biggest progress in reducing its energy-related CO2 emissions. Fort Worth’s strongest suits were its increases in LEED-compliant inventory, green jobs and the share of residents who commute by walking and/or bicycle. Las Vegas followed Detroit on the CO2 index, receiving the second-highest score for its reduction of CO2 emissions.
#41 through #50
Aurora’s best-scoring metrics were median air quality improvements and CO2 emission reduction. In Raleigh, city policies aim to use renewable energy to meet 20% of peak load by 2030; the city also ranked 15th nationwide for growth in environmentally focused occupations. Bakersfield received the fifth-highest score for cleaning up the air; additionally, according to the ACEEE scorecard, its sustainability minded local policies include offering streamlined solar permitting. St. Paul city policies intend for the buildings sector to reach carbon neutrality by 2050; furthermore, within 10 years, leaders also plan to reduce energy burdens so that no local household spends more than 4% of their income on energy costs. Memphis boasts the fifth-highest score on the CO2 index.
Milwaukee sustainability oriented local policies include developing municipal solar systems and allowing solar-by-right accessory use in all land use zones. Jacksonville ranked among the top 25 for reducing CO2 emissions and improving median air quality. Honolulu’s best scores were for reducing CO2 emissions and growth in environmentally focused occupations. Mesa scored seventh for lowering CO2 emissions; its second- and third-best scores were on the LEED-certified building index and green commuter index, respectively. Chula Vista is one of six cities singled out by ACEEE for the energy-efficiency programs of the utilities that serve its residents; the data we analyzed showed the city had also reported improvements in the share of residents adopting green commuting.
Best-Scoring Cities per Metric
Detroit scored best for the reduction of energy-related CO2 emissions. Kansas City received the highest score for improvement of median air quality. Tulsa showed the most growth in environmentally focused occupations. Washington, D.C. took first place for its progress in increasing local LEED-certified building inventory. Nashville saw the highest increase in the number of residents commuting by foot and/or by bicycle. Boston scored highest on the sustainable city policies index.
Below, dig into more detail about the top five cities for each index.
Lowering Energy-Related CO2 Emissions
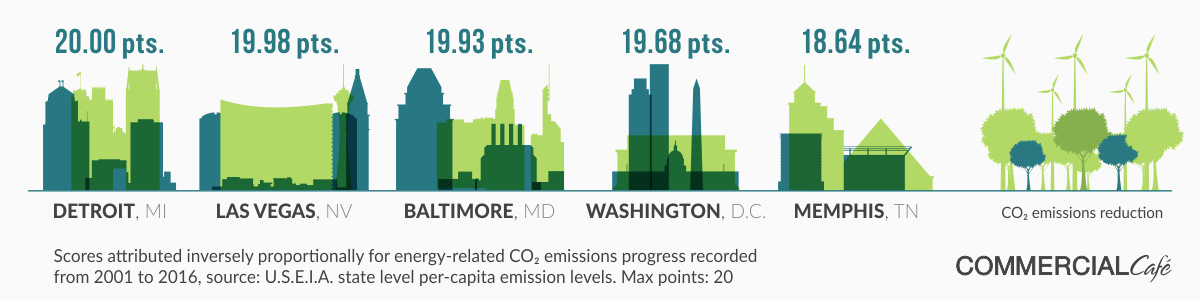
- Granted, the progress made by Detroit in terms of reducing energy related CO2 emissions is partially due to the city’s decrease in population between 2001 and 2016. However, that is not to say that city officials and the Detroit community have not taken deliberate steps toward reducing the carbon footprint and their contribution to climate change. For example, this July, the Detroit City Council unanimously passed an ordinance to cut greenhouse gas emissions by 30% in the next five years. The ordinance sets a benchmark for city buildings to cut emissions completely by 2050 and requires that emission measurements be taken yearly.
- According to the U.S. Energy Information Administration (EIA), Nevada ranked second in the country in 2017 for electricity generation from geothermal energy. Additionally, Las Vegas ranked 35th in our 2018 study on the most sustainably powered U.S. cities. According to previous research1, the city led all other Metropolitan Statistical Areas (MSAs) in percent reduction of per-capita emissions.
- Baltimore benefits from the state of Maryland’s participation in the Regional Greenhouse Gas Initiative. The program aims to cap CO2 pollution throughout the Northeast.
- Washington, D.C. proposed policies that would cut carbon emissions and use 100% renewable sources of energy for the city’s power grid within 15 years.
- Studies for the Memphis Climate Action Plan found that energy-related emissions accounted for 46% of the city’s total emissions. Objectives set to reduce the city’s contribution to climate change include implementing new green building regulations by 2022 and achieving full compliance by 2025, as well as decarbonizing the energy supply grid by 2050.
Improvement of Median Air Quality
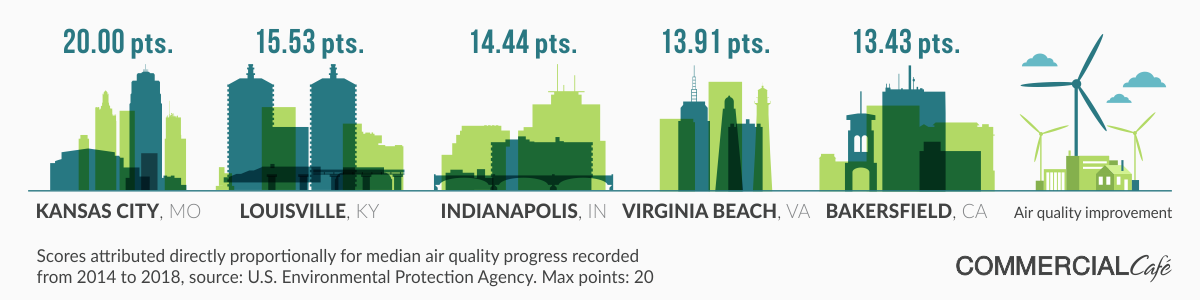
- Measurements from the U.S. Environmental Protection Agency (EPA) in 2018 showed that the median air quality in Kansas City had improved 25%. The State of the Air report released by the American Lung Association (ALA) last year also included the Kansas City MSA among the cleanest for ozone air pollution.
- Data on Louisville air quality showed a 17% improvement in 2018 compared to 2014. The Lung Association’s analysis found that the city’s year-round particle pollution levels “were at their lowest ever”—moving it from 21st most polluted to 30th in the State of the Air report rankings.
- EPA data revealed that the median air quality in Indianapolis improved 15% between 2014 and 2018. Additionally, ALA research confirmed that the city continues to progress in this respect, currently reporting the lowest levels ever of both short-term and year-long particle pollution.
- Virginia Beach recorded a 14% improvement in median air quality in the five-year term studied. It also ranks among the cleanest cities nationwide for short-term particle pollution.
- Though Bakersfield has more cleanup work ahead, it’s worth noting that—according to the EPA—the city’s median air quality improved 14% between 2014 and 2018.
Growth in Environmentally Focused Occupations
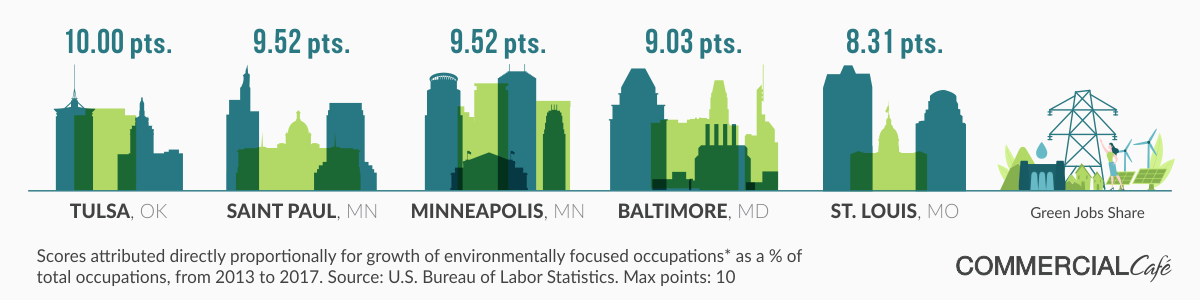
- Oklahoma State University in Tulsa runs an innovative environmental science master’s program, which translates into readily available jobs in a variety of industries. The Professional Science Master’s Program in Environmental Management is the first and only program of its kind in the state; it prepares graduates to help industries improve sustainability, reduce waste, save costs and comply with environmentally focused regulations.
- The number of clean energy jobs in Minnesota reportedly exceeded 61,000 earlier this year, which accounts for 2% of all jobs in the state. Working together to position the region in the lead of the growing green economy, St. Paul and Minneapolis launched the Thinc.GreenMSP initiative—a partnership dedicated to driving demand for green products and services, and generating momentum and support for continued innovation in green manufacturing.
- Baltimore’s Sustainability Plan, created in 2007, already presents a number of accomplished goals, including the training of more than 820 residents for green construction careers; to date, the program has an 85% graduation rate and 87% job placement rate in occupations with average wages greater than $13/hour.
- St. Louis has a long history of successfully tackling environmental challenges. Presently, the city is looking at building a new waste-to-energy plant, which will divert more than 2,000 tons of waste from local landfills. The plant is estimated to employ 80 people, and is intended to be the first of several to be built every few years—if this pilot project is successful.
Increase in Number of LEED Certifications Awarded
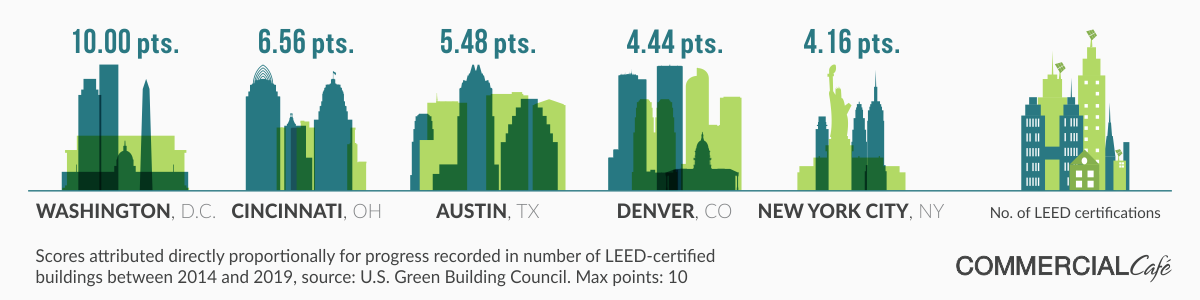
- Washington, D.C. continues to lead by example in matters of sustainable and green-minded urban growth. Since 2014, more than 1,000 LEED certifications have been awarded to existing buildings and pre-certified projects. This marked a five-year increase of 67% in LEED-compliant construction. The capital is now home to more than 2,500 such projects.
- Cincinnati earned the second-highest rank with a 107% increase in its number of LEED certifications. That corresponds to 663 existing and planned buildings that have been certified compliant since 2014; the grand total now stands at 1,280. Incentives directed at new buildings and LEED-compliant improvements to existing buildings have helped place Cincinnati fourth nationally for the total number of LEED certifications in 2019, as shown in the chart below.
- Austin’s progress in optimizing sustainability efforts placed the city in third for growth in the number of LEED certifications; 554 were awarded since 2014, marking a 117% increase in five years and bringing the total number of Austin LEED certifications to 1,026 as of August 2019. This, in turn, places the Texas capital ninth in the country for most LEED-certified projects.
- The fourth-highest score for increase in LEED certification goes to Denver, which was also recognized by the LEED for Cities program with a Platinum certification. Since 2014, 449 new certifications have been awarded, nearly doubling the city’s LEED inventory in five years. As of August 2019, the total stands at 940 buildings, which ranks Denver 11th on the list of U.S. cities with the most LEED certifications
- New York City wraps up the top five, with an increase of 421 new certificates earned since 2014. This brings the city’s number of LEED-certified buildings and projects to 1,269, and places NYC sixth among U.S. cities that are home to the most LEED-recognized buildings.
Adoption of Green Commuting
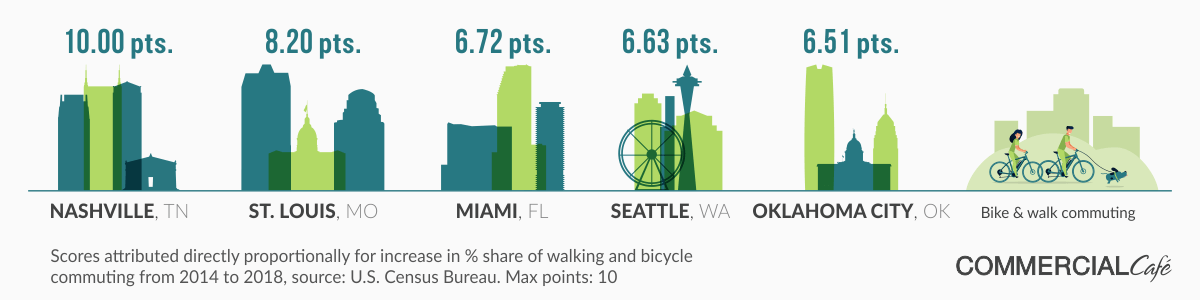
- Nashville nabbed the top score for growth in green commuting. Walkscore.com rated the city a walker’s paradise, with a walkability score of 96 out of 100, and very bikeable, with a score of 72 out of 100. The Music City Bikeway is a 26-mile bike route that includes park roads, greenways, bike paths, and shared lanes to connect downtown Nashville to eastern and western Davidson County.
- St. Louis received the second-highest score for its growth in share of walking and biking commuters. Though the preferred mode of transport remains a single-occupant vehicle, the share of biking commuters has continuously increased since 2000. This may be due, in part, to the steady, multi-phase rollout of the Bike St. Louis Plan, which continues to expand and improve bike routes and lanes throughout the city.
- According to a recent report released by the Miami Urban Future Initiative, the city remains heavily dependent on cars. Miami’s future as a potential global startup hub, however, hinges on it becoming a dense, urban center well-served by transit options—in which it is convenient to live without a car. Recent research conducted by The Micromobility Coalition found that—in addition to moving people out of personal automobiles—increasing quality and accessibility to public transportation, improving walkability, and supporting modern e-scooter and e-bike programs can unlock economic opportunities by a significant margin. Essentially, this makes roughly 40% more jobs reachable without lengthening commutes or adding cars to the road.
- According to the latest Census data, Seattle has seen the biggest drop in drive-alone commuters since the start of the decade. Specifically, 2010 data showed that 53% of Seattle commuters drove to work alone; in 2018, that share had dropped to 44%. With vital bike connections in progress and new housing slated to open near public transit and employment centers, the Emerald City is sure to see an even bigger boost in walking and biking commuting.
- Oklahoma City invested more than $700 million in increasing citizen mobility beyond the automobile by adapting a city built for cars to the needs of its people: building sidewalks, walking trails, bike lanes and paved alternatives for anyone who chooses not to drive a car to where they’re going. The Bike-Walk OKC initiative seeks to build a transportation network that promotes safer, healthier and more enjoyable mobility choices. To date, Oklahoma City has more than 300 miles of trails and bike routes.
ACEEE City Scorecard Rating
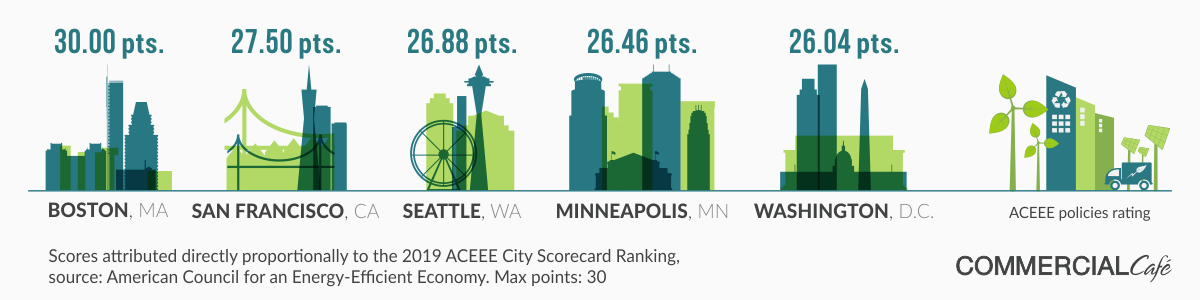
- Every two years, the American Council for an Energy-Efficient Economy rates and ranks the country’s largest urban centers for their energy-efficiency policies, as well as their programs promoting economic growth and environmental benefits. Boston earned the highest rating for its Imagine Boston 2030 plan, sustained efforts to increase efficiency of the municipal fleet, and LEED benchmarks for new construction and retrofitting of existing buildings.
- Highly rated San Francisco policies include requiring all departments to complete annual greenhouse gas reports, and providing all city buildings with electricity that is 100% free of fossil fuels. Policies regarding new buildings include requirements that all new construction include solar-ready infrastructure.
- Seattle code requires commercial and multifamily buildings to incorporate renewable energy systems or be solar-ready. Moreover, commercial and multifamily buildings larger than 20,000 square feet must benchmark energy usage, and the data must be publicly available. This benchmarking policy covers 83% of commercial and multifamily buildings, and has achieved a compliance rate of 100%.
- Minneapolis offers incentives to commercial and residential properties for pursuing energy efficiency, solar energy installation and low-income energy projects. Commercial buildings that are at least 50,000 square feet are required to benchmark energy consumption and report the data to the city.
- Washington, D.C. requires commercial buildings and multifamily buildings larger than 50,000 square feet to benchmark and publicly disclose energy usage data annually using ENERGY STAR® software. The city provides incentives for energy efficiency, solar and low-income energy projects.
Methodology
As a follow-up to our previous study of the most sustainably powered cities in the U.S., we wanted to look into which cities have made the most progress in sustainability and improving the lives of their residents by “going green.” The starting point of our research was this year’s green policy report released by ACEEE. Of the cities included in that report, we assigned composite scores based on several metrics to the 60 urban centers with populations of 300,000 or more. Population totals considered for city selection are according to U.S. Census estimates for 2017, but this criterion was not factored into the scoring system.
The 50 U.S. cities that ranked above the rest are: Atlanta, GA; Aurora, CO; Austin, TX; Bakersfield, CA; Baltimore, MD; Boston, MA; Charlotte, NC; Chicago, IL; Chula Vista, CA; Cincinnati, OH; Cleveland, OH; Columbus, OH; Dallas, TX; Denver, CO; Detroit, MI; Fort Worth, TX; Honolulu, HI; Houston, TX; Indianapolis, IN; Jacksonville, FL; Kansas City, MO; Las Vegas, NV; Long Beach, CA; Los Angeles, CA; Louisville, KY; Memphis, TN; Mesa, AZ; Miami, FL; Milwaukee, WI; Minneapolis, MN; Nashville, TN; New York City, NY; Oakland, CA; Philadelphia, PA; Phoenix, AZ; Pittsburgh, PA; Portland, OR; Raleigh, NC; Riverside, CA; Sacramento, CA; Saint Paul, MN; San Antonio, TX; San Diego, CA; San Francisco, CA; San Jose, CA; Seattle, WA; St. Louis, MO; St. Petersburg, FL; Virginia Beach, VA; Washington, D.C.
For each metric, the number of maximum points was evenly distributed between the lowest and highest metric values. On this scale, a score was calculated for each city based on its metric values. The factors (metrics) on which we based the composite scores are explained below. For energy-related CO2 emissions reduction, the number of points awarded is inversely proportional to the metric values. For all other indicators, the number of points awarded is directly proportional to the metric values.
We turned to the U.S. Energy Information Administration data to rank cities by reduction in CO2 emissions. The data we analyzed included per-capita, energy-related, carbon dioxide emissions at the state level. The metric was adjusted to city level by multiplying emissions per capita by the city population. We then compared values recorded in 2001 and values recorded in 2016. The maximum weight for this metric was 20 points, and the biggest score was awarded for the largest reduction in energy-related CO2 emissions.
The rankings for improvements in median air quality were made based on U.S. Environmental Protection Agency data. We opted for 2018 values because this year’s EPA air quality data did not encompass all of the cities covered in this article. Median air quality scored is at the metro level. The maximum weight for this metric was 20 points.
To gauge the growth in environmentally focused occupations, we turned to the U.S. Bureau of Labor Statistics. The data reflects growth in eight occupations, as selected by the BLS Office of Occupational Statistics and Employment Projections: environmental scientists and specialists, including health; environmental engineers; environmental science and protection technicians, including health; environmental engineering technicians; conservation scientists; solar photovoltaic installers; hazardous materials removal workers; and wind turbine service technicians. We looked at the share of the aforementioned occupations out of the total occupations and scored the percentage increase for each city from 2013 to 2017. Data scored for this metric is at the metro level. The maximum weight for this metric was 10 points.
For LEED-certified building progress, we looked to the U.S. Green Buildings Council’s August 2019 data. We compared the LEED-certified buildings inventory in 2014 to that of 2019 to-date. Values scored represent the difference in number of buildings for each city. The maximum weight for this metric was 10.
The green commuter score represents the percent difference between the share of walking and biking commuters out of the total commuting population for each city in 2018 as compared to 2014. Data was extracted from U.S. Census Bureau records. The maximum weight for this metric was 10 points.
We attributed the highest value—30 points—to the ACEEE policies rating score because it was the most complex metric. The 2019 city scorecard ranking by the American Council for an Energy-Efficient Economy combines Green Policies adopted by each city in five categories: local government, community-wide initiatives, buildings, energy and water utilities, and transportation.
Additional references:
(1) Brown, M. A. and Cox, M. 2015 – Progress in Energy and Carbon Management in Large U.S. Metropolitan Areas. Energy Procedia, 75 2957–62.


Ioana Ginsac
Senior Content Writer, Industry News & Reports
Ioana is a content writer who has been covering all-things-CRE (and more) for several Yardi network publications since 2017. You will find her byline regularly in industry news and market reports, but also on articles covering sustainable development, green urbanism, and innovation, all of which she has been passionately learning about for more than a decade. Her work has been referenced by publications including AmericanInno, Bisnow, BusinessInsider, Commercial Property Executive, Curbed, Fast Company, Forbes, GlobeSt.