U.S. Energy Consumption 2020 Update: 22 States Witness 2-Digit Drops in Industrial Power Usage


The pandemic has been the ultimate black swan event of the past decade. Not only did it require changes in the way individuals and groups interact, but also in how businesses are run, as well as how and what we spend our money on. It’s also made us more aware of what resources power our daily lives, as well as the disproportionate effect that a lack of or limited access to these resources can have.
The following study uses Energy Information Administration (EIA) state-level and sector-specific data on energy sales and is split into two main timeframes. The first compares changes in yearly U.S. energy sales between 2019 and 2020, while the second examines emerging power generation and consumption trends between 2010 and 2020.
Key takeaways:
2020 vs. 2019
- Power consumption dipped 4% nationally; industrial usage narrowly missed 2009 record low
- 22 U.S. states witnessed double-digit drops in industrial energy consumption in 2020
- California’s total energy usage decreased Y-o-Y, despite a 9% jump in household consumption
2020 vs. 2010
- North Dakota’s total power usage shot up 65% since 2010, while Kentucky’s fell 25%
- Nevada household energy usage jumped 23% — the highest 10-year increase in the residential sector
- Gas and renewables doubled their share of the U.S. energy market during the last decade
The following analysis updates and expands upon a previous CommercialCafe study that focused on electricity demand in the U.S. during the first lockdowns

2020 Industrial Energy Usage Dips 8%, Nearing Great Recession Levels
Total energy consumption across the U.S. dropped 4% in 2020 compared to the previous year. And, while residential energy usage increased by roughly 2%, commercial and industrial consumption declined by 6% and 8%, respectively.
In fact, industrial power usage in 2020 was only a hair away from repeating the sector’s 20-year low. Specifically, in 2020, the industrial sector used roughly 920 million megawatt-hours (MWH), compared to 917 million MWH in 2009 at the deep end of the recession.
Notably, we observe a similar pattern regarding commercial energy usage. Our previous report highlighted an 11% decrease in commercial power consumption in the second quarter. And, although the decline became less pronounced in the second half of 2020, the sector still experienced drops of 5-6% in its overall energy usage in Q3 and Q4. At the same time — and in contrast to the decade-long downward trend of industrial consumption — the commercial sector’s energy needs have been expanding almost continuously since 2000.
In terms of household consumption, 2020 marked a 10-year record for megawatt-hours in Q2 and Q3. More precisely, as many people sheltered in place and some began working from home, residential energy usage between April and June hit 334 million MWH. For comparison, the 2010-2019 average for the same period was 312 million MWH. Additionally, U.S. households used 453 million MWH in the third quarter — marking a 4% increase compared to the same period the previous year and surpassing the decade’s 422 million MWH average for Q3.
22 U.S. States See 2-Digit Drops in Industrial Energy Consumption
If we break up energy data from all 50 states and Washington, D.C. into large, medium and small consumers (for more details, read our methodology), it becomes apparent that all of the top energy-consuming states recorded a decrease in their total usage throughout 2020. Conversely, a few of the medium and small consumer states maintained their level or even slightly increased their usage.
In this scenario, some of the variation in electricity consumption might be linked to people being able to move to smaller cities or moving back to their home states as remote work freed them from their daily commutes. Moreover, states adopted different approaches to deal with the pandemic and manage the cooling economy, including ordering curfews, issuing stay-at-home orders, or banning public events and gatherings — measures that ultimately contributed to significant fluctuation in power consumption.
Use the slideshow’s left and right arrows to see details about each state’s total energy consumption year-over-year, as well as commercial, residential and industrial usage.
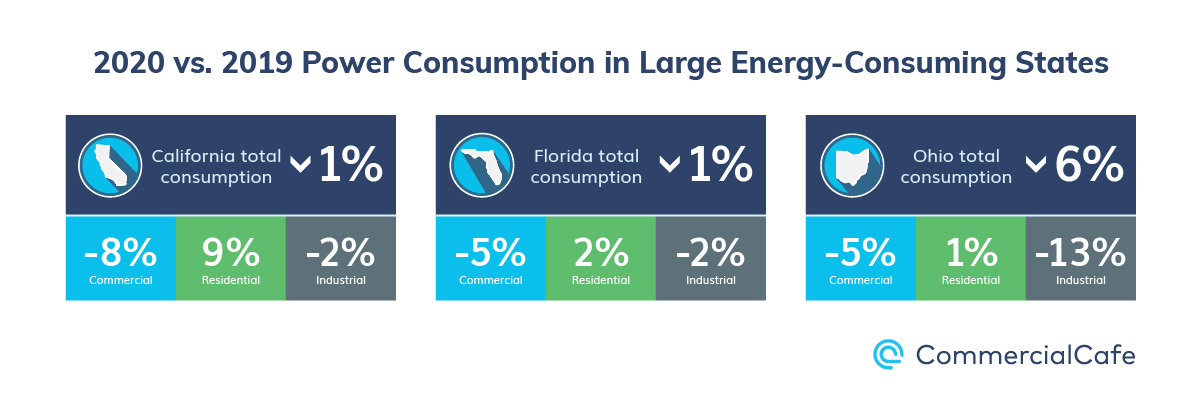
For instance, Ohio’s power consumption fell by 6% last year, marking the most significant drop among large energy consumers. It’s worth noting that the state was among the first to institute stay-at-home orders and close all non-essential businesses, and a number of restrictions remained in place for most of the first half of 2020 — which contributed to a sharp, 13% decline in industrial power usage.
On the coasts, California and Florida closed 2020 with 1% dips in their total power consumption. Specifically, residential electricity usage in California rose by 9% — more than any other state in this category — which translated to 7.4 million more MWH sold year-over-year. Meanwhile, Florida’s commercial sector recorded a 5% decrease, with its residential consumption growing by a more modest 2%.
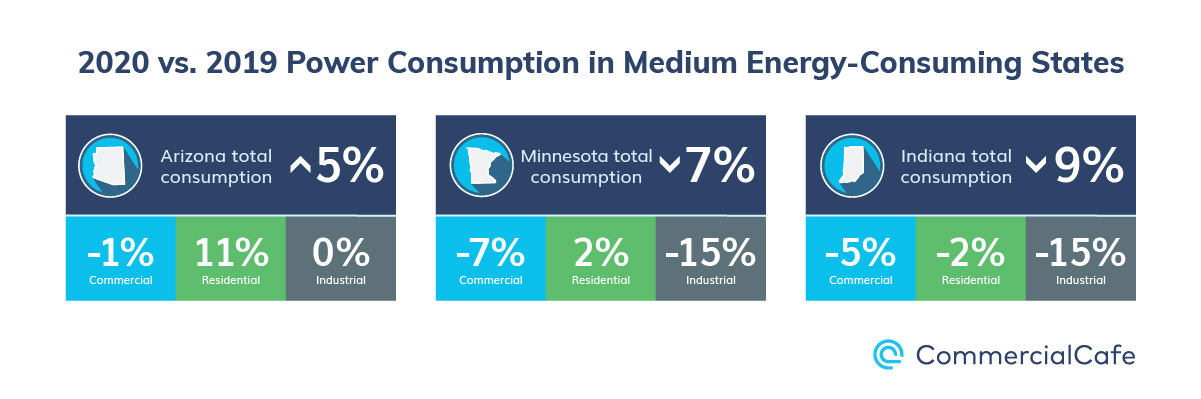
Among medium consumers, Arizona was the only state to experience an increase in its overall power consumption. Here, total usage grew by 5% overall, with a record 11-point hike in residential consumption and a mere 1% drop in commercial electricity usage.
In the Midwest, Indiana’s 9% and Minnesota’s 7% drop in total power consumption in 2020 were the most significant declines in the medium consumer category. Following a familiar pattern, the most affected medium consumers were states where decreases in industrial energy usage in 2020 hit two-digit numbers. For example, both Indiana and Minnesota’s industrial power consumption fell by 15%. In raw numbers, this means 6.7 million fewer MWH were used by Indiana factories and manufacturing plants compared to 2019, and 3.2 million fewer in Minnesota. For comparison, the combined decrease in these two states’ industrial energy usage would exceed the total power consumption in D.C. (9.7 million MWH) throughout 2020.
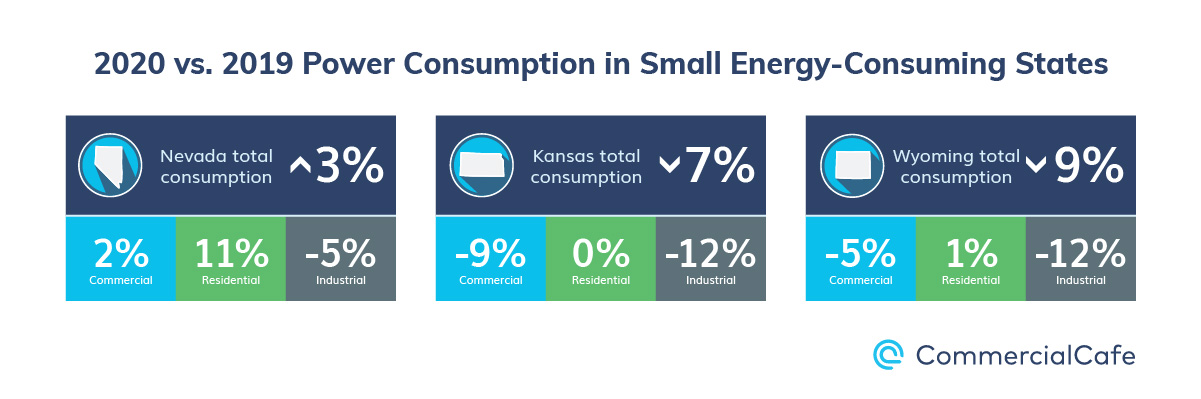
As for small consumers, Nevada increased its total electricity usage in 2020 by 3% after some significant shakeups in its residential and industrial consumption. Household energy needs here rose by 11%, while industrial power sales fell by 5%.
Further north, Wyoming experienced a nine-point drop in its yearly usage. The state was especially hard-hit in the second quarter, when its power consumption took a 14% dive, mostly due to declining industrial energy sales. However, the full-year picture is not that different, with a 12% decrease in industrial usage and 5% dip in commercial usage.
Meanwhile, in states like Hawaii or Kansas, annual energy consumption was much more affected by the slowdown of commercial — rather than industrial — activity.

North Dakota’s Power Usage Shot Up 65% Between 2010 & 2020 – Kentucky’s Fell 25%
Clearly, 2020 was a disruptive year for many families, communities and businesses around the world. So, to better understand the effect of the pandemic on all of our lives, it’s useful to take a few steps back and analyze last year’s contribution to decade-long trends and evolutions in the U.S. For the purposes of this study, we looked at energy consumption patterns between 2010 and 2020 for all 50 states and Washington, D.C.
One state that immediately stands out is North Dakota, which boasts the largest 10-year percentage increase for total consumption. Its overall energy usage rose by 65%, with a 159% jump in its industrial energy needs between 2010 and 2020. In particular, the state’s oil boom — which began in 2006 and peaked in 2012 — led to the creation of thousands of jobs and resulted in North Dakota having the lowest unemployment rate nationwide during that period. In fact, in the last 10 years, the state’s economy grew by an impressive 58.3%, and its population rose by 13% — from 672,591 to an estimated 762,062. However, the actual quantity of MWH used by North Dakota was — and continues to be — comparatively modest compared to neighboring Minnesota, which used three times as much power in 2020.
Among large energy-consuming states, Texas was by far the #1 in terms of growth. Here, the state’s 14% energy consumption hike has been sustained by its even growth across its residential, commercial and industrial sectors. In 2020 specifically, the industrial sector was the most affected — registering a 10% drop — while its residential and commercial consumption levels saw only minor declines year-over-year.
At the opposite end, Kentucky’s power usage dropped by 25% since 2010. Notably, most of that decrease originates in the state’s nearly halving of its industrial energy consumption. In fact, Kentucky’s industrial sector went from 45 million MWH 10 years ago to just 26 million last year. And, while the pandemic has played a role in this — contributing to an 11% fall in 2020 — industrial energy usage in the state has settled on a much lower plateau since 2014.
A former coal-mining center, Kentucky’s energy industry has suffered major setbacks both in terms of market competitiveness — as fracking reduced the price of natural gas across the U.S. — and long-term sustainability due to changing pollution standards. Nevertheless, there’s still a place in the sun for Kentucky. Recently, the state has been investing heavily in solar power with companies such as Berkeley Energy Group pouring an estimated $100 million into a massive solar project, and even the Kentucky Coal Museum — the very symbol of the state’s coal heritage — installing 80 solar panels on its roof.
Nevada Household Energy Usage Jumps 23% – Highest 10-Year Increase in Residential Sector
Since 2010, there have been important shifts within each state in terms of consumption patterns across their residential, commercial and industrial sectors. For instance, Nevada’s 23% increase in residential energy usage was the highest in the nation in the last 10 years. In 2010, the state’s annual consumption totaled 11.6 million MWH before gradually rising to 14 million MWH in 2020.
Use the slideshow’s left and right arrows for details about each state’s commercial, residential and industrial usage between 2010 and 2020.
However, West Virginia was the state that shed the most in terms of household power consumption between 2010 and 2020. It experienced a 13% drop — going from 12.4 million MWH at the start of the decade to 10.8 million in 2020.
Among medium energy-consuming states, the 10% domestic power usage decline witnessed by both Kentucky and Alabama throughout the decade was the most pronounced. Furthermore, unlike most states that increased their residential energy consumption in 2020, Kentucky and Alabama’s household usage actually declined by 1-2%.
At the same time, commercial power usage grew by 16% in Tennessee throughout the last decade, hitting a peak in 2018 when it totaled 37 million MWH. In second place, Texas commercial usage increased by 13% between 2010 and 2020, followed by Virginia with an 11% uptick.
As far as industrial consumption, small energy-consuming states — such as North Dakota and New Mexico — recorded some of the highest increases in the last 10 years with 159% and 38% hikes, respectively. Only four medium energy-consuming states — Oklahoma, Arizona, Louisiana and Colorado — saw their industrial energy usage grow in the same period, with Oklahoma topping the list at 32%. Finally, among large electricity consumers, Texas, New York and Philadelphia were the only states where industrial usage went up.
Gas & Renewables Double Their Share of U.S. Energy Market Over the Last Decade
Although 2020 was an atypical year in many ways, energy generation by source actually continued a decade-long trend marked by a sustained decrease in the use of coal energy, as well as a near doubling of gas and renewable energy usage.
In 2010, roughly 45% of all energy generated in the U.S. relied on coal. At that time, gas and nuclear added another 44% to the nation’s total power production, (20% and 24%, respectively). But, due to a lack of investment in the expansion of nuclear facilities, natural gas soon filled the space left by the decline of coal. By 2020, natural gas was generating 40% of U.S. energy needs — almost the same share as coal had at the start of the decade.
Meanwhile, nuclear energy’s 10-year constancy might come across as stagnation, especially because only two new units are currently under construction in Vogtle, Fla., and a vast majority of existing reactors were built between 1967 and 1990. But, the picture of nuclear energy in the U.S. is more complex. For instance, heightened safety standards in the 1980s and 1990s led to many new nuclear projects being delayed and, in the meantime, gas generation gained ground as a more affordable alternative. However, diligent investing in maintenance and upgrades over the years has resulted in a major increase in the average capacity factor and efficiency of nuclear plants, hitting a 94% record in 2019. For comparison, the average capacity factor for natural gas is 57%, hydroelectric is 39%, wind is 35% and solar is 25%. And, while last year was the first in which renewables overtook nuclear facilities in terms of total megawatt-hours generated, nuclear units still contribute 50% of non-carbon electricity in the country. In fact, nuclear was the #1 contributor throughout the last decade.
During the same timeframe, energy from renewable sources doubled its share of the overall market. But, gains made by the various categories of alternative power generation have been unequal. For example, between 2010 and 2020, there was a 147% increase in wind-, geothermal- and biomass-generated megawatt-hours. And, with a total of 410 million MWH generated last year, these sources were the top contributors of renewable energy in the U.S.
Next up, hydroelectric power currently holds the second-largest share of the renewable energy market with roughly 37%. And, although its 291 million MWH contribution in 2020 was higher than the previous year, hydroelectric energy has had a sinuous ride. For instance, following its decade-long record in 2011 — when production peaked at 319 million MWH and accounted for 62% of the total renewable energy generated that year — it began a three-year decline that culminated with a modest 249 million MWH output in 2015.
Last, but not least, solar power delivered roughly 1.2 million MWH to the U.S. energy market 10 years ago. Since then, the amount of solar energy produced doubled every two years before reaching 91 million MWH in 2020.
Methodology
This analysis uses both national and state-level Energy Information Administration (EIA) data on total and sector-wide energy sales.
Total energy sales — as well as commercial, residential and industrial energy sales — were compared separately. All are measured in megawatt-hours.
For total or sector-wide energy sales at the national level, we used 2000 to 2020 data provided by the EIA.
For total or sector-wide energy sales at the state level, we used 2010 to 2020 data provided by the EIA.
The study also used data provided by the EIA on yearly energy generation by source between 2010 and 2020.
“Large consumers” are defined as states with more than 100 million MWH in total annual energy usage.
“Medium consumers” are defined as states with a total annual energy usage between 50 million and 100 million MWH.
“Small consumers” are defined as states with less than 50 million MWH in total annual energy usage.
“Average capacity factor” is the ratio between the average power generated by an energy source and its maximum possible output during a given period. This measurement reveals how fully a unit’s capacity is used.
Looking for commercial space for lease to open, move, or expand your business? Select any of the locations linked below to check out local listings, including office and coworking, retail, and industrial space:


Diana Sabau
Senior Content Writer, CRE News & Market Analysis
Drawing on years of intense research in the U.S. commercial real estate market at Yardi Matrix, Diana now applies her expertise as a writer for the CommercialCafe blog. Her articles focus on CRE investment, labor market trends, and technology, and have been picked up by prestigious publications including the New York Times, GlobeSt, The Real Deal, NAIOP, MSN, and Bisnow.