Lights Out! U.S. States Where Energy Consumption Rose or Fell During Lockdown


COVID-19 has put a damper on the hubbub of our interconnected societies, forcing us into an economic cooldown. As a result, the effects have spilled over into the job market, our daily routines and our pockets, as well as our power consumption patterns.
Using Energy Information Administration (EIA) state-level and sector-specific data on energy sales, this study reviews the effects of lockdown measures on energy consumption during the second quarter of 2020 as states were trying to manage the first wave of COVID-19 outbreaks. Our analysis then concludes with a breakdown of the main sources of energy generation in the U.S., their share within the national energy market, and any changes in their evolution during the pandemic.
Key takeaways:
- Power consumption dipped 4% nationally, while the commercial sector registered an 11% Y-o-Y drop
- U.S. household energy sales increased 8% in Q2, including a record 21% hike in Arizona and Michigan
- Renewable power generation exceeded coal by 7% in Q2
CommercialCafe will also conduct a follow-up analysis on the evolution of electricity demand in the U.S. market, charting any changes between the first attempts to reopen the economy and the final months of 2020.
U.S. Energy Sales Drop by 4% During First 3 Months of Lockdown
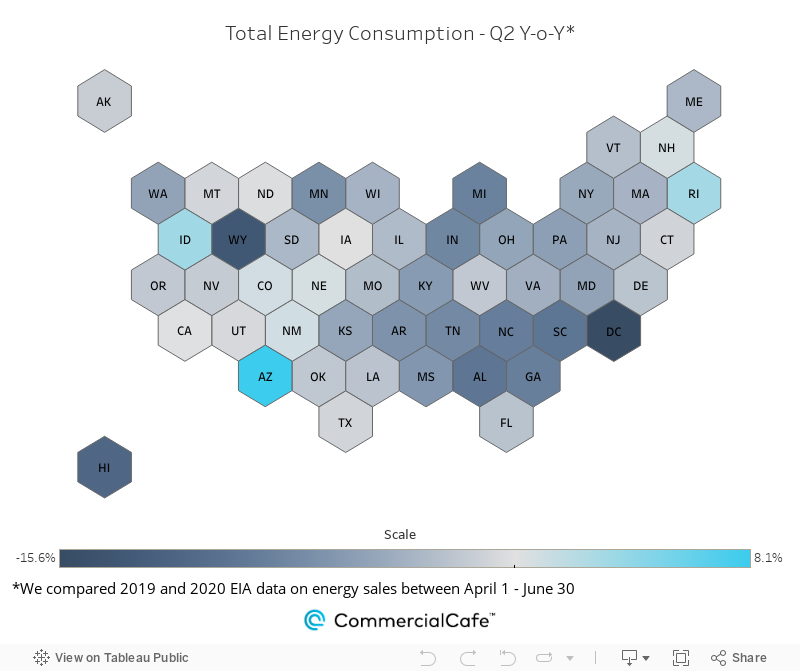
As states went into lockdown in the second quarter of 2020, energy consumption dropped across the board. Overall, the U.S. market used nearly 4% less energy between April and June than it did in the same time period last year. Essentially, power requirements dropped to Sunday levels under the lockdown, which was marked by significant reductions in the services and industrial sectors. Residential usage registered a single-digit increase.
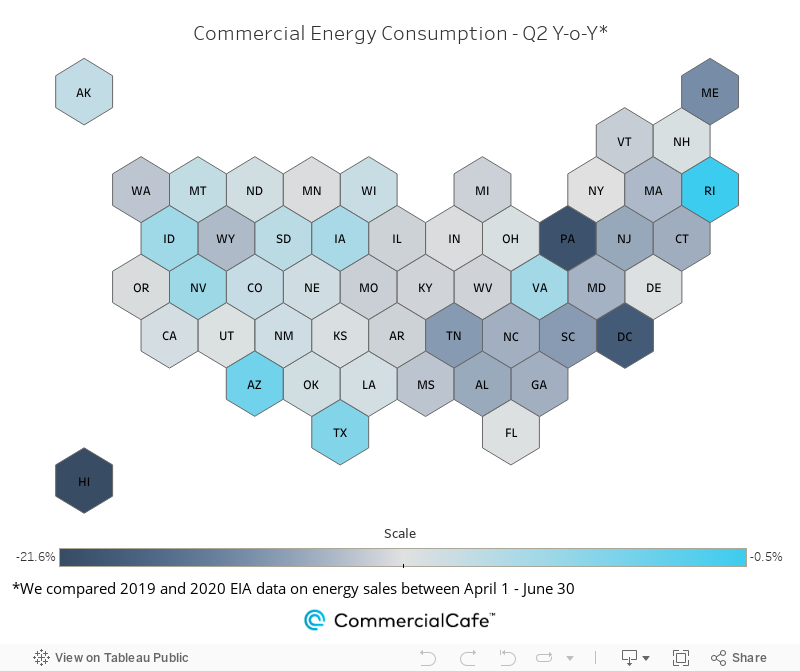
Unsurprisingly, the commercial sector experienced the most significant decrease — an 11% drop year-over-year (Y-o-Y) — with 35.6 million fewer megawatt-hours (MWH) consumed. Similarly, with many factories and manufacturing plants also putting their activities on hold, the industrial sector’s energy requirements also decreased by approximately 9%. In raw numbers, consumption fell from a total of 238 million MWH in the spring of 2019 to 216 million MWH this year.
Additionally, according to U.S. electricity consumption data from NASA’s “Black Marble” satellite, drastic reductions of daily visits to retail establishments had a major effect on the declining energy usage in the commercial sector.
A notable exception to the diminished electricity requirements for commercial properties is power consumption in hospitals. Many hospitals have been fully geared toward handling and monitoring moderate and critical cases of coronavirus infections. And, because treatments typically heavily rely upon electrical devices — such as heart and vital signs monitors; IV machines; sequential compression devices; ventilators and so on — energy consumption here has increased sixfold.
Likewise, residential consumption increased by 8% Y-o-Y — from 309 million MWH between April and June last year to 334 million MWH in Q2 2020. That’s higher than April-June energy usage levels throughout the last decade. However, it’s important to note that 2019 witnessed lower-than-usual household electricity requirements due to milder temperatures that year and higher energy-efficiency standards. Therefore, that 8% Y-o-Y increase is an outlier in the 10-year period.
Zooming in to the state level, there was a 16% dip in total energy consumption in Washington, D.C. — the largest nationwide percentage drop during the second quarter — as government activity and services slowed, anticipating cuts, losses in tax collection, furloughs and a hiring freeze.
Meanwhile, in Wyoming, the number of MWH used between April and June fell 14% — due, in large part, to the declining energy requirements in the state’s industrial sector. And, in addition to suffering the same slowdown in manufacturing that many areas in the U.S. felt as the lockdown went into effect — and the subsequent drop in industrial energy consumption — Wyoming was also affected by its position as a major player in national energy production. Specifically, as the #1 coal-producing state and a top natural gas producer, a marked decrease in overall consumption brought a reduction in industrial activity in the energy sector, as well.
A few states — like California, Colorado, Nebraska and Iowa — saw hardly any changes in energy consumption levels in the second quarter as their single-digit industrial and commercial energy consumption decreases were offset by moderate residential growth.
Michigan Industrial Power Consumption Falls 32%, Record 21% Hike in Arizona & Michigan Residential Energy Sales
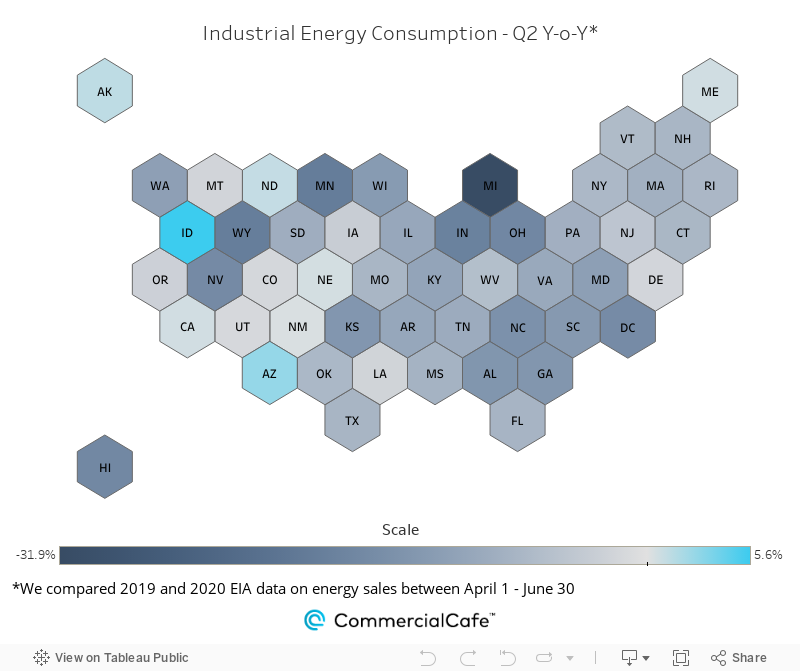
Breaking down state-level energy consumption by commercial, industrial or residential usage, Michigan witnessed the sharpest decline in energy requirements across its industrial sector with a 32% drop in MWH usage. And, as auto-manufacturing slowed or crawled to a halt in Michigan, it had a ripple effect on manufacturing across the U.S. because many other plants rely on components made exclusively in the Great Lakes state.
Further west, Idaho was one of the states in which utilities shutoffs were on hold during the lockdown. It was also one of six U.S. states — in addition to Alaska, Arizona, California, Maine and North Dakota — to actually register an increase in industrial power consumption during the second quarter with its 5.6% Y-o-Y bump.
Notably, Hawaii registered the most significant decrease in energy consumption in its commercial sector between April and June. In particular, the shuttering of many hotels, restaurants and other hospitality-related businesses, along with school closures, brought the sector’s power usage down by 22%. Pennsylvania and Washington, D.C. commercial energy consumption also fell by 21% and 20%, respectively.
In the meantime, with so much unused or underused space on the market, owners and investors are seeing renewed potential in adaptive reuses of these buildings. For instance, thousands of square feet of office space in Boston, San Diego, Houston and New York are currently being converted into lab space as demand for this type of space has been growing since the onset of the pandemic. And, as the lights come back on in many of these repurposed buildings, future energy needs will also likely increase, as well.
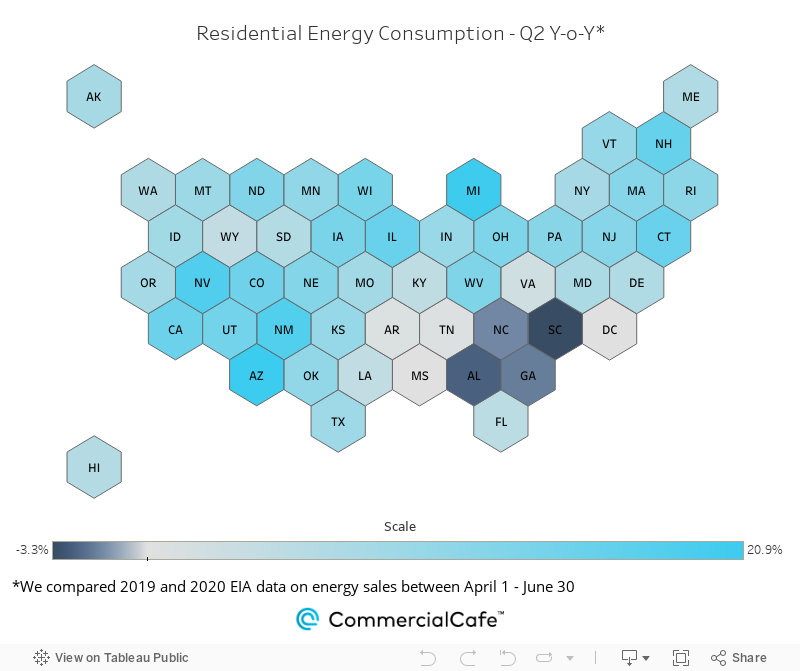
As expected, as lockdown and stay-at-home orders were issued in early spring, the residential sector overall witnessed an 8% increase in its energy consumption. That’s because, with many people stuck at home, household energy requirements went up as people used more electricity to power their laptops, air conditioners, appliances and TVs even outside of the usual peak hours. In fact, residential consumption in Arizona and Michigan jumped 21% in the second quarter, while Nevada registered a 19% increase and New Mexico went up 18% in the same period.
Meanwhile, in South Carolina, residential energy consumption actually went down by 3% between April and June — the result of milder spring temperatures, as well as the inability of residents to use their summer homes. Further south, an unusually warm winter had already kept residential electricity usage relatively low in Alabama. But, as the coronavirus crisis began, demand dropped another 2.6%, prompting consumer advocacy groups to petition utilities companies for a refund for over-collecting their fuel costs.
Low-Carbon Energy Generation Overtakes Coal in Q2 for First Time in 50 Years
It’s no secret that crises produce opportunities for fledgling technologies or alternative resources to step into a disrupted system and potentially become essential components of it. To that end, the beginning of the COVID-19 pandemic threw many industries into disarray, including transportation, tourism and manufacturing. And, while we’ve seen how energy consumption took a dive in many places because of this, it’s important to highlight what energy sources the U.S. economy has been running on in recent years, as well as what’s changed in regards to its power sources this year.
What immediately becomes apparent as we look at energy generation by source in the first half of 2020 is that natural gas maintained its prominent position in the energy market by contributing 40% of the energy requirements in the U.S. market.
Conversely, coal usage has dropped by at least 7% Y-o-Y. Coal’s share within the nation’s energy sales has actually been on a downward trajectory since 2010. The causes of this decline are twofold. On the one hand, coal faces increased competitiveness from renewables. On the other hand, energy demands in the coal-reliant branches of the industrial sector — such as cement manufacturing, steel production and synthetic fuels — decreased significantly following the onset of the pandemic.
Alternatively, according to a study by the World Economic Forum, low-carbon technologies — which include solar, wind, hydro and nuclear power — occupied a greater share of energy sales than coal in 2019 and early 2020. What’s more, reviewing the first six months of this year, it’s clear that nuclear and renewable energy have contributed nearly half of the total energy generated for consumption in the U.S. market. And, notably, between January and June of this year, the share of power generated through renewable sources overtook coal and matched nuclear output.
Finally, if we narrow our focus to the first three months following the lockdown, energy from renewable sources made up 23% of the total energy sales, as opposed to coal’s 16% contribution. Nevertheless, because the output of renewable technologies — especially wind and solar — varies by season, they remain at a disadvantage over the course of a year compared to nuclear energy or natural gas production. Furthermore, constraints on global supply chains also put a wrench in the U.S. renewable industry’s growth in 2020 as it’s heavily reliant upon the acquisition of photovoltaic cells or modules from China and Southeast Asia, as well as on wind farm components from Europe.
Methodology
This analysis uses data from the Energy Information Administration (EIA) and compared 2020 state-level energy sales throughout April, May and June with values from the same period in 2019.
Total energy sales — measured in megawatt-hours — as well as commercial, residential and industrial energy sales, were compared separately.
The study also uses yearly energy generation by source data provided by the EIA for the 2010-2019 interval, as well as preliminary numbers for the second quarter (April through June) and first half of 2020 (January 1 through June 30).
CommercialCafe is a commercial real estate internet listing service, part of Yardi’s network of platforms. Whether you’re looking for office, warehousing or retail space in any of the major U.S. markets, we can help you find the best solution for your business needs.


Diana Sabau
Senior Content Writer, CRE News & Market Analysis
Drawing on years of intense research in the U.S. commercial real estate market at Yardi Matrix, Diana now applies her expertise as a writer for the CommercialCafe blog. Her articles focus on CRE investment, labor market trends, and technology, and have been picked up by prestigious publications including the New York Times, GlobeSt, The Real Deal, NAIOP, MSN, and Bisnow.