Growing Demand for Flexibility Fuels Coworking Model Success, Medical Office Projects Increase Share of Construction Starts


Key Takeaways:
- The national office vacancy rate was 17.8% in March, following a decrease of 210 basis points (bps) year-over-year (Y-o-Y).
- The national office listing rate averaged $32.80 per square foot last month, which was nearly 2% lower than values recorded in March 2025.
- The office supply pipeline remained modest last month with nearly 29 million square feet of office space currently under construction.
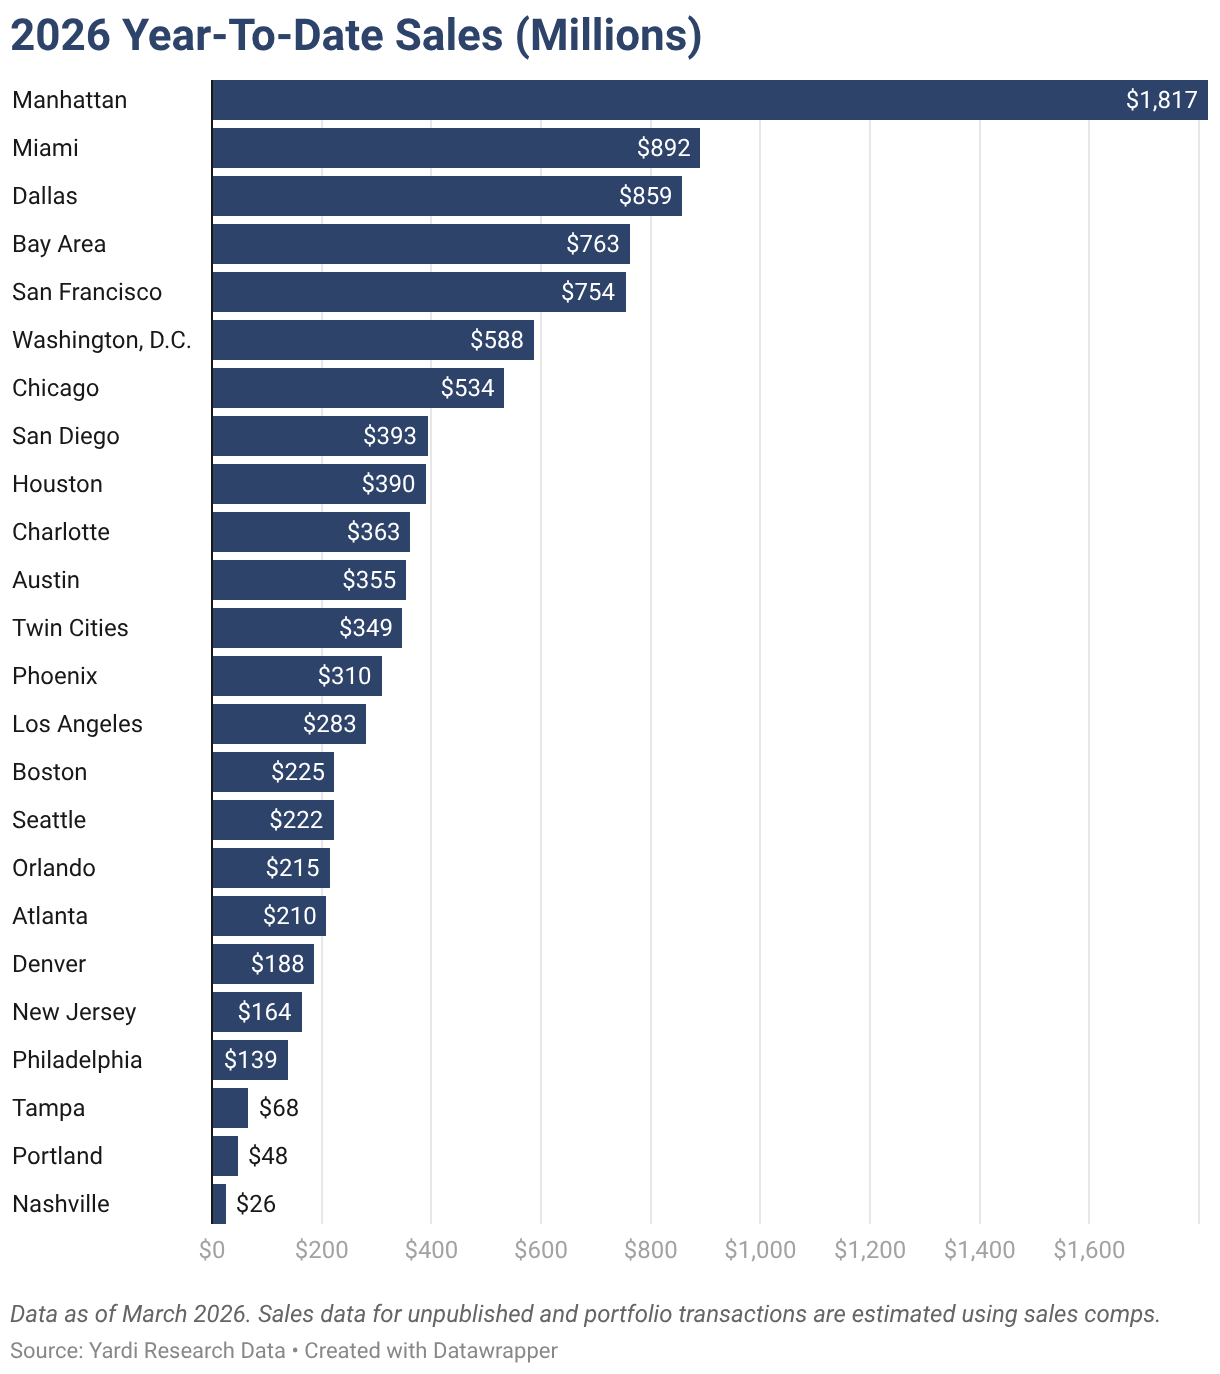
- With a little more than $1.8 billion in deals closed since the start of the year, Manhattan, N.Y., topped the list for sales. It was followed by Miami ($892 million) and Dallas ($859 million).
- Miami and Manhattan, N.Y., averaged the lowest vacancy ratesin March among the eight top U.S. office markets where vacancy was below the national average.
- Western and Northeastern markets had most of the leasing rates above the national average, while Midwestern and Southern markets claimed some of the most affordable office asking rates in March.
- Boston; Manhattan, N.Y.; Dallas; and Los Angeles had the most active construction pipelines and were the only markets with more than 2 million square feet of new office space in development last month.
Trends & Industry News
Coworking Spaces & Coworking Model Gain More Traction
The growing demand for flexibility from today’s workforce wields significant influence over the relevance — and market share — of coworking. As owners increasingly adapt to tenant needs, traditional office arrangements are changing to include concessions and amenities that more closely resemble the coworking model.
For example, in the last three years, physical office occupancy has averaged around 55%. More precisely, according to Kastle’s Back-to-Work Barometer, attendance ranges between 38% on low days and 66% on high days. Accordingly, as demand for hybrid working conditions remains high, flexible office solutions that initially became necessary after the onset of the COVID-19 pandemic are now opportunities for employers to consolidate their operations more efficiently.
At the same time, changing needs for office tenants are also evident in lease renewal negotiations pushing for terms that are more favorable for flexibility and, where needed, a leaner footprint. So, as the current national average vacancy rate sits at 17.8% and underperforming properties are changing hands at record discounts, property owners’ path of least resistance is to adapt by adopting strategies that, essentially, move them closer to the coworking model.
Meanwhile, the footprint of the coworking sector itself increased by 16.5% Y-o-Y, which brought the national total to 164 million square feet — a 30-bps increase to reach a total share of the office sector of 2.3%.
“Coworking continues to carve out a successful segment of the office universe. As owners lean into turnkey and serviced offerings in addition to traditional lease offerings, we expect this growth pattern to rapidly accelerate.”
Peter Kolaczynski, Director, Yardi Research
Though traditional office spaces are more stable at the enterprise level, it’s the smaller, strategically located office spaces with abundant amenities and flexible accommodations that are more likely to serve the needs of the current workforce during today’s economic uncertainty.
To that end, popular strategies include proposing shorter leases; offering leniency for early lease termination; adapting floor plans to create workspaces for the size and financial means of smaller tenants; and even partnering with established coworking operators to facilitate the transition to a new normal in the landscape of office work.
Listing Rates & Vacancy
Austin, Texas, Supply Pipeline Shrinks in an Opportunity for Vacancy Relief From Oversupply
The national average full-service equivalent listing rate for office space was $32.80 per square foot last month after a dip of 1.8% Y-o-Y. Similarly, the national vacancy rate dipped 210 bps compared to the previous year to rest at 17.8% at the close of March.
Of the 25 largest markets that we analyzed, 18 saw decreases in their vacancy rates since March of last year. In particular, Austin, Texas, saw vacancy fall 230 bps Y-o-Y to reach 26.2% last month. Despite this drop, vacancy in Austin was the highest among the U.S. markets analyzed for this report.
In fact, the Texas state capital has been working through a surplus of office space — a years-long issue in an otherwise strong market. That’s because developers have been hard at work delivering new office projects in recent years with the under-construction pipeline here as high as 3.3% of stock 12 months ago. That said, the supply pipeline has just begun to slow down, shrinking to 1% of stock this year in March and relieving some of the stress from the overabundance of office space.

Transactions
Discount Office Sales Account for Significant Share of Transactions in LA
In March, 2026 office sales added up to nearly $12.8 billion across 549 transactions as sale prices averaged $220 per square foot. Notably, a total of 21 of the top 25 metros analyzed for this report saw overall sales in excess of $100 million since the start of the year.
To that end, transactions of properties selling at a discount have been a noteworthy occurrence. For example, last year, 54% of transactions in Los Angeles that had two past sales prices for comparison were discounted. Furthermore, as of last month, California’s largest office market is on track for another record year as 57% of properties sold since the start of 2026 changed hands at a discount.
Among the latest such deals was the sale of Western Asset Plaza in Pasadena, Calif. The property changed hands last month for nearly $98 million, which was a 32% markdown from its previous sale price of about $144 million in 2012.
Supply
Medical Office Starts Pick Up Steam in Pipeline
As of March, nearly 29 million square feet of office space was under construction in the U.S. markets we tracked for this report. According to Yardi research data, this represented roughly 0.4% of stock. Additionally, during the first three months of the year, developers delivered 4.3 million square feet of office space.
For comparison, last year, office starts added up to 21.6 million square feet, of which roughly 84% was general office projects (47.6%), followed by medical office (25.8%) and life sciences (10.9%). Granted, as interest in general office space slowed, starts for these types of projects declined nearly 76% since the start of the decade. Otherwise, medical office starts fell only 17.3%, which ultimately translated to an increase from 10.9% in 2020 to 25.8% in 2025.
In this case, robust job growth in the health care sector and a high resistance to disruptions like remote work and automation job displacement has kept the sector afloat and maintained high developer interest.

Western Markets
LA Leads Office Development While Averaging Tightest Vacancy in Region
Vacancy rates were above the national average of 17.8% in March in the majority of the Western U.S. markets that we surveyed for this report. As a matter of fact, with the exception of Los Angeles (15% vacancy) and Phoenix (16.6%), all markets in this group averaged vacancy rates higher than 20% last month.
Specifically, Seattle office space vacancy remained the highest in the region, averaging 24.8% in March. Next, San Francisco was second with vacancy here averaging 23.3% last month.
Plus, office space in San Francisco topped the regional list for leases: Asking rates here averaged nearly $63 per square foot in March, which was almost double the national average of $32.80.
Not to be outdone, neighboring Bay Area office space was the second-priciest in the region last month with asking rates averaging close to $54 per square foot — the only other Western U.S. market on our list where average rates surpassed $50 per square foot in March.
Not far behind, San Diego (#3) and Los Angeles (#4) each averaged more than $40 per square foot and closed out the standout block of California markets occupying the top of spots on the list for rents.
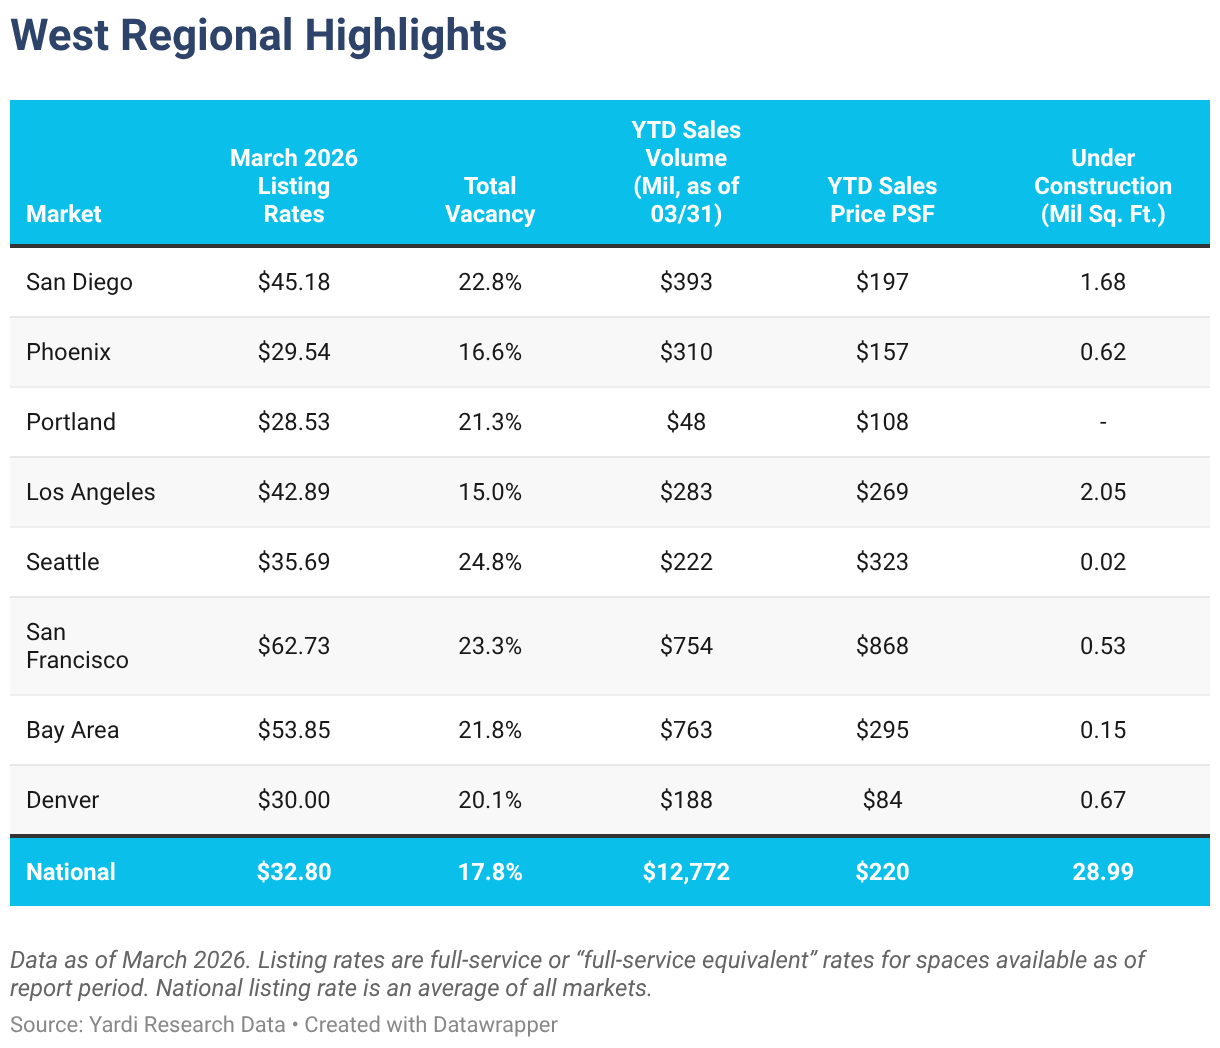
Portland, Ore.; Phoenix; and Denver were the only large markets in the Western U.S. where office asking rates were below the national average in March. Each averaged around or less than $30 per square foot.
Next, when looking at total market office sales in the region, data showed that northern California markets held a comfortable lead. Specifically, transactions closed in the Bay Area since the start of the year amounted to $763 million — only slightly ahead of the next-best-selling market in the region, San Francisco, which saw $754 million in sales closed during the first three months of the year.
Further south, San Diego office space commanded the third-highest sales total in the region so far this year ($393). It was followed by Phoenix, where sales added up to $310 million since the start of 2026 — the only other Western U.S. market to see office sales surpass $300 million during the first three months of the year.
Of course, high-profile assets in gateway markets continue to command top-tier prices. In particular, San Francisco office sales closed through March averaged $868 per square foot, which was the highest in the Western U.S. and, so far, also the highest nationwide.
California markets also led the region in terms of development in March. Namely, Los Angeles office space under development totaled more than 2 million square feet, followed by San Diego with nearly 1.7 million square feet. Together, they accounted for more than 65% of the roughly 5.7 million square feet currently in development across the largest markets in the region.
Midwestern Markets
Twin Cities Hold Lowest Vacancy in Region & 2nd-Lowest Lease Rates
The top Midwestern U.S. office markets we looked at for this report remained some of the most affordable in the country in March, both in terms of average listing rate and for-sale price per square foot.
First, asking rents for Detroit office space remained the most accessible in this group with rates here averaging roughly $21 per square foot. Similarly, the average asking rate for office space in Minneapolis; St. Paul, Minn.; and the wider Twin Cities metro submarkets rested slightly above $27 per square foot. Additionally, occupancy levels in the Minnesota market last month also kept vacancy at 17.4% to make it the only large market in the region to finish below the national average of 17.8% last month.
Unsurprisingly, Chicago office space was the region’s priciest for leasing last month with asking rents averaging $28.33 per square foot. Occupancy levels here averaged an 18.2% vacancy rate, which was slightly above the national average.

Likewise,
the highest regional office sales total thus far this year was in Chicago. By the start of April, the largest office market in the Midwest had seen $534 million worth of office space change hands since the beginning of the year. Then, at quite a distance, office sales in the Twin Cities followed in second place with a total of $349 million through March 2026.
Other than those, development in the region remained quite slow last month with a combined total of less than 900,000 square feet of office space under construction in March across the Midwestern U.S. markets we analyzed.
Southern Markets
Texas Markets Top Development as Miami Leads Leasing Rates Sales & Vacancy
In the South, Miami; Austin, Texas; and Washington, D.C. topped the list in terms of asking rents and were the only Southern U.S. markets to see full-service equivalent listing rates averaging more than $40 per square foot in March.
At the opposite end of the ranking, office space in Orlando, Fla., had the lowest asking rent average in the region and was one of only two markets in this group to average less than $30 per square foot last month (the other was Houston).
Meanwhile, a look at year-to-date office sales showed that eight of the Southern U.S. markets we analyzed for this report recorded totals higher than $200 million through last month. First, Miami had the highest year-to-date sales total as office transactions here amounted to $892 million last month. Next, Dallas office sales totaled $859 million through March, followed by office space in Washington, D.C. ($588 million).
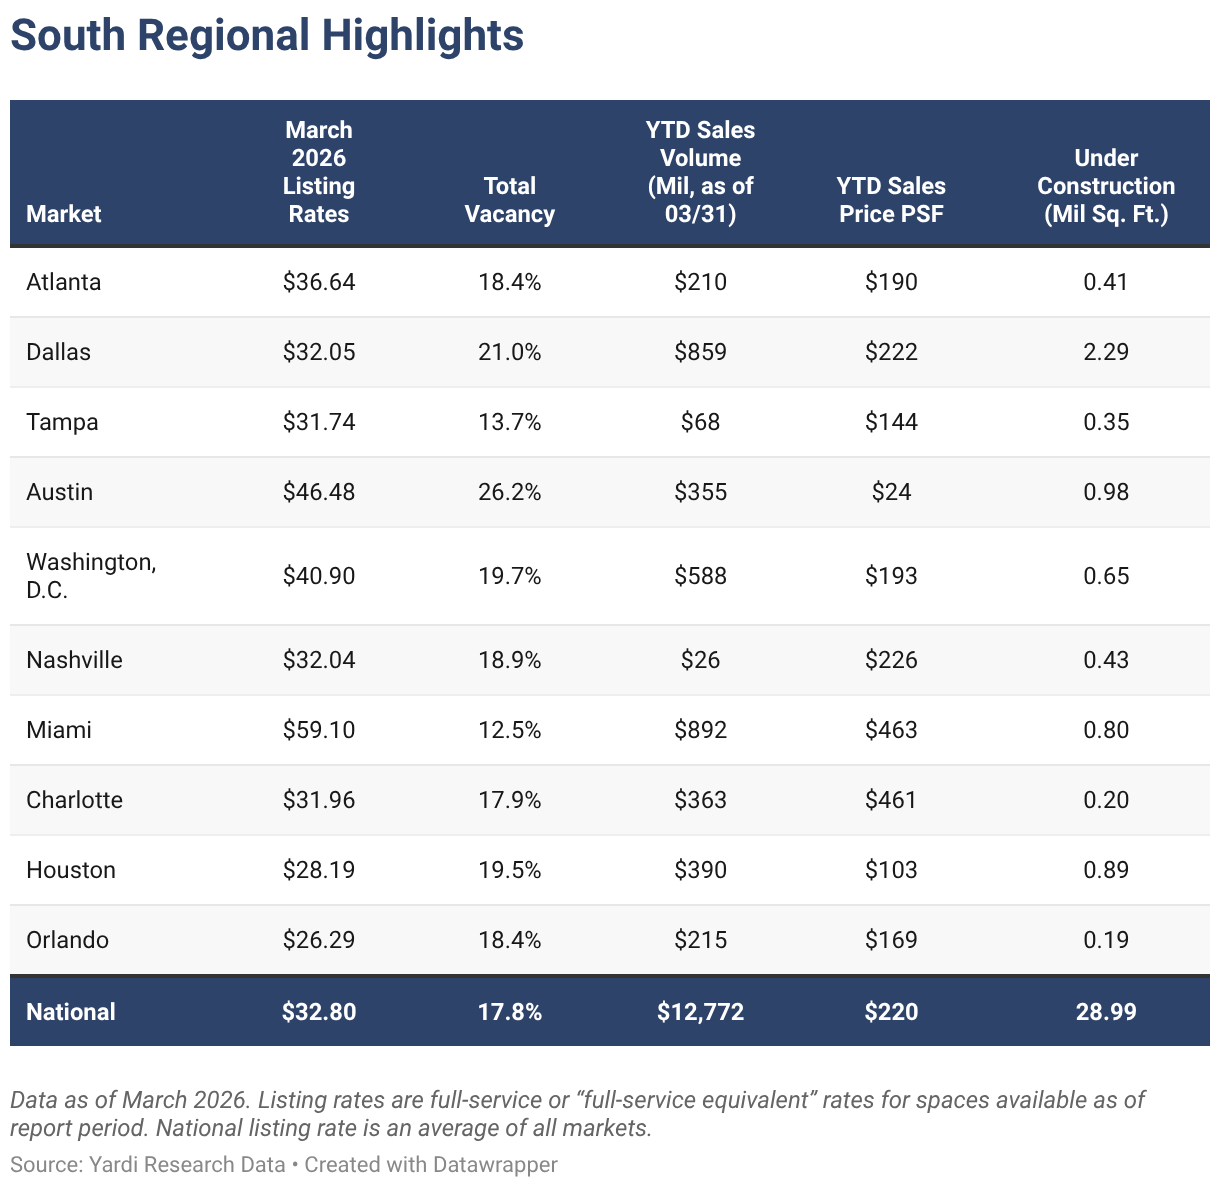
Then, looking at leasing data, office space in Miami had the highest average full-service equivalent listing rate in the region in March at $59 per square foot. Next, office space in Austin, Texas, asked an average of nearly $47 per square foot, followed by Washington, D.C. — the only other market in this regional group to see lease rates average more than $40 per square foot last month.
One other market in the region also rested above the national average last month: Office space in Atlanta saw asking leasing rates approach $37 per square foot.
Notably, Texas’ Austin and Dallas had the highest vacancy rates in the region in March 2026 and were the only ones to exceed 20%. At the same time, Miami and Tampa, Fla., had the highest rates of occupancy and were the only Southern U.S. markets with vacancy below the national average last month.
As for construction, data showed that Texas markets carried more than half of the office pipeline in the region: In March, nearly 2.3 million square feet of office space was in development in Dallas, roughly 1 million square feet was under construction in Austin and Houston’s pipeline totaled close to 900,000 square feet. Combined, these three Texas powerhouses accounted for nearly 58% of development in the region and roughly 14% of the national pipeline.
Northeastern Markets
Manhattan, N.Y., Dominates Leasing & Sales, Boston Tops Development
In March, Manhattan, N.Y., had the highest average listing rate in the region at close to $70 per square foot. For comparison, asking rents for Philadelphia office space averaged slightly above $31 per square foot, making it the only Northeastern U.S. office market to ask less than the national average of $32.80 per square foot last month.
Looking at construction, three of the four largest office markets in the Northeast had more than 1 million square feet of new office space in development. Together, they accounted for about 27% of the national pipeline last month.
Boston led supply in the region as office projects in development here totaled close to 3.9 million square feet. Next, the Manhattan, N.Y., office space pipeline was the second-largest in the region last month with more than 2.9 million square feet under construction. With that, these two Northeastern U.S. markets accounted for about 23% of the country’s total pipeline of approximately 29 million square feet last month.
Lastly, the New Jersey office space pipeline was the only other market in the region to exceed 1 million square feet in March.
As you might expect, an analysis of office sales showed that transactions in Manhattan, N.Y., amounted to the largest sales total since the start of the year in both the region and the country — more than $1.8 billion. Next, Boston sales added up to $225 million by the end of March, while transaction activity in New Jersey during the first three months of the year totaled nearly $164 million in year-to-date office sales.

Office-Using Employment
Office Job Losses Stabilize in San Francisco
According to data from the Bureau of Labor Statistics, office-using sectors of the labor market lost a combined 16,000 jobs last month, led by financial activities and information. However, the professional and business services sector gained 2,000.
Looking at office-using sectors on a year-over-year basis, data showed a loss of 183,000 jobs nationally, which represented a 0.5% decrease in 12 months.
Specifically, San Francisco saw a stabilization of office job losses in 2025 to close out the year with a 2.2% drop in 12 months. That’s a long way from the 7% loss the city recorded in late 2023, when office job losses were at their most recent worst in the California dynamo. A significant share of the losses suffered in 2023 and in 2024 was concentrated in the information sector, where companies reversed course from previous surges in hiring while interest rates were low and the AI hype caused a flood of investment in tech.

Methodology
This report covers office buildings that are 25,000 square feet or larger. Listing rate and occupancy information was based on Yardi Research data.
Listing rates are full-service rates or “full-service equivalent” for spaces that were available as of the report period.
Vacancy refers to the total square feet vacant in a market (including subleases) divided by the total square feet of office space in that market. Owner-occupied buildings are not included in vacancy calculations. For reporting purposes, A and A+/trophy buildings were combined.
Stages of the supply pipeline:
Planned — Buildings that are currently in the process of acquiring zoning approval and permits, but have not yet begun construction.
Under Construction — Buildings for which construction and excavation has begun.
Office-Using Employment is defined by the Bureau of Labor Statistics as including the sectors Information, Financial Activities, and Professional and Business Services. Employment numbers are representative of the metropolitan statistical area and do not necessarily align exactly with CommercialCafe market boundaries.
Sales volume and price-per-square-foot calculations for portfolio transactions or those with unpublished dollar values were estimated using sales comps based on sales that were similar in terms of the market and submarket; use type; location and asset ratings; sale date; and property size.
Market boundaries in the CommercialCafe office report coincide with markets defined in the CommercialCafe Markets Map and may differ from regional boundaries defined by other sources.
Fair Use & Redistribution
We encourage and freely grant you permission to reuse, host, or repost the research, graphics, and images presented in this article. When doing so, we kindly ask that you credit our research by linking to CommercialCafe.com or this page so that your readers can learn more about this project, the research behind it, and its methodology. For more in-depth, customized data, please contact us at [email protected].


Ioana Ginsac
Senior Content Writer, Industry News & Reports
Ioana is a content writer who has been covering all-things-CRE (and more) for several Yardi network publications since 2017. You will find her byline regularly in industry news and market reports, but also on articles covering sustainable development, green urbanism, and innovation, all of which she has been passionately learning about for more than a decade. Her work has been referenced by publications including AmericanInno, Bisnow, BusinessInsider, Commercial Property Executive, Curbed, Fast Company, Forbes, GlobeSt.