Construction Starts Pick Up, Office Prices Begin Rebound


Key Takeaways:
- The national office vacancy rate was 18.2% in January, following a decrease of 150 basis points (bps) year-over-year (Y-o-Y).
- The national office listing rate averaged $32.55 per square foot in January, which was 2.5% lower than values recorded 12 months prior.
- The office supply pipeline remained modest at the start of 2026 with nearly 29 million square feet of office space currently under construction.
- Manhattan, N.Y., topped the list for sales with a total of nearly $1.3 billion closed since the start of the year, followed by Miami ($506 million) and the Bay Area (nearly $360 million).
- Manhattan, N.Y., and Miami averaged some of the lowest vacancy rates among the top U.S. office markets in January.
- Western and Northeastern markets were home to most of the leasing rates above the national average, while Midwestern and Southern markets claimed some of the most affordable office asking rates last month.
- Boston; Manhattan, N.Y.; Dallas; and Los Angeles had the most active office pipelines and were the only cities to surpass 2 million square feet of new office space under construction in January.
Trends & Industry News
Office Sale Prices Begin to Rebound Along Quality & Location Preferences
According to Yardi Matrix research, the average sale price of an office building marked the first increase since 2021 last year — up 6.1% from $172 a year ago to $182 per square foot in 2025. Although most markets are still far below their 2019 values, many have begun to recover after significant increases in average prices last year.
Notably, values in four of the top 25 metros analyzed for this report have surpassed their respective pre-COVID 19 levels: Miami prices increased 20% from 2019, followed by Dallas (8.5%); Detroit (8.4%); and Orlando, Fla. (5.8%).
Of course, property class and location also seem to have been influential in rebound trends across the country. For instance, prices for office properties rated A or A+ increased 7.5% Y-o-Y in 2025, whereas B-rated properties saw prices increase 6.2%.
Meanwhile, suburban property prices increased 15.5%, while central business district (CBD) office buildings claimed 13% higher prices in 2025. However, urban office space prices fell 16.5% during that same time, while still remaining above both CBD and suburban prices in terms of value — a possible indication of unresolved tension that is yet to be worked out in pricing.
While the rate of properties changing hands at lower prices than previous sales has begun to decline, the total number of discounted office sales increased along with overall transaction activity. Notable examples include the sale of 4 Overlook Point in suburban Chicago (a 96% discount from its $148 million sale in 2012 to just $6.2 million in 2025) and the acquisition of 175 W. Jackson Blvd. in downtown Chicago that sold for $41 million, which was roughly 87% less than its $306 million price tag in 2018.
“National price per square foot numbers did manage to rebound in 2025 but are still well below pre-Covid values. A positive, yes, but concern lingers based on the number of discounted sales in 2025 and the potential for prolonged destress of buildings that have been delaying debt maturing for years.”
Peter Kolaczynski, Director, Yardi Research
Listing Rates & Vacancy
Vacancy Rates Remain High in Corporate Tech-Heavy Markets
The national average full-service equivalent listing rate for office space was $32.55 per square foot in January. At the same time, the national vacancy rate dipped 150 bps compared to the previous year to rest at 18.2% at the close of January.
Of the 25 largest markets that we analyzed, 15 saw decreases in their vacancy rates since last January. While the level of vacancy seems to have somewhat stabilized in certain markets, others continue to see fluctuation. Namely, vacancy dropped by more than 300 bps during the last 12 months in Manhattan, N.Y., and California’s Bay Area.
Specifically, New York City office vacancy decreased 350 bps to reach 13.1% at the close of January for the lowest vacancy rate among the top markets analyzed for this report. On the opposite coast, the Bay Area saw a 320-bps year-over-year drop in vacancy, averaging 23.1% last month.
That said, tech-heavy metros continue to experience stubbornly high rates. Such is the case for Seattle, which has the highest vacancy rate among the top 25 markets in the U.S. at 27%. Plus, Amazon’s recently confirmed plans to “remove bureaucracy” by shedding some 16,000 corporate jobs across its operations in the U.S., Canada, and Costa Rica further fuel speculation that the office vacancy rate in Seattle is likely to climb even higher.

Transactions
Manhattan Kicks Off Year With Strong Sales Activity
In January, office sales added up to a little more than $4 billion across 121 transactions as sale prices averaged $278 per square foot. And, although sales activity was off to a slow start this year in some markets, nine of the top 25 metros analyzed for this report saw sales in excess of $100 million last month.
Notably, Manhattan, N.Y., kicked off the year with more than $1 billion in sales closed in January, which puts it on track to continue the trend it set last year: Totaling nearly $7.8 billion, 73 transactions closed here in 2025, which was the highest number since the start of the decade.
The strength of the market was also evident in the sales price growth recorded in 2025. Last year’s average of $495 per square foot represented a 21.5% increase from 2024.
To that end, investor interest and asset appeal continued through this January, when the Park Avenue Tower in Manhattan changed hands for $730 million — a 7.5% markdown from the property’s previous sale in 2014, but nevertheless accounting for almost 60% of the market’s sales total last month.
Despite the Manhattan office market firing on all cylinders and looking poised to increase transaction activity even higher than last year, lenders seem to remain cautious even around high-profile Park Avenue assets. For instance, SL Green contributed a down payment of nearly $270 million to secure a $480 million loan to finance the acquisition. That’s a significantly higher down payment than what Blackstone put up when purchasing the building in 2014 for $750 million.

Supply
12-Month Construction Starts Mark Notable Y-o-Y Increase
As of January, nearly 29 million square feet of office space was under construction in the U.S. markets we tracked for this report. This marks a nearly 43% Y-o-Y drop from the roughly 51 million square feet that was under construction at the start of last year. Plus, a full turnaround is unlikely for the shrinking office supply pipeline. Even so, it’s worth noting that there has been an uptick in construction starts.
According to Yardi Matrix data, the nearly 14 million square feet of office space started during the last year represents an 18.5% increase during the prior 12-month period. And, although starts remain at a historic low, this increase does mark a significant shift and encourages developer hopes that it might grow into a boost to new project construction.

Western Markets
San Francisco Tops Leasing Rates; LA & San Diego Dominate Development at Start of Year
Vacancy rates were above the national average of 18.2% in January in the majority of the Western U.S. markets that we surveyed for this report. With the exception of Los Angeles (14.6% vacancy) and Phoenix (17%), all markets in this group averaged vacancy rates higher than 21% last month.
Among them, Seattle office space retained the highest vacancy rate in the region, averaging 27% in January. Next, San Francisco was again second on this short list with vacancy averaging 24.7% last month.
Likewise, asking rents for office space in San Francisco remained at the top of the regional list at the start of the year: Rates here averaged nearly $64 per square foot in January, which was almost double the national average of $32.55.
Neighboring Bay Area office space was the second-priciest in the region last month with asking rates here slightly exceeding $53 per square foot, on average — the only other Western U.S. market on our list where average rates surpassed $50 per square foot in January.
Not far behind, Los Angeles (#3) and San Diego (#4) each averaged more than $45 per square foot and closed out the standout block of California markets at the top of the list for rents.
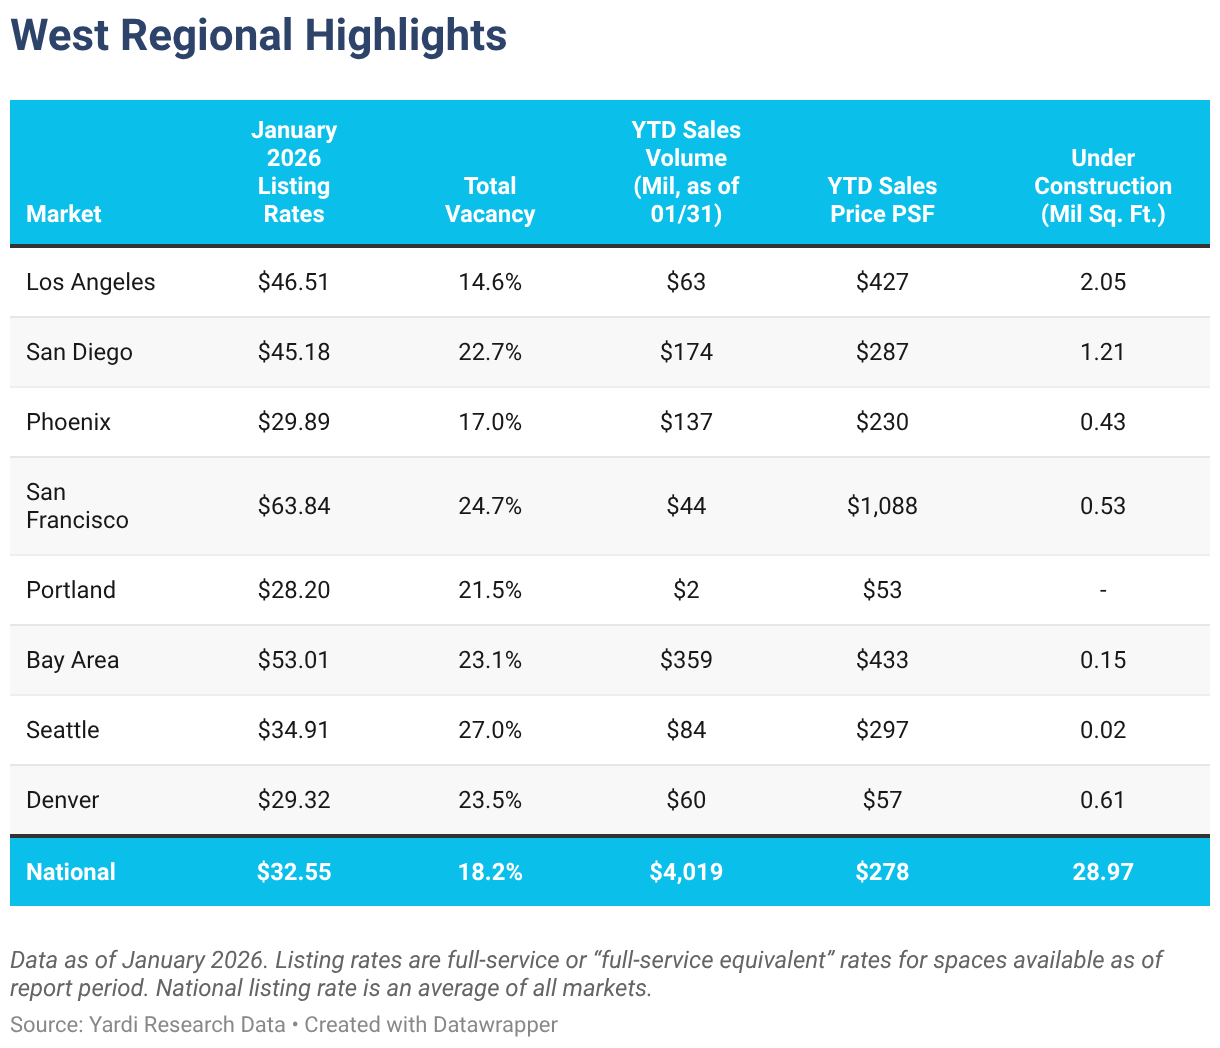
Otherwise, Portland, Ore.; Denver; and Phoenix remained the only large markets in the Western U.S. where office asking rates were below the national average in January. Each averaged less than $30 per square foot.
Meanwhile, when looking at total market office sales in the region, the Bay Area retained its top spot. Transactions closed here since the start of the year amounted to almost $360 million — nearly $200 million more than the next-best-selling market in the region: San Diego office space saw almost $175 million in sales closed last month. Phoenix was the only other market in the region to see office sales surpass $100 million in January.
High-profile assets in gateway markets continue to command top-tier prices. San Francisco stood out last month for the sale of the 10-story Gucci Building Union Square — sold for $44 million, the nearly 40,500-square foot property claimed $1,088 per square foot from the new owners.
California markets also led the region in terms of development in January. In particular, Los Angeles office space under development totaled more than 2 million square feet, followed by San Diego with roughly 1.2 million square feet. Together, they accounted for more than 65% of the current development across the largest markets in the region. For comparison, at the start of 2026, each of the other Western U.S. markets that we analyzed had less than 1 million square feet of new office space under construction.
Midwestern Markets
Chicago Tops Asking Rates, Twin Cities Maintains Lowest Vacancy
The top Midwestern U.S. office markets we looked at for this report remained some of the most affordable in the country in January, both in terms of average listing rate and for-sale price per square foot.
First, Detroit office space remained the most accessible in this group with asking rents here averaging nearly $22 per square foot. Similarly, the average asking rate for office space in Minneapolis; St. Paul, Minn.; and the wider Twin Cities submarkets rested at a little more than $27.50 per square foot. Additionally, occupancy levels in the Minnesota market last month also kept vacancy at 17.8% — the only large market in the region to finish below the national average of 18.2% last month.
Unsurprisingly, Chicago office space was the region’s priciest metro to lease in last month with asking rents averaging $28.75 per square foot. Occupancy levels in the Windy City averaged an 18.6% vacancy rate, which was slightly above the national average.

As one might expect, the highest regional office sales total so far this year was in Chicago, which is the largest office market in the Midwest: $202 million worth of office space changed hands here in January. At a significant distance, office sales in the Twin Cities added up to $25 million.
Otherwise, construction in the region at the start of the year was rather muted with a combined total of less than 500,000 square feet of office space under construction in January across the Midwestern U.S. markets we analyzed.
Southern Markets
Texas Markets Lead Development in Region as Miami Tops Lease Rates & Vacancy
In the South, Miami and Austin, Texas, topped the list in terms of asking rents. These were also the only Southern U.S. markets to see full-service equivalent listing rates averaging more than $40 per square foot in January.
At the opposite end of the ranking, office space in Orlando, Fla., had the lowest asking rent average in the region and was one of only two markets in the region to average less than $30 per square foot last month.
Meanwhile, a look at office sales showed that four of the Southern U.S. office markets we analyzed for this report recorded totals higher than $100 million last month. First, Miami had the highest year-to-date sales total as office transactions here amounted to $506 million last month. Next, Orlando sales totaled nearly $190 million last month, followed by Houston ($138 million) and office space in Washington, D.C. ($133 million).

Looking at leasing data, office space in Miami had the highest average full-service equivalent listing rate in the region in January at a little more than $56 per square foot. The only other market in this regional group to see lease rates average more than $40 per square foot last month was in Texas: Office space in Austin asked an average of nearly $46 per square foot.
Otherwise, three other markets in the region rested above the national average last month: Asking rates for Washington, D.C. office space averaged just under $40 per square foot; office space in Atlanta asked an average of nearly $37 per square foot; and Charlotte, N.C., office space averaged slightly above the national rate at $32.62.
Notably, Texas’ Austin and Dallas had the highest vacancy rates in the region last month and were the only ones to exceed 20%. At the same time, Miami; Tampa, Fla.; and Charlotte, N.C., had the highest rates of occupancy and were the only Southern U.S. markets to see vacancy below the national average last month.
As for construction, data showed that Texas markets carried most of the office pipeline in the region: In January, nearly 2.5 million square feet of office space was in development in Dallas, roughly 1.4 million square feet was under construction in Austin, and Houston’s pipeline totaled a little more than 1 million square feet.
These three Texas markets were also the only ones in the region to each see more than 1 million square feet of office space under construction last month. Combined, they accounted for nearly 60% of development in the region and roughly 17% of the national pipeline.
Northeastern Markets
NYC Leads Leasing Rates & Sales, Development in the Region Makes Up 30% of National Pipeline
In January, Manhattan, N.Y., had the highest average listing rate in the region at a little more than $67 per square foot. At the same time, asking rents for Philadelphia office space were nearly $31 per square foot, making it the only Northeastern U.S. office market to ask less than the national average of $32.55 per square foot last month.
Next, looking at construction, three of the four largest office markets in the Northeast had more than 1 million square feet of new office space in development. Together, they accounted for nearly 30% of the national pipeline in January.
Boston led supply in the region as office projects in development here totaled a little more than 4.1 million square feet. Next, the Manhattan, N.Y., office space pipeline was the second-largest in the region last month with more than 2.7 million square feet under construction. Combined, these two Northeastern U.S. markets accounted for nearly 24% of the country’s total pipeline of about 29 million square feet last month.
Lastly, the New Jersey office space pipeline was the only other one in the region to exceed 1 million square feet in January.
Nearby, an analysis of office sales showed that transactions in Manhattan, N.Y., amounted to nearly $1.3 billion — the largest sales total since the start of the year in both the region and the country. Granted, the year was off to a slower start in terms of transactions in the other large markets in the region, each closing January with less than $100 million in office sales.

Office-Using Employment
Phoenix Starts Year With 3rd-Largest Office Employment Growth
Analyzing national trends on a year-over-year basis, employment data from the Bureau of Labor Statistics showed that office-using sectors lost 108,000 jobs nationally, which represented a 0.3% decrease. Specifically, in December, the professional and business services sector added 34,000 jobs, whereas the financial activities sector lost 22,000 jobs and the information sector lost 12,000.
Then, looking at trends on a market level, data showed that Phoenix has been seeing slow and steady recovery in terms of office employment since job growth here bottomed out in late 2024. In fact, with employment growth reaching a 2.1% Y-o-Y increase in December, Phoenix ranked third-best in this respect — behind Charlotte, N.C., and Pittsburgh — to land among the top 25 markets analyzed for this report.
Finally, although the information sector in Phoenix has lagged after losing 18,000 jobs in 2025, other sectors more than picked up the slack. More precisely, local employment in the professional and business services added 16,400 jobs, and financial activities contributed another 3,900 jobs.

Methodology
This report covers office buildings that are 25,000 square feet or larger. Listing rate and occupancy information was based on Yardi Research data.
Listing rates are full-service rates or “full-service equivalent” for spaces that were available as of the report period.
Vacancy refers to the total square feet vacant in a market (including subleases) divided by the total square feet of office space in that market. Owner-occupied buildings are not included in vacancy calculations. For reporting purposes, A and A+/trophy buildings were combined.
Stages of the supply pipeline:
Planned — Buildings that are currently in the process of acquiring zoning approval and permits, but have not yet begun construction.
Under Construction — Buildings for which construction and excavation has begun.
Office-Using Employment is defined by the Bureau of Labor Statistics as including the sectors Information, Financial Activities, and Professional and Business Services. Employment numbers are representative of the metropolitan statistical area and do not necessarily align exactly with CommercialCafe market boundaries.
Sales volume and price-per-square-foot calculations for portfolio transactions or those with unpublished dollar values were estimated using sales comps based on sales that were similar in terms of the market and submarket; use type; location and asset ratings; sale date; and property size.
Market boundaries in the CommercialCafe office report coincide with markets defined in the CommercialCafe Markets Map and may differ from regional boundaries defined by other sources.
Fair Use & Redistribution
We encourage and freely grant you permission to reuse, host, or repost the research, graphics, and images presented in this article. When doing so, we kindly ask that you credit our research by linking to CommercialCafe.com or this page so that your readers can learn more about this project, the research behind it, and its methodology. For more in-depth, customized data, please contact us at [email protected].


Ioana Ginsac
Senior Content Writer, Industry News & Reports
Ioana is a content writer who has been covering all-things-CRE (and more) for several Yardi network publications since 2017. You will find her byline regularly in industry news and market reports, but also on articles covering sustainable development, green urbanism, and innovation, all of which she has been passionately learning about for more than a decade. Her work has been referenced by publications including AmericanInno, Bisnow, BusinessInsider, Commercial Property Executive, Curbed, Fast Company, Forbes, GlobeSt.