Slow Construction Starts, Rising Office Decommissioning & Conversion Trends Support Conditions for Vacancy Improvement


Key Takeaways:
- The national office vacancy rate was 17.6% in February, following a decrease of 200 basis points (bps) year-over-year (Y-o-Y).
- The national office listing rate averaged $32.79 per square foot in February, which was nearly 2% lower than values recorded 12 months prior.
- The office supply pipeline remained modest last month with a little more than 28 million square feet of office space currently under construction.
- With a total of nearly $1.6 billion closed since the start of the year, Manhattan, N.Y., topped the list for sales. It was followed by the Bay Area ($680 million), and Miami ($666 million).
- Miami and Manhattan, N.Y., averaged some of the lowest vacancy rates among the top U.S. office markets in February.
- Western and Northeastern markets saw most of the leasing rates above the national average, while Midwestern and Southern markets claimed some of the most affordable office asking rates last month.
- Boston; Manhattan, N.Y.; Dallas; and Los Angeles had the most active office pipelines and were the only markets with more than 2 million square feet of new office space under construction in February.
Trends & Industry News
Slowdown in Life Sciences Development Leaves Breathing Room for Absorption of Oversupply
According to Yardi Matrix research, a little more than 47 million square feet of life sciences space has been delivered since 2020. Annual deliveries peaked in 2024 at nearly 14 million square feet before slipping to 11.2 million square feet last year. Of course, new supply has been largely concentrated in San Francisco (which delivered nearly 30% of the national pipeline in 2025), Boston (20%), and San Diego (13%). Nationwide, new starts have declined from a peak of 15.4 million square feet in 2022 to just 2.4 million in 2025.
Although investor interest in life sciences properties increased slightly last year, activity is still low for the decade. Additionally, the price per square foot in 2025 was down 23.9% from the previous year. Last year, life sciences sales totaled $1.7 billion across 37 transactions, up from the $0.6 billion from 14 sales closed in 2024.
Granted, changes in the approach to disbursement from the National Institutes of Health took a toll on a significant number of research grants, and uncertainty persists across a large segment of the scientific research community. That said, the drop in life sciences construction starts also creates an opportunity for the current oversupply to be absorbed in time, which may lead to life sciences again being a strong subset of the office market for the foreseeable future.
“Life sciences development overextended a bit coming out of Covid. Currently, we see investment interest stabilizing even as there is a still a glut of freshly delivered space available. Expectation is for the industry to grow into the space over the rest of the decade, albeit with fewer deliveries adding new space.”
Peter Kolaczynski, Director, Yardi Research
Listing Rates & Vacancy
Denver Office Vacancy Dips Below 20%
The national average full-service equivalent listing rate for office space was $32.79 per square foot last month after a nearly 2% Y-o-Y dip. At the same time, the national vacancy rate dipped 200 bps compared to the previous year to rest at 17.26% at the close of February.
Of the 25 largest markets that we analyzed, 19 saw decreases in their vacancy rates since February of last year. In particular, vacancy in suburban Denver submarkets have seen improvement, and the market’s overall rate dipped below 20% last month. What’s more, because the local supply pipeline has been dwindling every year since 2021, the effect of new stock on existing properties has also decreased.
Plus, decommissioning underused office space and the rising trend of adaptive-reuse conversions turning office properties like the 13-story Denver Tech Center into multifamily housing has also helped improve overall office vacancy stats in the area.

Transactions
Miami On Track for Highest Quarterly Sales Since 2020
In February, office sales added up to nearly $8 billion across 316 transactions as sale prices averaged $218 per square foot. And, although sales activity was off to a slow start this year in some markets, 15 of the top 25 metros analyzed for this report saw total sales in excess of $100 million last month.
To that end, Manhattan, N.Y., tallied up more than $1.6 billion in sales closed since the start of the year to land significantly ahead of any other office market in the U.S. last month. Among the rest, Miami seems to be on track to have its highest quarterly sales volume since 2020. So far this year, office transactions here added up to $666 million, which fell very closely behind sales in the sizeable Bay Area market.
Notably, property values in the Florida market also held high: Last year, office sales in Miami averaged $365 per square foot, which marked a 20% increase compared to prices in 2019.

Supply
Manhattan, N.Y., Tops Construction Starts
As of February, more than 28 million square feet of office space was under construction in the U.S. markets we tracked for this report. According to Yardi research data, this represented roughly 0.4% of stock.
Yet, the national supply pipeline remains at a significant low: In 2019, 20 markets had at least 1 million square feet of office space starting construction, whereas, in 2025, there were only three. Although the decline in construction starts has slowed and leveled off throughout the course of the last two years, there’s no significant increase expected in the near future.
On a market level, Manhattan was a clear leader in terms of construction starts last year — a lead that New York City has maintained in 2026 so far. More precisely, projects totaling 2.3 million square feet broke ground here in 2025, which accounted for 16% of total starts.
West Palm Beach, Fla., followed with 1.4 million square feet breaking ground last year (nearly 10% of all construction starts). Boston was third with 1.2 million square feet of new projects breaking ground in 2025 (8.5% share of total starts).

Western Markets
LA & San Diego Dominate Office Pipeline; San Francisco & Bay Area Top Lease Rates & Sales
Vacancy rates were above the national average of 17.6% in February in the majority of the Western U.S. markets that we surveyed for this report. In fact, with the exception of Los Angeles (14.5% vacancy) and Phoenix (17%), all markets in this group averaged vacancy rates higher than 19% last month.
Specifically, Seattle office space vacancy remained the highest in the region, averaging 25.1% in February. Next, San Francisco was second with vacancy here averaging 24.2% last month.
At the same time, office space in San Francisco topped the regional list for leases: Asking rates here averaged nearly $63 per square foot in February, which was almost double the national average of $32.79.
Neighboring Bay Area office space was the second-priciest in the region last month with asking rates here averaging close to $53 per square foot — the only other Western U.S. market on our list where average rates surpassed $50 per square foot in February.
Not far behind, San Diego (#3) and Los Angeles (#4) each averaged more than $40 per square foot and closed out the standout block of California markets reigning at the top of the list for rents.

Otherwise, Portland, Ore.; Phoenix; and Denver were the only large markets in the Western U.S. where office asking rates were below the national average in February. Each averaged around or less than $30 per square foot.
Next, when looking at total market office sales in the region, the Bay Area retained its top spot. Transactions closed here since the start of the year amounted to $680 million — more than $300 million ahead of the next-best-selling market in the region: San Diego office space saw $347 million in sales closed last month. Phoenix, Seattle, and Denver were the only other markets in the region to see office sales surpass $100 million during the first two months of the year.
Meanwhile, high-profile assets in gateway markets continue to command top-tier prices. In particular, San Francisco stood out this year for the sale of the 10-story Gucci Building in the city’s Union Square, which sold for $44 million. The nearly 40,500-square foot property claimed $1,088 per square foot in the transaction.
California markets also led the region in terms of development in February. Namely, Los Angeles office space under development totaled more than 2 million square feet, followed by San Diego with roughly 1.2 million square feet. Together, they accounted for more than 65% of the nearly 5 million square feet currently in development across the largest markets in the region.
Midwestern Markets
Chicago Tops Asking Rates, Twin Cities’ YTD Sales Pick Up
The top Midwestern U.S. office markets we looked at for this report remained some of the most affordable in the country in February, both in terms of average listing rate and for-sale price per square foot.
First, asking rents for Detroit office space remained the most accessible in this group with rates here averaging less than $22 per square foot. Similarly, the average asking rate for office space in Minneapolis; St. Paul, Minn.; and the wider Twin Cities metro submarkets rested at nearly $27 per square foot. Additionally, occupancy levels in the Minnesota market last month also kept vacancy at 16.8% to make it the only large market in the region to finish below the national average of 17.6% last month.
As you might expect, Chicago office space was the region’s priciest metro for leasing last month with asking rents averaging $28.71 per square foot. Occupancy levels here averaged an 18.4% vacancy rate, which was slightly above the national average.

Likewise, the highest regional office sales total so far this year was in Chicago, which is the largest office market in the Midwest: $309 million worth of office space changed hands here since the start of the year. Not to be outdone, office sales in the Twin Cities followed closely behind in second place with a total of $289 million in 2026 through February.
Otherwise, construction in the region remained rather muted last month with a combined total of less than 500,000 square feet of office space under construction in February across the Midwestern U.S. markets we analyzed.
Southern Markets
Miami Tops Lease Rates & Sales; Texas Markets Lead Development
In the South, Miami; Austin, Texas; and Washington, D.C. topped the list in terms of asking rents. These were also the only Southern U.S. markets to see full-service equivalent listing rates averaging more than $40 per square foot in February.
At the opposite end of the ranking, office space in Orlando, Fla., had the lowest asking rent average in the region and was one of only two markets in this group to average less than $30 per square foot last month.
Meanwhile, a look at office sales showed that six of the Southern U.S. office markets we analyzed for this report recorded totals higher than $200 million last month. First, Miami had the highest year-to-date sales total as office transactions here amounted to $666 million last month. Next, Charlotte, N.C., office sales totaled $322 million last month, followed by Houston ($295 million) and office space in Washington, D.C. ($290 million).
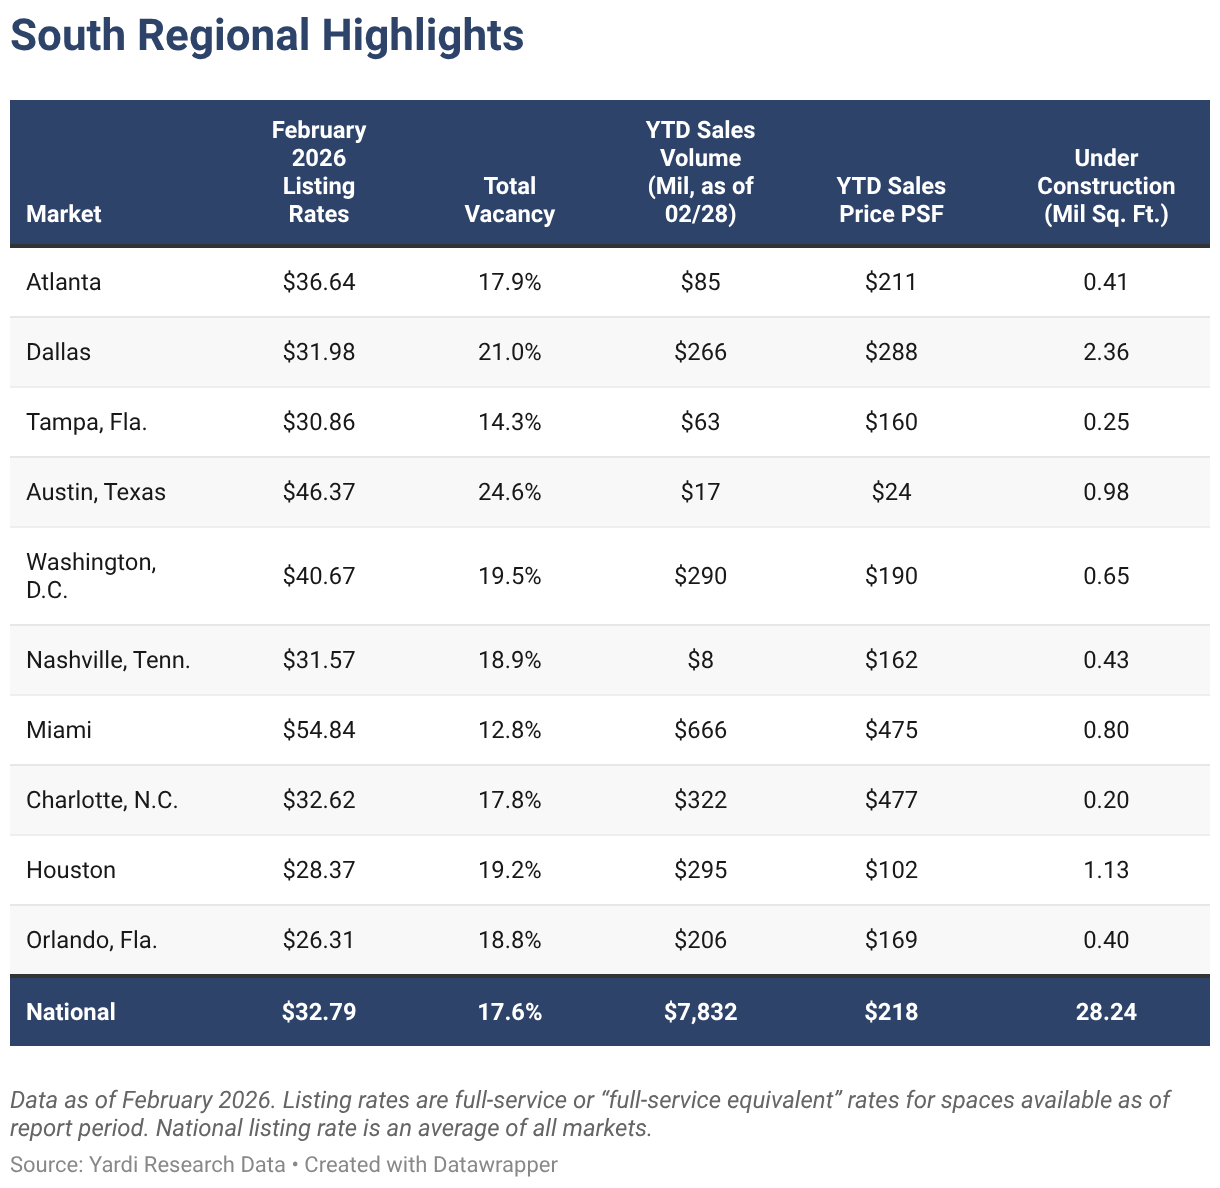
Then, looking at leasing data, office space in Miami had the highest average full-service equivalent listing rate in the region in February at nearly $55 per square foot. Next, office space in Austin, Texas, asked an average of about $46 per square foot, followed by Washington, D.C. — the only other market in this regional group to see lease rates average more than $40 per square foot last month.
One other market in the region also rested above the national average last month: Office space in Atlanta saw asking leasing rates approach $37 per square foot.
Notably, Texas’ Austin and Dallas had the highest vacancy rates in the region last month and were the only ones to exceed 20%. At the same time, Miami and Tampa, Fla., had the highest rates of occupancy and were the only Southern U.S. markets to see vacancy below the national average last month.
As for construction, data showed that Texas markets carried more than half of the office pipeline in the region: In February, nearly 2.4 million square feet of office space was in development in Dallas, roughly 1.1 million square feet was under construction in Houston, and Austin’s pipeline totaled close to 1 million square feet. Combined, these three Texas markets accounted for nearly 59% of development in the region and roughly 16% of the national pipeline.
Northeastern Markets
Development in NYC, Boston & New Jersey Comprises 30% of National Total; Manhattan, N.Y., Leads Sales Nationwide
In February, Manhattan, N.Y., had the highest average listing rate in the region at a little more than $73 per square foot. At the same time, asking rents for Philadelphia office space were roughly $31 per square foot, making it the only Northeastern U.S. office market to ask less than the national average of $32.79 per square foot last month.
Next, looking at construction, three of the four largest office markets in the Northeast had more than 1 million square feet of new office space in development. Together, they accounted for about 27% of the national pipeline last month.
Boston led supply in the region as office projects in development here totaled nearly 3.9 million square feet. Next, the Manhattan, N.Y., office space pipeline was the second-largest in the region last month with more than 2.7 million square feet under construction. With that, these two Northeastern U.S. markets accounted for about 23% of the country’s total pipeline of approximately 28 million square feet last month.
Lastly, the New Jersey office space pipeline was the only other market in the region to exceed 1 million square feet in February.
Nearby, an analysis of office sales showed that transactions in Manhattan, N.Y., amounted to more than $1.6 billion — the largest sales total since the start of the year in both the region and the country. Boston sales picked up to surpass $200 million by the end of February, while transaction activity in each of the other large markets in the region added up to less than $100 million in year-to-date office sales.

Office-Using Employment
Nashville, Tenn., Sees Positive Recovery in Office-Using Employment
According to Bureau of Labor Statistics data, office-using sectors of the labor market lost a combined 6,000 jobs in February. Specifically, the business services and information sectors lost a combined 16,000 jobs, while the financial sector gained 10,000. Year-over-year, office-using sectors saw a 0.5% decrease, which added up to roughly 185,000 jobs nationally. During that same time, total non-farm employment recorded a 0.1% increase.
Among the top 25 metros we analyzed for this report, seven are experiencing positive year-over-year office employment growth. For instance, Nashville, Tenn., has seen a turnaround after going from a low of -2.3% in January 2025 to 1.3% by the end of the year. Plus, with several major corporations moving into the area recently, Nashville had the fifth-best recovery at the close of 2025, ahead of both Chicago and Boston.

Methodology
This report covers office buildings that are 25,000 square feet or larger. Listing rate and occupancy information was based on Yardi Research data.
Listing rates are full-service rates or “full-service equivalent” for spaces that were available as of the report period.
Vacancy refers to the total square feet vacant in a market (including subleases) divided by the total square feet of office space in that market. Owner-occupied buildings are not included in vacancy calculations. For reporting purposes, A and A+/trophy buildings were combined.
Stages of the supply pipeline:
Planned — Buildings that are currently in the process of acquiring zoning approval and permits, but have not yet begun construction.
Under Construction — Buildings for which construction and excavation has begun.
Office-Using Employment is defined by the Bureau of Labor Statistics as including the sectors Information, Financial Activities, and Professional and Business Services. Employment numbers are representative of the metropolitan statistical area and do not necessarily align exactly with CommercialCafe market boundaries.
Sales volume and price-per-square-foot calculations for portfolio transactions or those with unpublished dollar values were estimated using sales comps based on sales that were similar in terms of the market and submarket; use type; location and asset ratings; sale date; and property size.
Market boundaries in the CommercialCafe office report coincide with markets defined in the CommercialCafe Markets Map and may differ from regional boundaries defined by other sources.
Fair Use & Redistribution
We encourage and freely grant you permission to reuse, host, or repost the research, graphics, and images presented in this article. When doing so, we kindly ask that you credit our research by linking to CommercialCafe.com or this page so that your readers can learn more about this project, the research behind it, and its methodology. For more in-depth, customized data, please contact us at [email protected].


Ioana Ginsac
Senior Content Writer, Industry News & Reports
Ioana is a content writer who has been covering all-things-CRE (and more) for several Yardi network publications since 2017. You will find her byline regularly in industry news and market reports, but also on articles covering sustainable development, green urbanism, and innovation, all of which she has been passionately learning about for more than a decade. Her work has been referenced by publications including AmericanInno, Bisnow, BusinessInsider, Commercial Property Executive, Curbed, Fast Company, Forbes, GlobeSt.