Top Markets’ YTD Office Sales & Construction Starts Inch Up From 2024


Key Takeaways:
- The national office vacancy rate was 18.6% in September, following another dip of 80 basis points year-over-year.
- The national office listing rate averaged $32.79 per square foot in September, which marked a 0.3% slip from the previous year.
- The office supply pipeline remained modest at the start of October with a little more than 38 million square feet of office space currently under construction.
- Manhattan, N.Y., topped the list for YTD sales through September in terms of dollar volume ($5.5 billion), followed by the Bay Area ($4.3 billion) and Washington, D.C. ($3.2 billion)
- Miami and Manhattan tied for the lowest vacancy rates in September, each averaging close to 13%.
- Office asking rates in most Southern U.S. markets were close to the national average, while Midwestern markets remained among the most affordable.
- The Boston office pipeline remained the most active with nearly 4.5 million square feet of new office space under construction.
Trends & Industry News
Sales & Construction Starts Tick Up, Coworking Slowly Gaining Ground
According to Yardi Research data, Q3 kicked off with year-to-date office sales surpassing the levels recorded during the first nine months of 2022. Specifically, tenants and investors alike continue to direct their attention to modern office space in desirable locations. This focus on quality then drives robust leasing and sales activity in well-positioned markets.
Data also shows an optimistic outlook with office construction starts in 2025 expected to exceed the previous year’s totals. Plus, unmet demand for highly amenitized assets in key markets continues to push projects forward, despite vacancy rates still appearing uncomfortably high.
“We anticipate an uptick in new, best-in-class office construction to meet the demand for premier spaces. The expectation is these will be smaller ‘jewel box’ buildings rather than the trophy towers of the past. Notably, New York City is the main exclusion of this apparent trend.”
Peter Kolaczynski, Director, Yardi Research
At the same time, the continued importance of flexibility sustains the growing relevance of the coworking segment, which continues to steadily increase its share of the U.S. office market.
As such, operators large and small that are looking for opportunities to expand networks and partnerships are likely to come up with more attractive alternatives to costly, long-term office leases that can meet the needs of up-and-coming companies, as well as large corporations that are looking for ways to make hybrid work models succeed for them.
Listing Rates & Vacancy
Nashville Set to Absorb Excess Supply Following Vacancy Climb
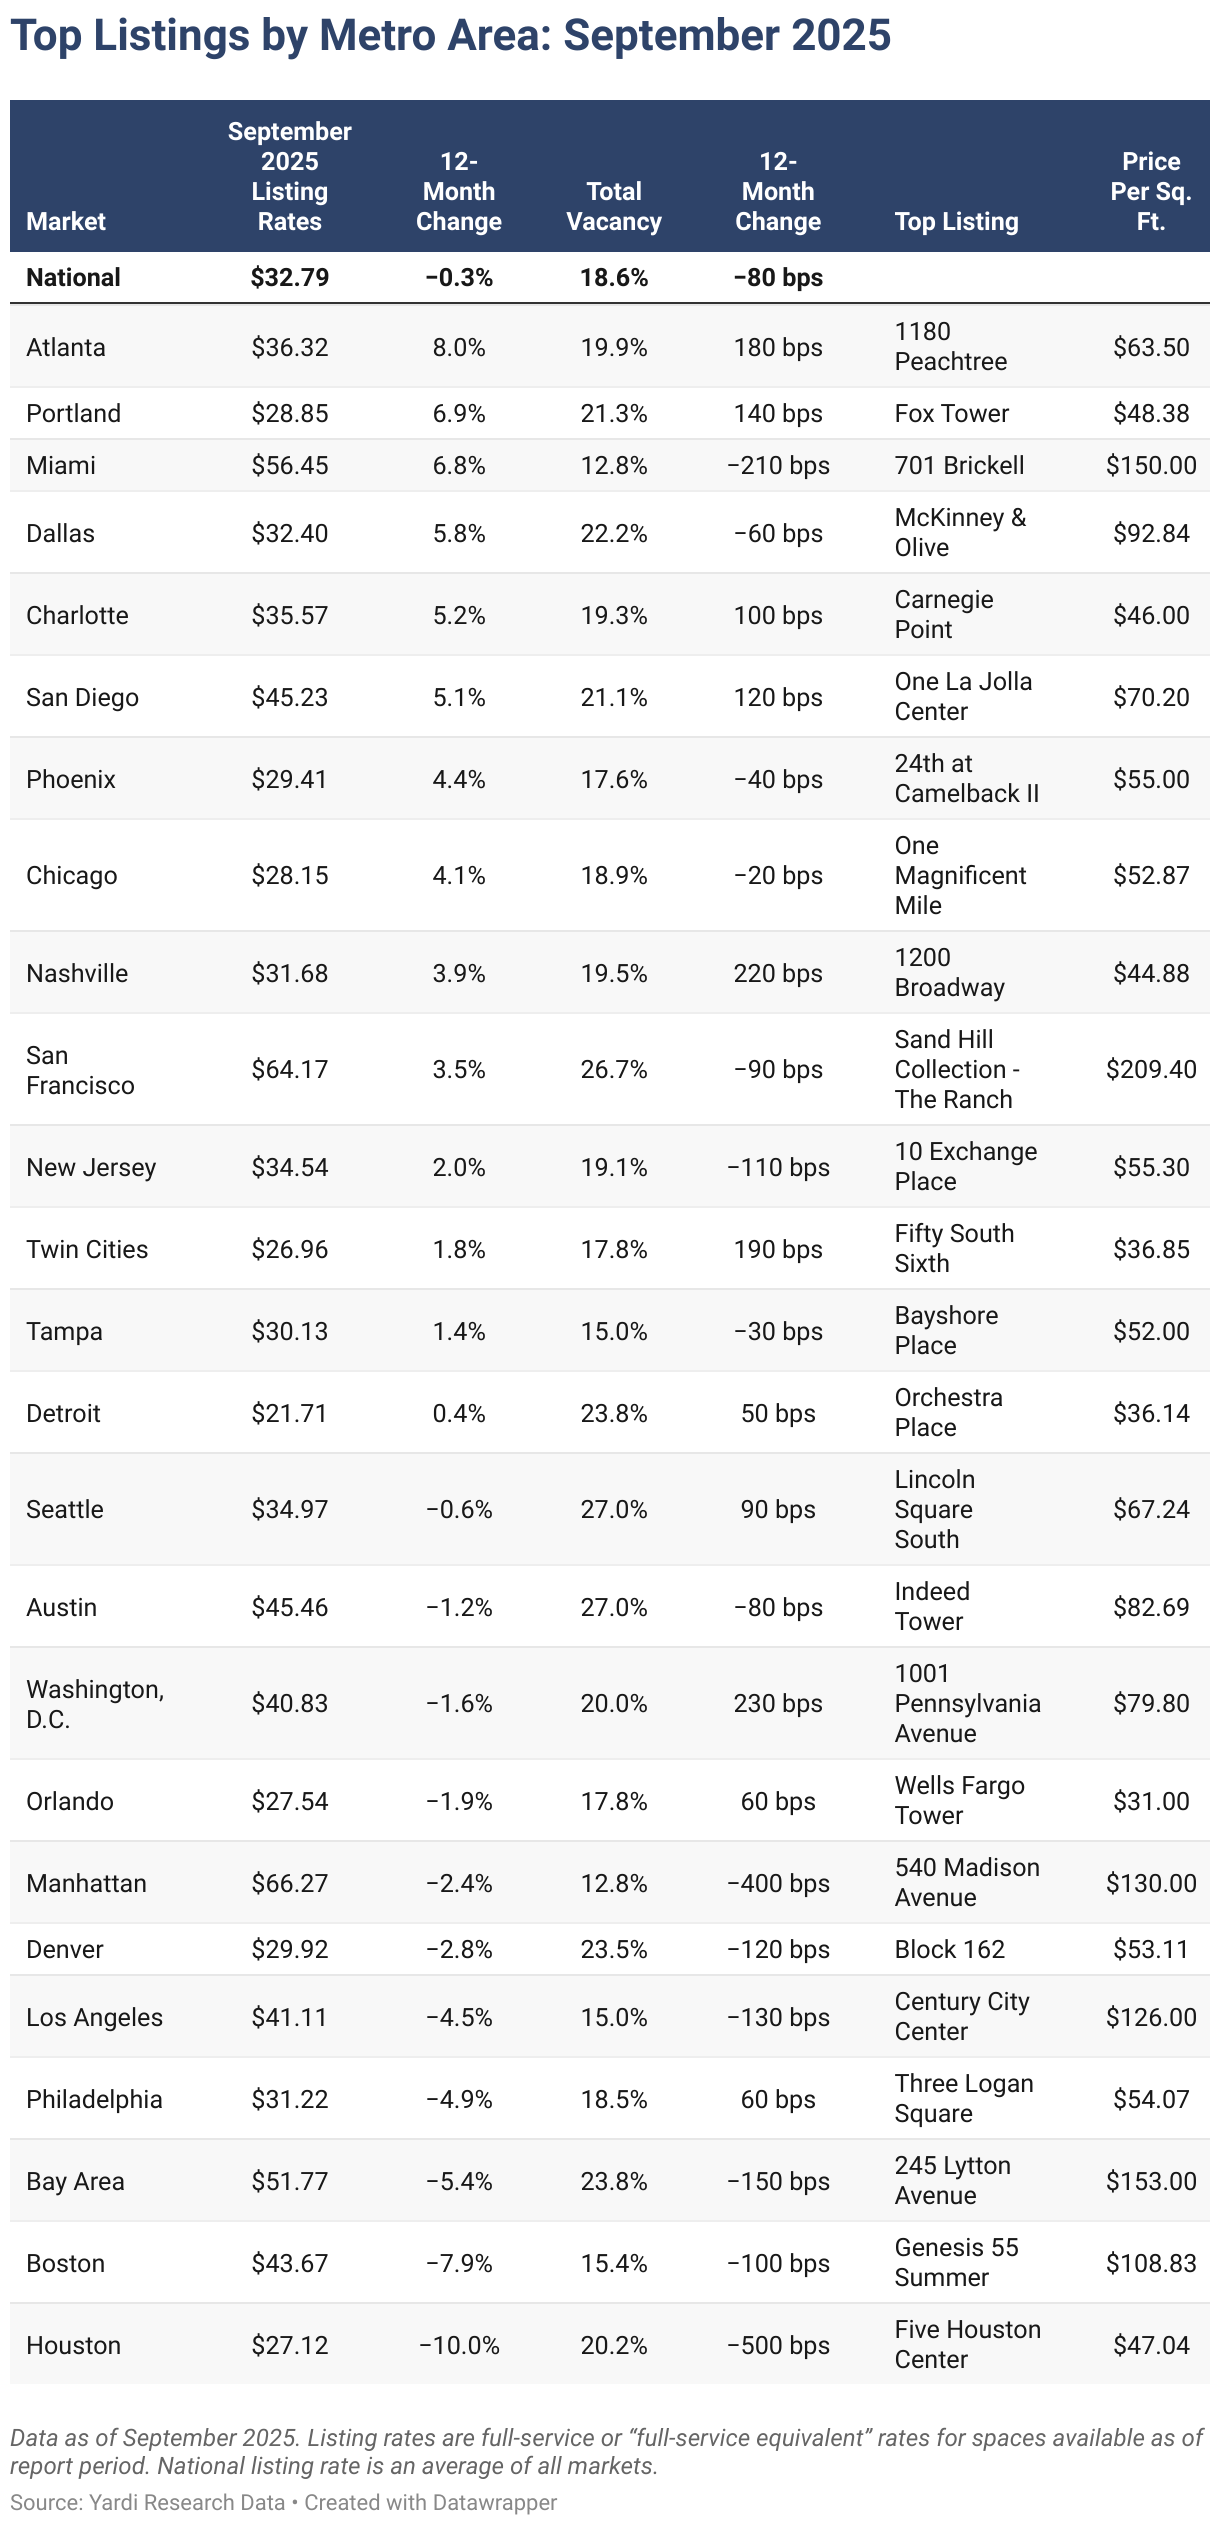
The national average full-service equivalent listing rate for office space was $32.79 per square foot in September, which followed a slight correction of -0.3% year-over-year (Y-o-Y). Meanwhile, the national vacancy rate dipped 80 basis points (bps) compared to the previous year to reach 18.6% last month.
Among the top markets analyzed for this report, Miami had the lowest vacancy rate last month. Following a decrease of 210 bps Y-o-Y, vacancy in the Florida office market dipped slightly below 13%.
Conversely, Nashville, Tenn., had the largest vacancy rate increase — up 220 bps Y-o-Y to reach 19.5% in September. Notably, this comes at the tail end of a supply boom in the market, which delivered 8.7 million square feet this decade, including 1.4 million square feet this year (14.2% of stock). Now, with less than 300,000 square feet of Nashville office space currently under construction and not much in the planning stages, the market has an opportunity to absorb excess supply in coming quarters.
Transactions
YTD Office Sales Approach $40 Billion, Big Tech-Leased Property Appeal Boosts Seattle Sale Prices
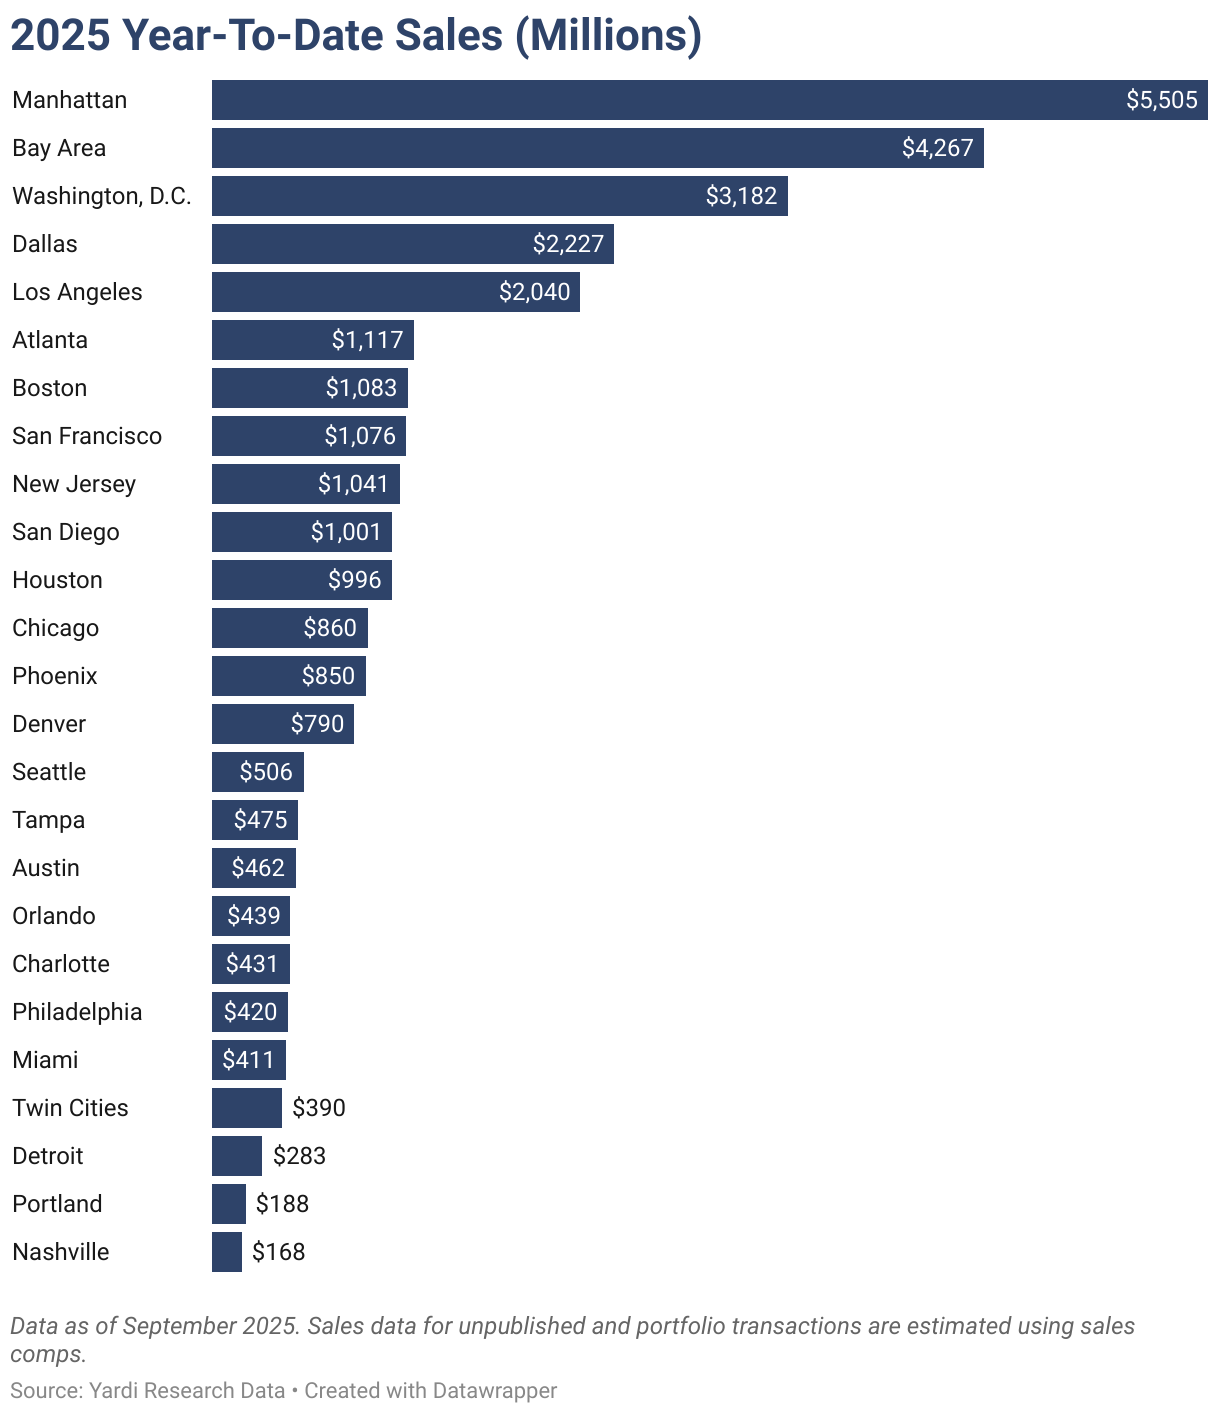
In September, year-to-date office sales reached nearly $38 billion. Tracked across nearly 2,000 total transactions, this volume was the largest year-to-date total through September since 2022. Additionally, office properties transacted so far this year changed hands for an average of $195 per square foot.
Seattle’s average sale price of office space reached $258 per square foot in 2025, which made Q3 the market’s priciest quarter since early 2022. Here, modern office properties attracted investor interest and pushed up sale prices through standout transactions.
One such example is the sale of One Esterra Park, which was acquired in one of the region’s largest office sales in recent years. Preylock Real Estate Holdings paid Capstone Partners $225 million for the LEED Platinum-certified property. Completed in 2021, the office asset is fully occupied by Microsoft with 11 years remaining on the current lease. The seven-story building is located just south of Microsoft’s headquarters and is part of the 28-acre Esterra Park mixed-use development, which also includes 2,600 apartments; a dual-branded Aloft and Element hotel; and a three-acre park.
However, this was just the latest of Preylock’s big tech office acquisitions in the Seattle area. The Los Angeles-based company also recently acquired an office leased by Amazon in Redmond Town Center, Meta-leased Willow Creek Corporate Center and T-Mobile’s headquarters in Bellevue, Wash.
Supply
Construction Starts Point to Uptick Since 2024
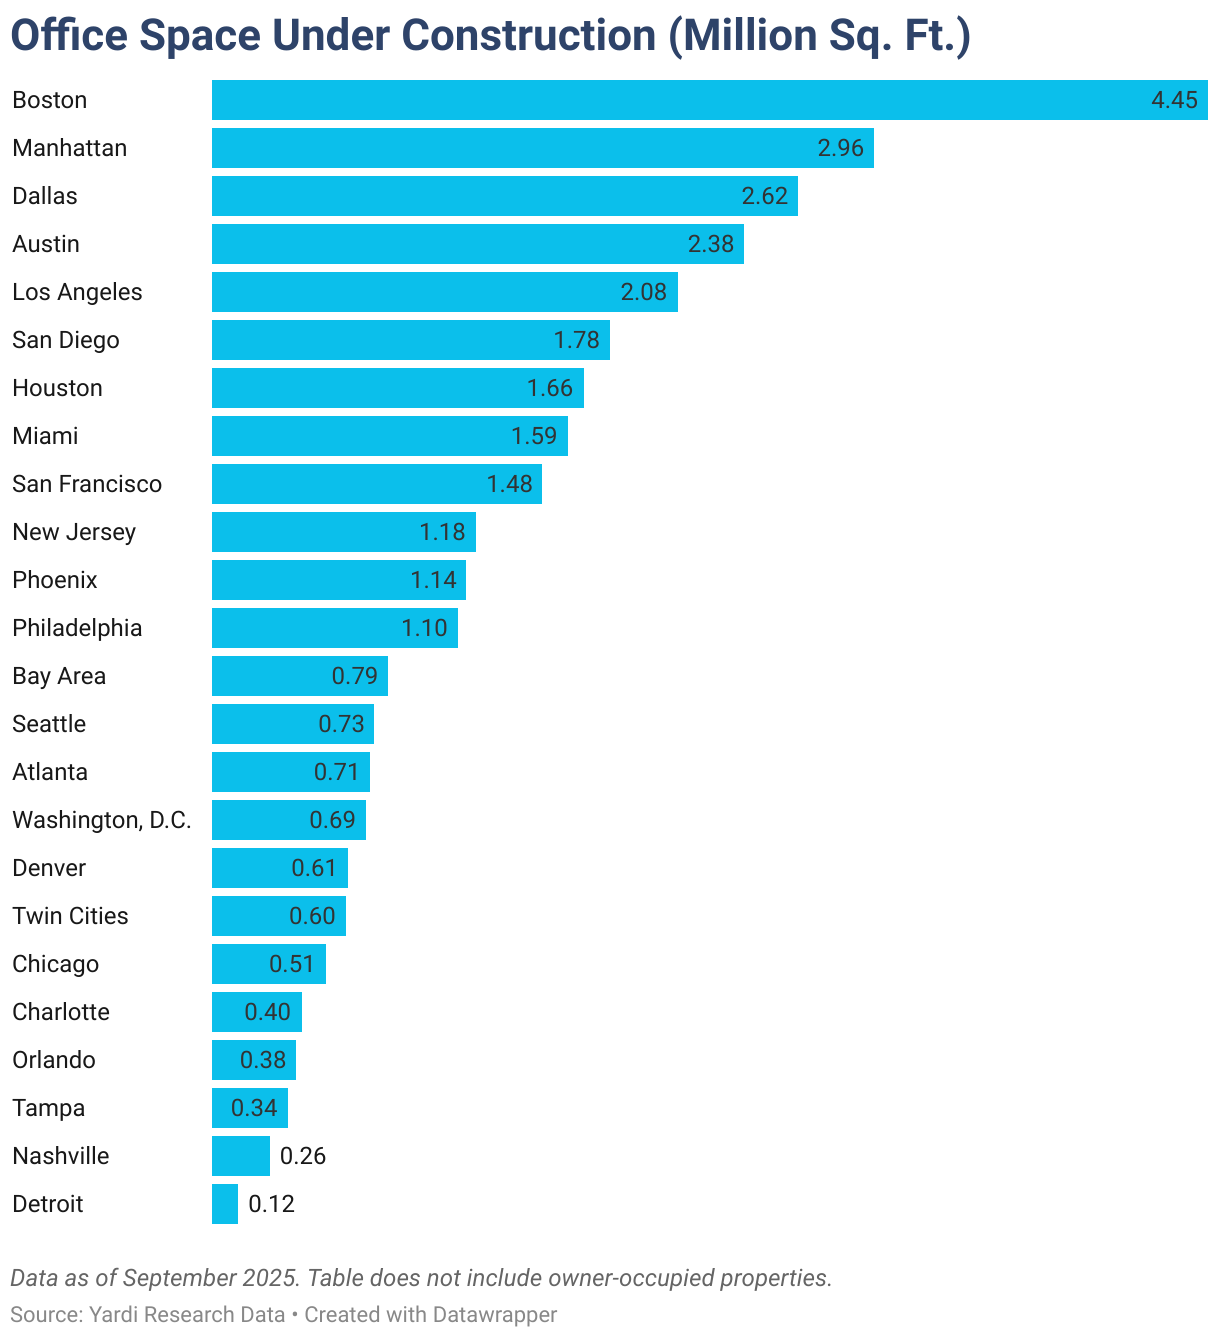
As of September, roughly 38 million square feet of office space was under construction across the major U.S. markets tracked for this report. Although this represented less than 1% of stock under construction as of September, it would add up to nearly 2% of stock if projects in the planning stages were also included.
But, even as 2024 marked a 10-year low for office completions in the U.S., Yardi Research estimates that the bottom has not yet been reached: Since the start of 2025, a little more than 19.1 million square feet of new office space was delivered nationally — and Yardi estimates even lower levels of new supply coming to market in future years.
That said, 2025 might wrap up with an uptick in construction starts compared to the previous year: Throughout 2024, there were 12.1 million square feet of starts, whereas 2025 has already seen 11.9 million square feet of starts through September.
What’s more, continuing demand for high-end, amenitized office space is driving new construction in desirable markets, despite vacancy rates still averaging in the double digits. One such example is Dallas-Fort Worth, where construction starts have surpassed 1 million square feet since the start of the year even though the market is seeing vacancy higher than 20%.
For example, the eight-story, mixed-use Van Zandt building in western Fort Worth, Texas, recently broke ground and promises to deliver more than 100,000 square feet of trophy-grade office space, in addition to retail and a residential component. These types of mixed-use projects are doing a good job of meeting shifting priorities among the upcoming generations of workers — namely, a better balance between work and personal life, as well as a tighter sense of community that is naturally sustained through the availability of green commuting, walkability, and shared recreation spaces.
Western Markets
Seattle Tops Vacancy, San Francisco Asks Highest Rents, Phoenix Ramps Up Development
Vacancy rates were above the national average of 18.6% in the majority of the Western U.S. markets we surveyed for this U.S. office markets report. In this case, Seattle office space saw the highest vacancy rate in the region with about 27% of space unoccupied at the close of September. Then, San Francisco was second in the region with vacancy reaching 26.7% last month.
Supported by Silicon Valley and the wider suburban tech ecosystem, the northern California market topped the regional list for rents with office space in San Francisco asking a little more than $64 per square foot in September — nearly double the national average of $32.79. Nearby, Bay Area office space remained the second-priciest in the region last month. Here, asking rates averaged nearly $52 per square foot — the only other Western U.S. market where rates surpassed the $50 mark.
Not to be outdone, San Diego (at #3 with asking rents averaging roughly $45 per square foot) and Los Angeles (#4 at $41 per square foot) closed out the block of California markets at the top of the list.
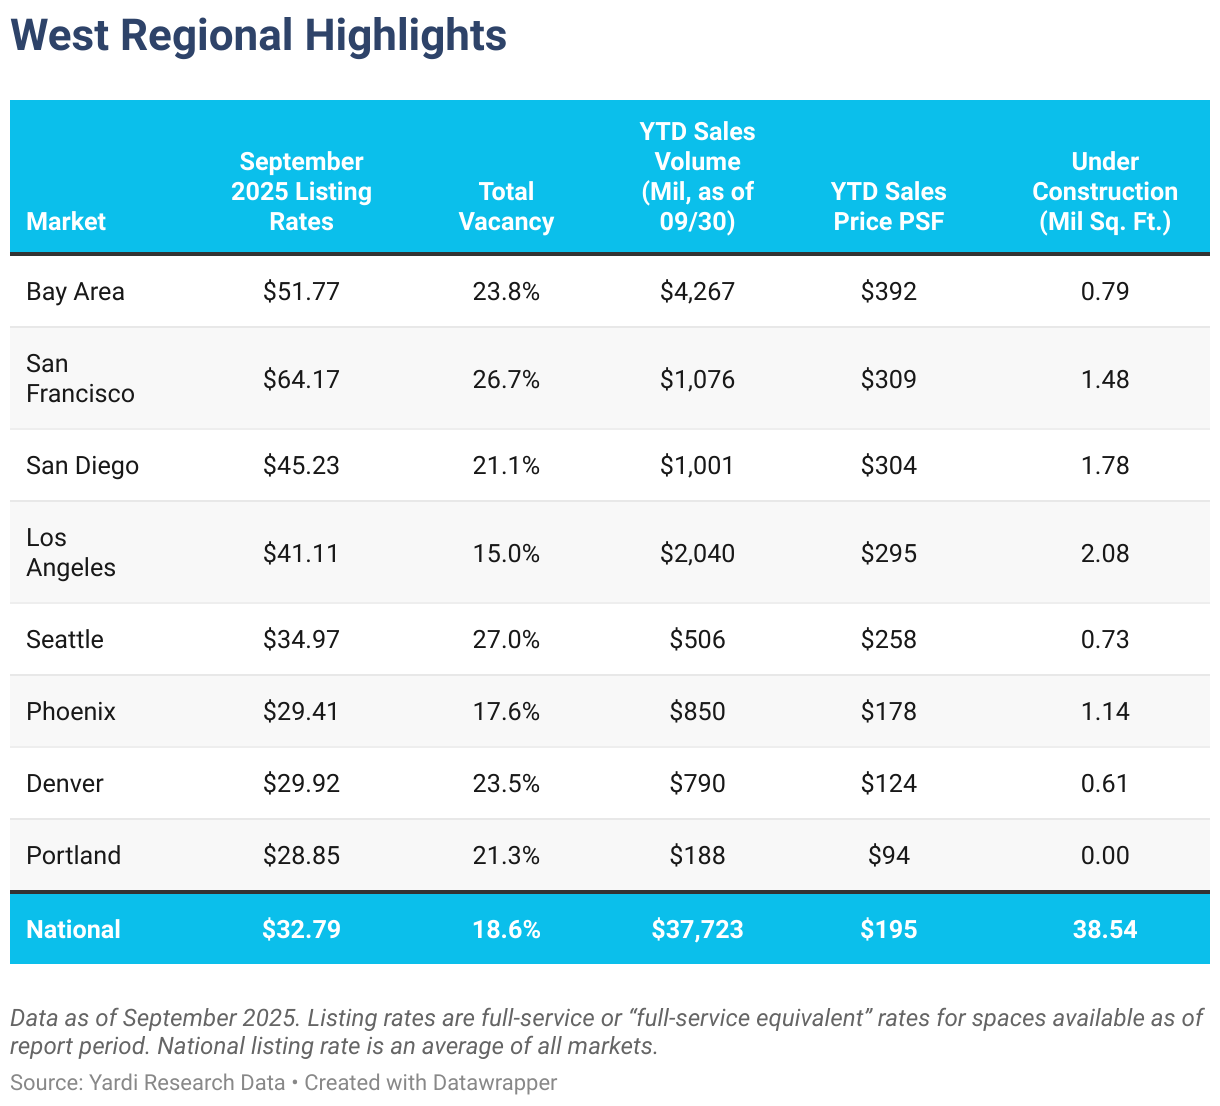
Otherwise, Portland, Ore.; Phoenix; and Denver remained the only large markets in the region where office asking rates rested below the national average in September, each modestly below $30 per square foot.
Then, looking at total market office sales in the region, the top position was taken by the Bay Area, where transactions since the start of the year amounted to nearly $4.3 billion. Further south, Los Angeles office space followed in second place with a little more than $2 billion in 2025 sales through September. San Francisco and San Diego were the only other markets in the region to see year-to-date sales above the $1-billion mark last month.
During that same time, the Bay Area also stood out for sale prices: Office space here commanded the highest average sale price per square foot in the Western U.S. so far this year ($392). Once again, San Francisco ($309 per square foot) and San Diego ($304) were the only other markets in the region where office sales closed for more than $300 per square foot, on average.
California markets also led the region in terms of development last month. More precisely, Los Angeles had 2.1 million square feet under construction, San Diego had 1.8 million square feet and San Francisco had 1.5 million.
That said, they were no longer the only markets in this group with more than 1 million square feet of new office space in the pipeline. At the start of October, there was also a little more than 1.1 million square feet of Phoenix office space under construction.
Midwestern Markets
Chicago Tops YTD Office Sales in Region, Twin Cities Vacancy Remains Below National Average
The top Midwestern U.S. office markets we analyzed remained some of the most affordable in the country in September, both in terms of average listing rate and for-sale price per square foot.
Detroit office space was the most accessible in this region with asking rents averaging less than $22 per square foot. Not far behind, office space in the Twin Cities averaged $27 per square foot, following an uptick of nearly 2% Y-o-Y. Then, Chicago was the priciest in the region last month with asking rents averaging roughly $28 per square foot.
It’s worth noting here that the vacancy rates for office space in Chicago and Detroit were above the national average of 18.6% in September. Meanwhile, in Minnesota, occupancy levels in the Twin Cities last month kept vacancy in the market slightly below 18%.
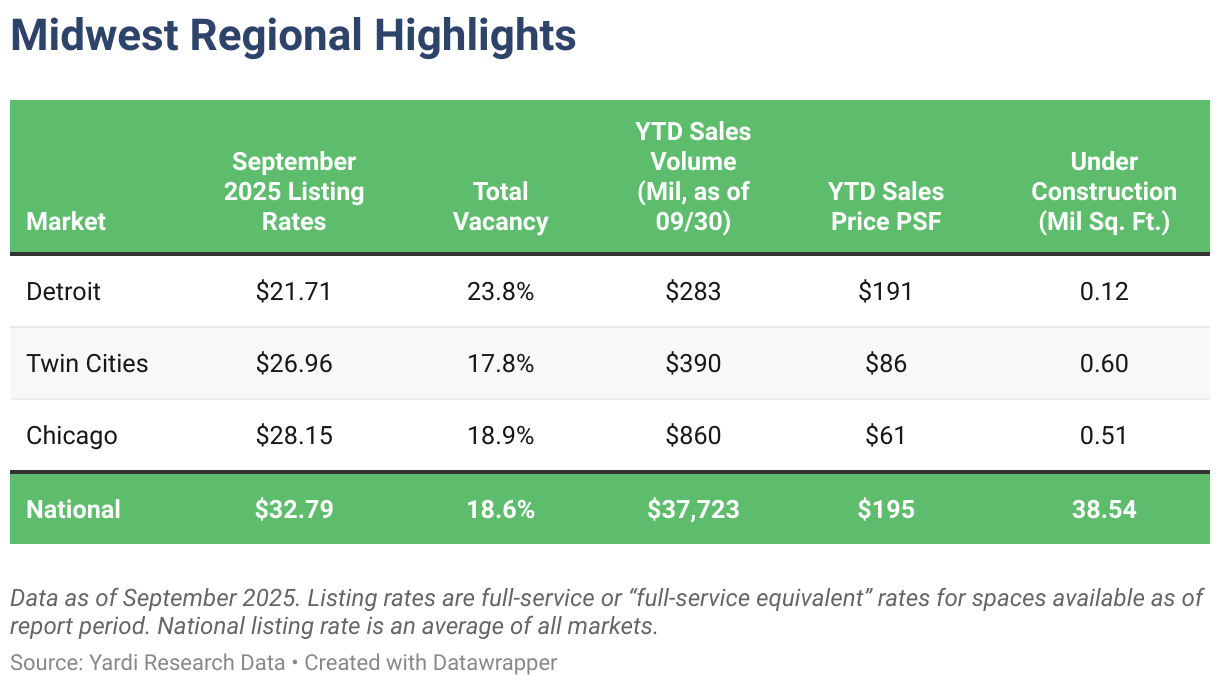
Of course, Chicago — the largest office market in the region — had the Midwest’s highest year-to-date office sales total in September. However, the $860 million worth of office space that sold here since the start of the year changed hands for the lowest price among top markets in the Midwest at an average of $61 per square foot — well below the national average of $190.
Furthermore, construction in the region continued to be comparatively muted at the end of September with just a little more than 1.2 million square feet of office space under construction across the Midwestern U.S. markets we analyzed.
Southern Markets
Miami Tops Asking Rates & Posts Lowest Vacancy as Washington, D.C. Shines in Sales
In the South, Miami; Austin, Texas; and Washington, D.C. led the region in terms of asking rents. They were also the only markets in the Southern U.S. to see full-service equivalent listing rates averaging above $40 per square foot in September. On the other end of the ranking, Houston and Orlando, Fla., were the most affordable in the region with asking rents here averaging less than $30 per square foot.
Notably, three of the Southern U.S. office markets we analyzed for this report recorded office sales in excess of $1 billion since the start of the year: Washington, D.C. had the highest year-to-date sales total as office transactions that closed in the capital amounted to nearly $3.2 billion through September. During that time, office space in Washington, D.C. changed hands for an average of $182 per square foot.
Additionally, Dallas office sales during the first nine months of the year added up to more than $2.2 billion. Since the start of 2025, Dallas office space changed hands for an average price of $296 per square foot. Lastly, office space in Atlanta traded for $147 per square foot with year-to-date sales here totaling roughly $1.1 billion through September.
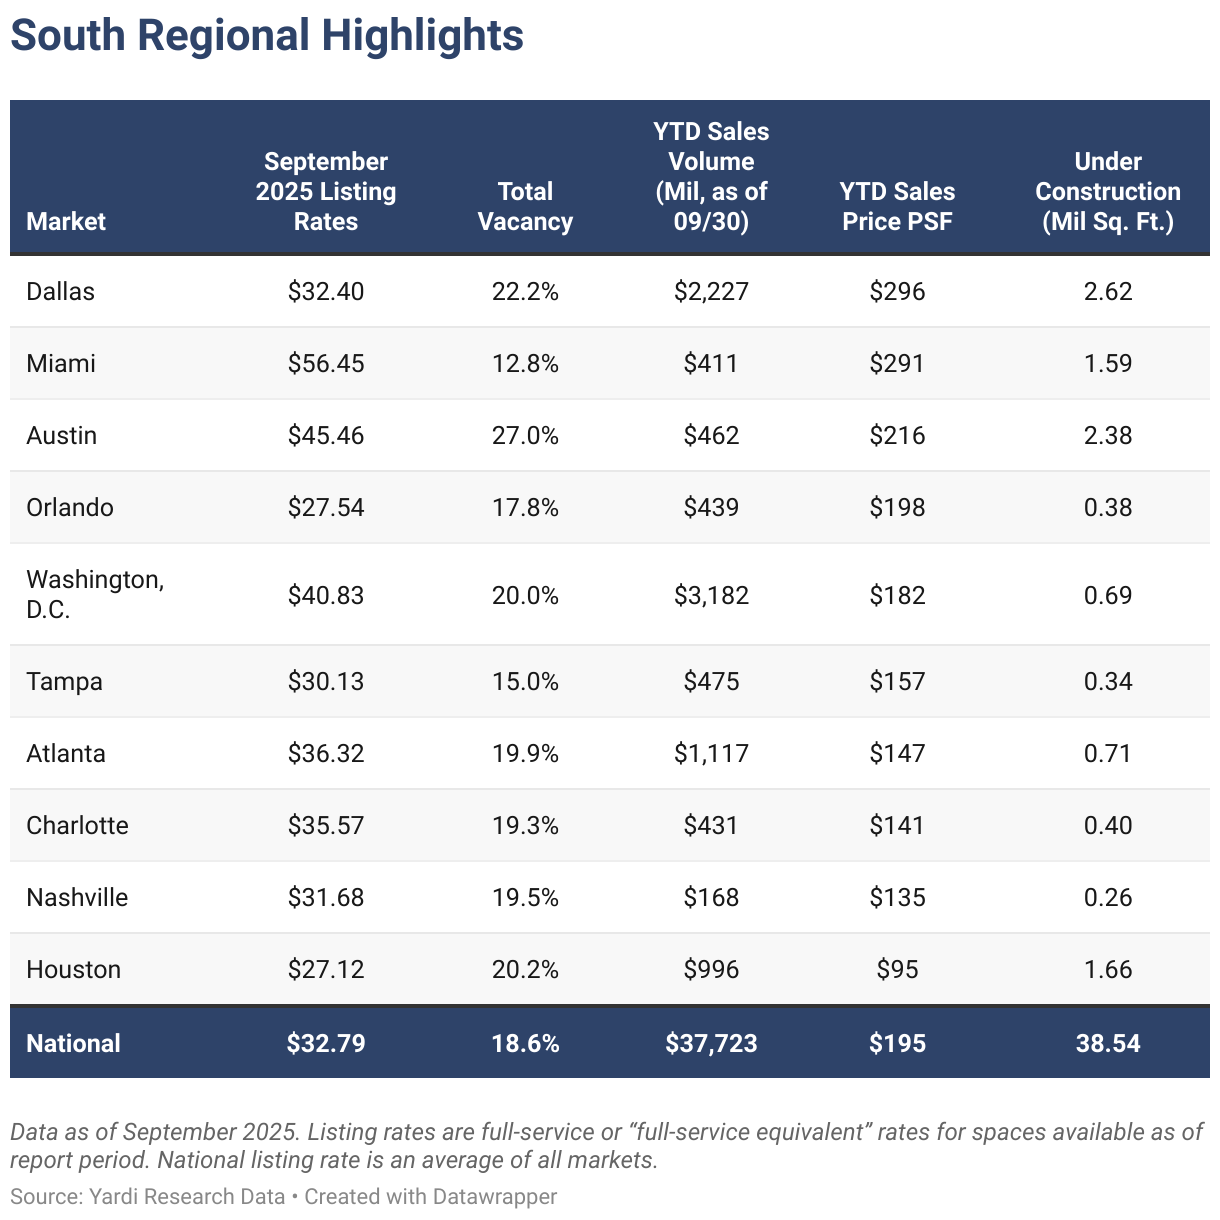
Looking at leasing data, the average full-service equivalent listing rate for office space in Miami was a little more than $56 per square foot — the priciest in the region this September. The Florida powerhouse also stood out for having the lowest office vacancy rate among the Southern U.S. markets we compared at a little less than 13% in September.
The only other markets in this regional group to see lease rates higher than $40 per square foot last month were Austin, Texas, and Washington, D.C. Austin office space asked an average of roughly $45 per square foot, while asking rates in Washington, D.C. averaged nearly $41 per square foot in September.
Austin also had the highest vacancy rate in the region last month (27%), followed by Dallas (22%), Houston (20.2%) and Washington, D.C. These were also the only metros among the Southern U.S. markets we analyzed to see vacancy above 20% in September.
Plus, data showed that Dallas, Austin, Houston, and Miami were carrying most of the office pipeline in the region: Last month, roughly 2.6 million square feet of office space was in development in Dallas, and nearly 2.4 million square feet was under construction in Austin. Not far behind, Houston and Miami each had roughly 1.6 million square feet of office space in development last month and were the only other markets in the region with more than 1 million square feet underway.
Northeastern Markets
Boston Builds Most Office Space, Manhattan Claims Top Dollar
In September, Boston remained in the lead for supply in the region as office projects in development here totaled nearly 4.5 million square feet last month. Not to be outdone, the Manhattan, N.Y., office space pipeline was the second-largest in the region last month with almost 3 million square feet under construction. Together, these two Northeastern U.S. markets accounted for nearly 19% of the national pipeline, totaling roughly 38.5 million square feet in September.
Interestingly, when considering office sales, the two largest markets in the region swapped positions in the ranking: Office sales that closed in Manhattan since the start of the year added up to more than $5.5 billion through September, which was the largest sales total both in the region and in the country. During that time, office properties here traded for an average of $530 per square foot, which was more than double the national average of $195 per square foot and placed the New York market comfortably ahead of the rest for priciest office market in the country.
At quite a distance, Boston had the second-largest year-to-date sales total in the Northeastern U.S. region as transactions here added up to nearly $1.1 billion since the start of the year. Boston office space sold during that time changed hands for an average of $153 per square foot to rank third regionally.
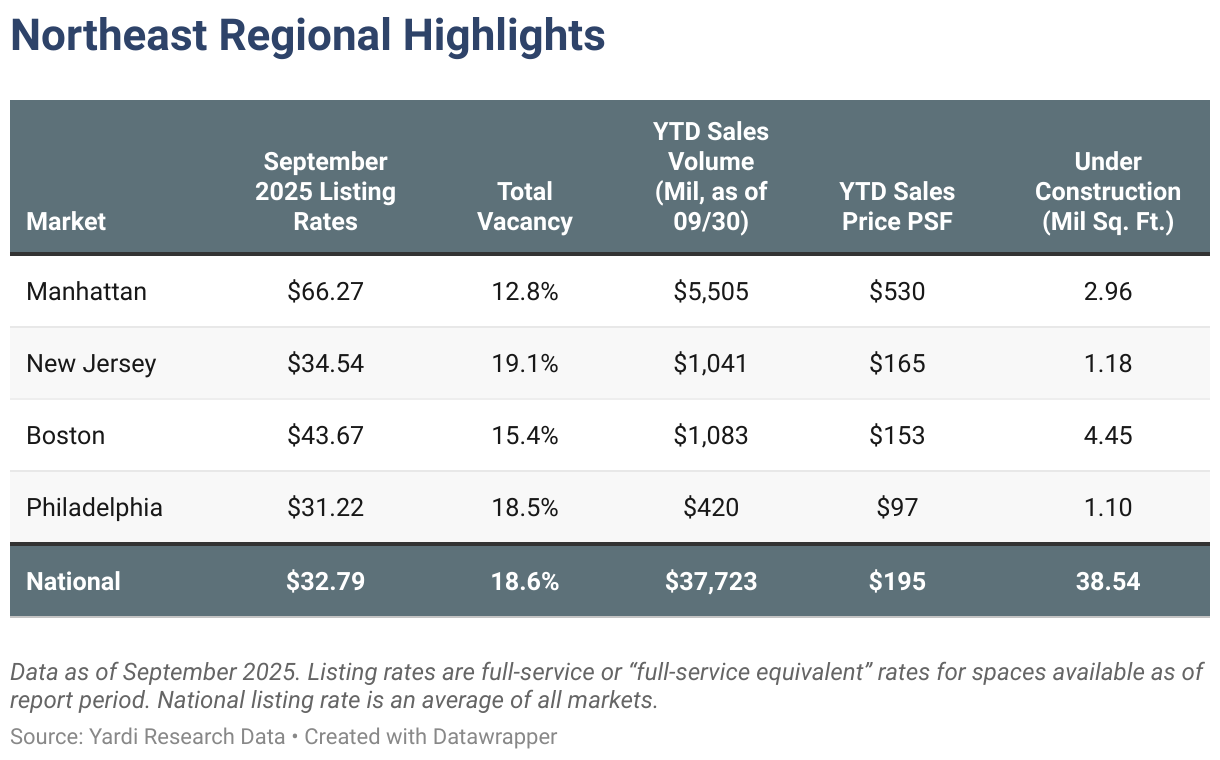
Moreover, in most of the Northeastern U.S. markets we tracked, vacancy was below the national average of 18.6% in September. New Jersey was the only one to average slightly above that value, closing last month at 19.1%.
And, as is to be expected, Manhattan asked the highest listing rates both in the region and nationwide at roughly $66 per square foot. Next, Boston was the second-priciest listing market in the Northeast with asking rates here averaging nearly $44 per square foot in September. At the same time, asking rents for Philadelphia office space rested at roughly $31 per square foot — the only office market in the region to ask less than the national average of $32.79 per square foot.
Office-Using Employment
Philadelphia Talent Pool Sustains Growth
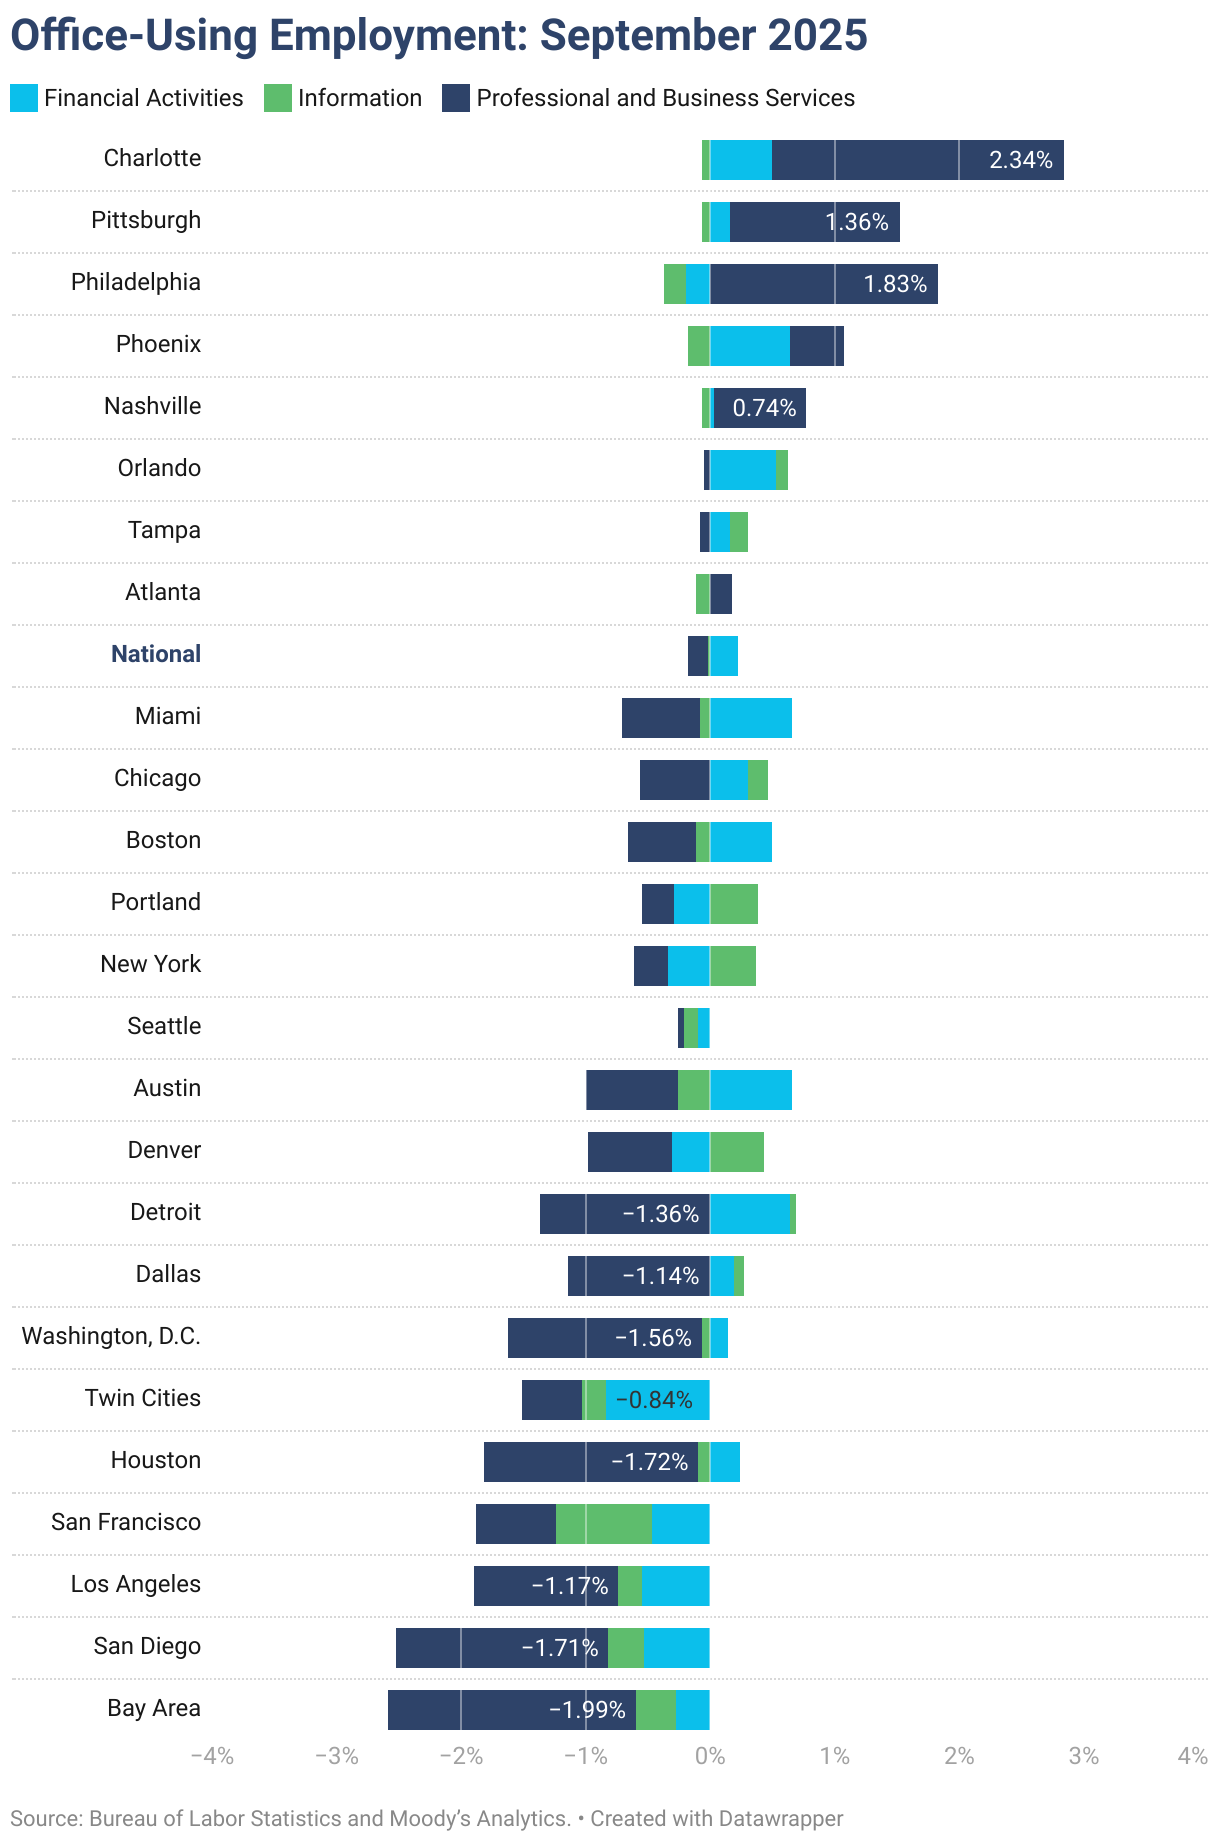
According to Yardi Research analysis of private sector data sources, office-using employment sectors recorded a modest 0.7% increase year-over-year last month. However, Automatic Data Processing, Inc. estimates found that even as the Information sector gained 3,000 jobs last month, there was a combined loss of 19,000 jobs in the month of September, led by the Professional and Business Services sector, as well as the Financial Activities sector.
As a matter of fact, Bureau of Labor Statistics data at the metropolitan level showed that 17 of the top 25 markets saw year-over-year decreases in jobs as of August. Among the few large markets where that was not the case, Charlotte, N.C., and Philadelphia showed the largest gains: Professional and Business Services accounted for a 1.5% employment growth in Philadelphia, which led major U.S. cities with the largest increase in bachelor’s degree-holders from 2020 to 2021. Its 155% rise translated to a large pool of professional talent that firms can tap into.
Methodology
This report covers office buildings that are 25,000 square feet or larger. Listing rate and occupancy information was based on Yardi Research data.
Listing rates are full-service rates or “full-service equivalent” for spaces that were available as of the report period.
Vacancy refers to the total square feet vacant in a market (including subleases) divided by the total square feet of office space in that market. Owner-occupied buildings are not included in vacancy calculations. For reporting purposes, A and A+/trophy buildings were combined.
Stages of the supply pipeline:
Planned — Buildings that are currently in the process of acquiring zoning approval and permits, but have not yet begun construction.
Under Construction — Buildings for which construction and excavation has begun.
Office-Using Employment is defined by the Bureau of Labor Statistics as including the sectors Information, Financial Activities, and Professional and Business Services. Employment numbers are representative of the Metropolitan Statistical Area and do not necessarily align exactly with CommercialCafe market boundaries.
Sales volume and price-per-square-foot calculations for portfolio transactions or those with unpublished dollar values were estimated using sales comps based on sales that were similar in terms of the market and submarket; use type; location and asset ratings; sale date; and property size.
Market boundaries in the CommercialCafe office report coincide with markets defined in the CommercialCafe Markets Map and may differ from regional boundaries defined by other sources.
Fair Use & Redistribution
We encourage and freely grant you permission to reuse, host, or repost the research, graphics, and images presented in this article. When doing so, we kindly ask that you credit our research by linking to CommercialCafe.com or this page so that your readers can learn more about this project, the research behind it, and its methodology. For more in-depth, customized data, please contact us at [email protected].



Ioana Ginsac
Senior Content Writer, Industry News & Reports
Ioana is a content writer who has been covering all-things-CRE (and more) for several Yardi network publications since 2017. You will find her byline regularly in industry news and market reports, but also on articles covering sustainable development, green urbanism, and innovation, all of which she has been passionately learning about for more than a decade. Her work has been referenced by publications including AmericanInno, Bisnow, BusinessInsider, Commercial Property Executive, Curbed, Fast Company, Forbes, GlobeSt.