Shrinking Pipeline Makes Room for Over-Supplied Markets to Increase Absorption in Following Years


Key Takeaways:
- In September, the national office vacancy rate was 17.8% following a decrease of 80 basis points (bps) year-over-year (Y-o-Y).
- The national office listing rate averaged $33.18 per square foot last month, which was 1.2% higher than values recorded in September 2025.
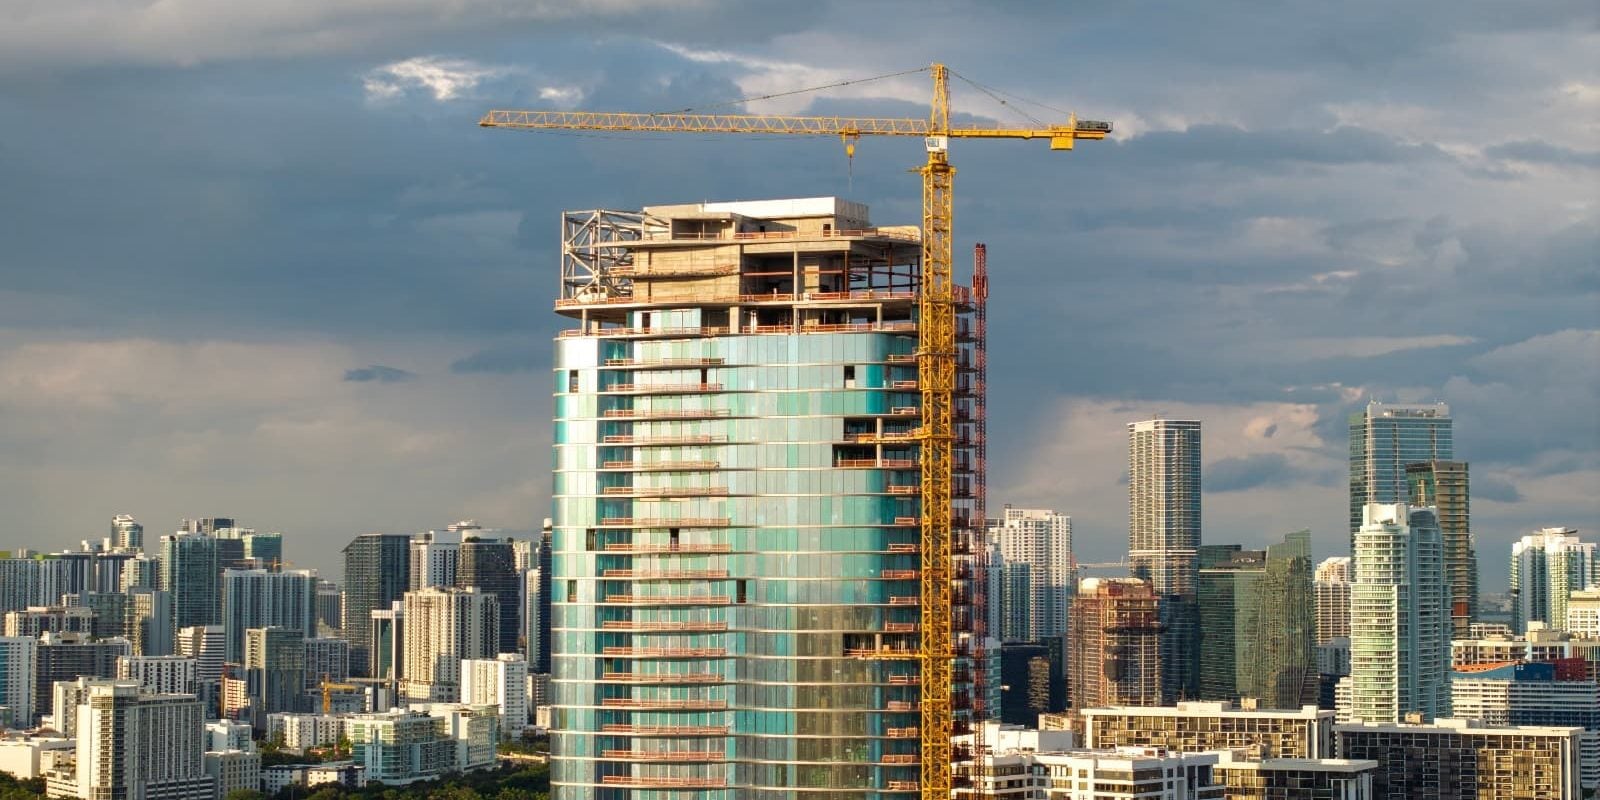
- Nationally, the office supply pipeline had nearly 32.2 million square feet of office space under construction last month.
- With more than $5.7 billion in deals closed since the start of the year, Manhattan, N.Y., topped the list for sales. It was followed by California’s Bay Area ($4.6 billion), as well as Dallas ($3.7 billion), and San Francisco ($3.2 billion) as the only other markets to exceed $3 billion in year-to-date sales.
- Among the seven large U.S. office markets where vacancy was below the national average, Manhattan, N.Y.; Miami; and Los Angeles averaged the lowest vacancy rates in September — the only markets to see vacancy average below 15% last month.
- Last month, the Western and Northeastern U.S. regions were home to most of the markets where leasing rates were above the national average, while Southern and Midwestern U.S. regions accounted for the majority of markets with asking rates below the national average.
- Manhattan, N.Y., and Dallas had the most active construction pipelines. Last month, they were the only markets where more than 3 million square feet of new office space was in development. In total, they accounted for more than 21% of the national pipeline total in September.
Trends & Industry News
Slow Construction Expected to Offset Slow Demand
Although the office sector has experienced some stabilization in the last few years, significant challenges persist. While declining office employment and instability in the economy still challenge the sector’s ability to sustain growth in terms of demand, the shrinking development pipeline is helping correct market fundamentals in the desired direction.
Listing rate performance has also varied by property quality with data showing that demand appears to concentrate at both ends of the property class spectrum: Class A listing rates increased 3.1% Y-o-Y to $40.62 per square foot in September, while Class B rates decreased 1.8% to $27.07. Class C properties saw 3.2% growth to reach an average of $19.63 per square foot.
With the office supply pipeline having slowed significantly in recent years and completions expected to bottom out in 2027 at around 26 million square feet, an offset to slowing demand is expected to occur. Although future performance will likely vary across markets (depending on local supply-demand dynamics), most remaining development is concentrated in class A office properties, which should contribute greatly to aligning future supply with the segment where demand continues to be strongest and listing rates are rising.
“With the significant reduction in office deliveries during the last four or so years, there’s a void of best-in-class office offerings and an opportunity to fill this need with fully amenitized, class A+ space in prime locations. While the interest in the very top of the market is still there, this is a small percentage of overall space with the bulk of Class B space still facing significant demand obstacles.”
Peter Kolaczynski, Director, Yardi Research
Listing Rates & Vacancy
San Diego Sees Some Light Through the Struggle With Excess Supply
The national average full-service equivalent listing rate for office space was $33.18 per square foot last month after an increase of 1.2% Y-o-Y. At the same time, the national vacancy rate dropped 80 bps compared to the previous year to rest at 17.8% at the close of September.
Notably, of the 25 largest markets that we analyzed, 17 saw decreases in their respective vacancy rates when compared to September of last year. At the higher end of the spectrum, eight of the top markets we surveyed were struggling with office vacancy above 20%.
The highest rate was in San Francisco, where vacancy averaged 26.7% last month — a rate that was virtually unchanged from September the year before. Conversely, the lowest vacancy rate among the top 25 U.S. metros was in Manhattan, N.Y. Marking a 260-bps Y-o-Y drop, office vacancy here was a little more than 10% last month.
Back in California, the San Diego office market remains under pressure from excess supply that was delivered during the COVID-driven life sciences real estate boom. Here, listing rates declined 4.3% Y-o-Y to reach $43.27 per square foot last month, while vacancy rose 140 bps to 23.7%.
The market added nearly 3 million square feet of office space in 2024, which was equivalent to 2.7% of inventory and represented the highest delivery rate in the country that year.
Meanwhile, construction activity has begun to slow, and future deliveries are expected to decline significantly through 2030, which should give the market some much-needed breathing (and absorption) room. As new supply declines, the rise in vacancy rates should also begin to settle, reducing downward pressure on listing rates over time.

Transactions
Houston Office Sale Prices Point to Recovery
In September, year-to-date office sales added up to more than $50.5 billion across 2,272 transactions, while sale prices averaged $197 per square foot. What’s more, a total of 13 of the top 25 metros we analyzed for this report saw overall sales in excess $1 billion each in year-to-date sales.
Houston was one of these markets with year-to-date sales here adding up to a little more than $2 billion through September. Notably, following several years of decline, the office sale price per square foot here rose to $149 in 2026.
While Houston’s average sale price is still 33% lower than its $223 price per square foot in 2019, the recent uptick does encourage optimism of recovery for the market. And, while a significant portion of office transactions across the country still see properties trading at a discount from their previous sale, some discount deal values in Houston made a splash.
One such example is the 1.5-million-square-foot Williams Tower, which changed hands in July for $300 million. Although the Class A office tower at 2800 Post Oak Blvd. went for significantly less than the $412 million price tag it commanded in its previous sale, the transaction closed this year was, at the time, reportedly the largest single-property office sale in Houston since 2019.

Supply
Manhattan, N.Y., Construction Driven by Strong, Class A Office Demand
As of September, nearly 32.2 million square feet of office space — representing 0.5% of stock — was under construction in the U.S. markets we tracked for this report. Looking at individual market pipelines, two of the 25 markets we analyzed had more than 3 million square feet each in development last month — Manhattan, N.Y., and Dallas.
Boston followed very closely in third place with 2.98 million square feet in development at the close of September. Otherwise, Miami (2.37 million square feet in the pipeline), San Diego (1.35 million) and Los Angeles (1.31 million) were the only other markets where developers had more than 1 million square feet of space in the works.
Combined, these six markets accounted for a little more than 46% of the national office construction pipeline last month.
According to Yardi Matrix research data, nearly 19 million square feet of office space has been delivered in the last five years in Manhattan, N.Y., and developers are expected to deliver an additional 14 million square feet by 2031.
The market’s consistent standout performance in terms of growing demand for class A office space, low vacancy, and increasing listing rates has encouraged development: 1.5 million square feet of office space has broken ground in the Big Apple since September 2025. Furthermore, in addition to the 3.6 million square feet under construction as of last month, the largest office market in the U.S. also has 11.1 million square feet in the planning stages.

Western Markets
California’s Bay Area & San Francisco Lead YTD Sales in Region
Vacancy rates were above the national average of 17.8% in September in the majority of the Western U.S. markets that we surveyed for this report. With the exception of Los Angeles (14.5% vacancy) and Phoenix (17.7%), all markets we analyzed in this region averaged vacancy rates at or higher than 20% last month.
More precisely, vacancy for office space in San Francisco was the highest both in the region and in the country, averaging nearly 27% in September. Next, Seattle was second with vacancy averaging 24.8% last month. In the same vein, San Diego was at 23.7% vacancy and Portland, Ore., averaged 23.2% vacancy — the only other large markets in the region to exceed 23% last month.
San Francisco also topped the regional list for listing rates: Asking rates here averaged nearly $65 per square foot in September, which was almost double the national average of $33.18.
Nearby, Bay Area office space remained the second priciest in the region last month with asking rates averaging $57 per square foot — the only other Western U.S. market on our list where average rates surpassed $50 per square foot in September.
Not to be outdone, the Los Angeles market (#3) and office space in San Diego (#4) each averaged more than $40 per square foot — the only other markets in the region to do so — and closed out the standout block of California markets ranking at the top of the list for asking rates.

Otherwise, Portland, Ore.; Denver; and Phoenix remained the only large markets in the Western U.S. where office asking rates were below the national average in September, each averaging close to or less than $31 per square foot.
Next, when looking at office sales in the region, data showed that California markets continued to hold a comfortable lead. In this case, the Bay Area — which saw nearly $4.6 billion in sales close during the first nine months of the year — took the top spot, followed by the neighboring San Francisco market, where year-to-date transactions reached nearly $3.2 billion. In fact, at the close of September, they were the only two Western U.S. office markets where sales had surpassed $2 billion.
Not far behind, Los Angeles commanded the third-highest sales total in the region so far this year ($1.96 billion). It was followed by sales of Phoenix office space, which added up to nearly $1.2 million since the start of the year through September.
Of course, high-profile assets in gateway markets continue to command top-tier prices. Namely, San Francisco office sales closed through September averaged $470 per square foot, which was the highest in the region last month. At a distance, California’s Bay Area ($350 per square foot) and Seattle ($233) were the second- and third-most expensive office investment destinations in the Western U.S. last month.
California markets also led the region in terms of development in September: San Diego had 1.35 million square feet under construction, followed by Los Angeles, where 1.31 million square feet was under development. Together, they accounted for nearly 49% of the roughly 5.5 million square feet currently in the pipeline across the largest markets in the Western U.S. region.
Midwestern Markets
Chicago & Minnesota’s Twin Cities Top Asking Rates & YTD Sales
The top Midwestern U.S. office markets we looked at for this report remained some of the most affordable in the country in September, both in terms of average listing rate and for-sale price per square foot.
In this region, asking rates for Detroit office space were the most accessible with rates here averaging $20.86 per square foot. Next, the average asking rate for office space in Minneapolis; St. Paul, Minn.; and the wider Twin Cities metro area submarkets rested at $27.64 per square foot. At the same time, office vacancy in the Minnesota metro was the closest to the national average among the top Midwestern U.S. markets we analyzed.
Unsurprisingly, Chicago office space was the region’s priciest for leasing in September with asking rates here averaging $27.99 per square foot. That said, occupancy levels in the Illinois market last month kept vacancy at 18.3%, which was the highest in the region last month, albeit not by much.

The highest regional office sales total so far this year was also in Chicago: By the end of September, the largest office market in the Midwestern U.S. had seen nearly $1.65 billion worth of office space change hands since the beginning of the year. Then, at quite a distance, year-to-date office sales in Minnesota’s Twin Cities followed in second place with a total of $744 million through September 2026.
Yet, when looking at market expansion, development in the region remained quite slow last month with a combined total of 1.56 million square feet of office space under construction in September across the Midwestern U.S. markets we analyzed.
Southern Markets
Dallas & Miami Dominate Construction Pipeline in Region
In the South, Miami; Austin, Texas; and Washington, D.C. remained the region’s priciest markets for asking rates, as well as the only Southern U.S. markets to see full-service equivalent listing rates average more than $40 per square foot in September.
At the opposite end of the ranking, office space in Orlando, Fla., had the lowest asking rate average in the region. As a matter of fact, it was one of only two markets in this group to average less than $30 per square foot last month (the other being Houston).
Looking at year-to-date office sales, six of the 10 Southern U.S. markets we analyzed for this report recorded totals higher than $1 billion through last month: First, Dallas had the highest year-to-date sales total as office transactions here amounted to nearly $3.7 billion last month. Next, sales of Washington, D.C. office space surpassed $2.9 billion last month. The third-highest year-to-date sales total in the Southern U.S. was in Houston, where office sales added up to a little more than $2 billion through September.

Then, looking at leasing data, office space in Miami had the highest average full-service equivalent listing rate in the region in September at a little more than $61 per square foot. Not to be outdone, office space in Austin, Texas, asked an average of roughly $46 per square foot. It was followed by Washington, D.C. — the only other market in this regional group to see listing rates average more than $40 per square foot last month.
Only one other market in the region also rested above the national average last month: Asking listing rates for Atlanta office space averaged nearly $39 per square foot.
Then, looking at vacancy in the region, Texas’ Austin and Houston had the highest rates in September 2026 and were also the only ones to exceed 20% in this respect. Conversely, Miami and Tampa, Fla., had the highest rates of occupancy and were among only three Southern U.S. markets to see vacancy below the national average last month. The third was also in Florida (Orlando).
As for construction, data showed that office space in development in Dallas and Miami — the only markets in the South to each have more than 2 million square feet of office space under construction in September — accounted for nearly 59% of the regional pipeline last month.
As a group, Texas markets carried a significant portion of the office pipeline in the region: In September, roughly 3.3 million square feet of office space was in development in Dallas and 990,000 square feet of Houston office space was under construction. Combined with the 480,000 square feet of projects in development in Austin, these Texas markets accounted for nearly half (49%) of the regional pipeline and nearly 15% of the national total.
Northeastern Markets
Manhattan’s Momentum Continues Across the Board
In September, Manhattan, N.Y., had the highest average listing rate in the region at a little more than $72 per square foot. For comparison, asking rates for Philadelphia office space averaged $32.40 per square foot, making it the only Northeastern U.S. office market to ask less than the national average of $33.18 per square foot last month.
Looking at construction, two of the four largest office markets in the Northeastern U.S. each had more than 2 million square feet of new office space in development. Together, they comprised roughly 20% of the national pipeline last month.
True to form, the Manhattan, N.Y., office space pipeline led supply in the region as office projects in development here totaled more than 3.5 million square feet. Not far behind, construction of office space in Boston made for the second-largest total in the region last month with nearly 3 million square feet in the pipeline. With that, these two Northeastern U.S. markets comprised roughly 20% of the country’s total pipeline of 32.17 million square feet last month.
As one might expect, office sales data showed that transactions in Manhattan, N.Y., amounted to the largest sales total since the start of the year in both the region and the country at $5.7 billion. Meanwhile, transaction activity in Boston during the first nine months of the year totaled close to $1.5 billion in year-to-date office sales, marking the second-largest total in the region. Rounding out the podium, sales of New Jersey office space added up to $643 million since the start of the year through September.

Office-Using Employment
Major Financial Employers Continue to Flock to Dallas
According to data from the Bureau of Labor Statistics, office-using sectors of the labor market experienced a combined loss of 26,000 jobs in September. The information sector led job losses, followed by the professional and business services sector (down 9,000 jobs) and the financial activities sector (down 7,000).
On an annual basis, national employment in office-using sectors decreased by 104,000 positions (a 0.3% Y-o-Y drop), even as total non-farm employment across the country grew by 0.3% during the same timeframe.
At the metropolitan level, data showed that office employment in Dallas has continued its steady growth for several years. Specifically, office employment here was up 1.7% Y-o-Y in August, driven mainly by the professional and business services sector.
Following Morgan Stanley’s announcement that the company plans to expand operations in the area and intends to bring more than 3,000 jobs here throughout the course of the next 10 years, the Dallas market has further cemented its status as an attractive regional financial hub.

Methodology
This report covers office buildings that are 25,000 square feet or larger. Listing rate and occupancy information was based on Yardi Research data.
Listing rates are full-service rates or “full-service equivalent” for spaces that were available as of the report period.
Vacancy refers to the total square feet vacant in a market (including subleases) divided by the total square feet of office space in that market. Owner-occupied buildings are not included in vacancy calculations. For reporting purposes, A and A+/trophy buildings were combined.
Stages of the supply pipeline:
Planned — Buildings that are currently in the process of acquiring zoning approval and permits, but have not yet begun construction.
Under Construction — Buildings for which construction and excavation have begun.
Office-Using Employment is defined by the Bureau of Labor Statistics as including the sectors information, financial activities, and professional and business services. Employment numbers are representative of the metropolitan statistical area and do not necessarily align exactly with CommercialCafe market boundaries.
Sales volume and price-per-square-foot calculations for portfolio transactions or those with unpublished dollar values were estimated using sales comps based on sales that were similar in terms of the market and submarket; use type; location and asset ratings; sale date; and property size.
Market boundaries in the CommercialCafe office report coincide with markets defined in the CommercialCafe Markets Map and may differ from regional boundaries defined by other sources.
Fair Use & Redistribution
We encourage and freely grant you permission to reuse, host, or repost the research, graphics, and images presented in this article. When doing so, we kindly ask that you credit our research by linking to CommercialCafe.com or this page so that your readers can learn more about this project, the research behind it, and its methodology. For more in-depth, customized data, please contact us at [email protected].



Ioana Ginsac
Senior Content Writer, Industry News & Reports
Ioana is a content writer who has been covering all-things-CRE (and more) for several Yardi network publications since 2017. You will find her byline regularly in industry news and market reports, but also on articles covering sustainable development, green urbanism, and innovation, all of which she has been passionately learning about for more than a decade. Her work has been referenced by publications including AmericanInno, Bisnow, BusinessInsider, Commercial Property Executive, Curbed, Fast Company, Forbes, GlobeSt.