Construction Pipeline Continues to Bottom Out as AI Expansion Adds to Uncertainty in Office Sector


Key Takeaways:
- In April, the national office vacancy rate was 17.6% following a decrease of 210 basis points (bps) year-over-year (Y-o-Y).
- The national office listing rate averaged $32.91 per square foot last month, which was 1.3% lower than values recorded in April 2025.
- Nationally, the modest office supply pipeline inched up last month to nearly 29.4 million square feet of office space under construction.
- With close to $2.9 billion in deals closed since the start of the year, Manhattan, N.Y., topped the list for sales. It was followed by San Francisco ($1.6 billion) and Dallas (a little more than $1 billion).
- Miami and Manhattan, N.Y., averaged the lowest vacancy rates in April among the top eight U.S. office markets where vacancy was below the national average.
- Western and Northeastern U.S. markets had most of the leasing rates that were above the national average, while Southern and Midwestern markets claimed some of the most affordable office asking rates in April.
- Boston; Manhattan, N.Y.; and Dallas; had the most active construction pipelines and were the only markets where more than 2 million square feet of new office space was in development last month.
Trends & Industry News
Increasing AI Adoption Holds Sway Over Use of Office Space
As the debate regarding the effect of AI on employment intensifies, the proliferation of this new technology is also expected to have significant implications for office demand. Accordingly, within the office sector, the coworking segment has proven to be a resilient asset as it’s well-positioned to navigate the ebb and flow of business operations during times of uncertainty.
Looking ahead, if adoption of AI accelerates, flexibility will be even more instrumental, while the standing of and demand for traditional office remain in question. Consequently, the relevance of coworking is likely to grow as the relationship between workers and the workplace continues to change.
“While acknowledging the recent gains made in New York and San Francisco leasing, the predominant theme in the near and intermediate future is uncertainty. With this, offering flexible terms in a variety of sizes and options is seemingly the sweet spot. We anticipate that this subset of office space — whether called move-in-ready or serviced and whether directly from a landlord or from a coworking operator — will see significant increase in interest from tenants.”
Peter Kolaczynski, Director, Yardi Research
If we consider the likely acceleration of AI adoption, there are three scenarios that are more likely to emerge with respect to workers.
First, the most likely possible outcome is augmenting workers, which would translate to significant productivity gains. This would allow firms to streamline and operate more efficiently while retaining much of their workforce, albeit eliminating some positions along the way.
Alternatively, the arising technology successfully replaces large portions of the workforce — a scenario in which we would see a substantial decline in office employment.
Finally, it’s also a possibility that the costs of widespread implementation outweigh the benefits, which would result in a bubble. This would involve unfruitful investments and premature layoffs that, in turn, would create a period of economic decline and prolonged unemployment.
Whichever path prevails, how office space is used will change. Most likely, regardless of which scenario unfolds, large office spaces with rigid lease agreements will increasingly become obsolete.
Listing Rates & Vacancy
Miami Records Lowest Vacancy Among Top Markets
The national average full-service equivalent listing rate for office space was $32.91 per square foot last month after a dip of 1.3% Y-o-Y. Similarly, the national vacancy rate dipped 210 bps compared to the previous year to rest at 17.6% at the close of April.
Of the 25 largest markets that we analyzed, 20 saw a decrease in their respective vacancy rates since April of last year. In particular, Miami continued to stand out for the lowest vacancy among them. Supported by robust growth in office-using employment, rates here declined from a peak of 15.7% in early 2025 to 12.5% in April 2026.
Contributing to sustained office demand in the market are: relocations of corporate headquarters to Florida’s business-friendly environment in recent years; companies like JPMorgan, Amazon, and Citadel that have expanded their operations in the area; and the financial activities sector performing particularly well.

Transactions
Discount Office Sales Comprise Noteworthy Share of Transactions in Washington D.C.
In April, year-to-date office sales added up to a little more than $18 billion across 798 transactions, while sale prices averaged $214 per square foot. In fact, a total of 22 of the top 25 metros analyzed for this report saw overall sales in excess of $100 million during the first four months of the year.
Notably, discount sales continued to be a significant presence in the sector: Last year, properties changing hands at a discount from their previous sale price accounted for 65% of office transactions in Washington, D.C. Meanwhile, sale prices averaged $158 per square foot in 2025, which was nearly half of the capital’s 2020 peak values.
One prominent example is the sale of The Lion Building. Located at 1233 20th St. NW near Dupont Circle, the class-B property was acquired by Douglas Development for $12.4 million after it bought the loan on the property. This represented a steep discount from the $65 million that the former owners paid for the office building back in 2018.

Supply
Class-A Office Assets Account for Majority of National Pipeline
As of April, roughly 29.4 million square feet of office space was under construction in the U.S. markets we tracked for this report. According to Yardi research data, this represented roughly 0.4% of stock. Additionally, during the first three months of the year, developers delivered 6.6 million square feet of office space.
Looking ahead, Yardi Research analysis forecasts that new supply may likely bottom out next year with completions at just under 30 million square feet, followed by small increases each year through 2030. Then, if adoption of AI expands and prolonged unemployment becomes an increasing likelihood, new office space supply will remain limited as new projects will be difficult to justify.
At the same time, as the flight to quality continues, demand is likely to remain concentrated in amenity-laden, jewel-box properties. Construction-wise, most of the new completions will be class-A office spaces in urban areas. Of the current total under construction, 86% of projects (or 25.2 million square feet) are class A+/A office space. The roughly 4 million square feet remaining (14% of the pipeline) are class-B properties.
Of course, when looking at location, projects in the pipeline present a somewhat more balanced distribution. Specifically, urban office space under construction totaled 15.2 million square feet (52%), followed by suburban projects at 9.8 million (33%) and central business district office space at 4.4 million (15%).

Western Markets
San Diego Leads Office Construction, LA Boasts Lowest Vacancy in Region
Vacancy rates were above the national average of 17.6% in April in the majority of the Western U.S. markets that we surveyed for this report. As a matter of fact, with the exception of Los Angeles (13.8% vacancy) and Phoenix (16.3%), all markets in this group averaged vacancy rates higher than 19% last month.
Specifically, Seattle office space vacancy was still the highest in the region, averaging 25.2% in April. Next, San Francisco was second with vacancy here averaging 23.3% last month.
Plus, office space in San Francisco topped the regional list for leases: Asking rates here averaged about $62 per square foot in April, which was almost double the national average of $32.91.
Not to be outdone, neighboring Bay Area office space was the second-priciest in the region last month with asking rates averaging a little more than $55 per square foot — the only other Western U.S. market on our list where average rates surpassed $50 per square foot last month.
Not far behind, San Diego (#3) and LA (#4) each averaged more than $40 per square foot — the only other markets in the region to do so — and closed out the standout block of California markets occupying the top of spots on the list for rents.

Otherwise, Portland, Ore.; Phoenix; and Denver were the only large markets in the Western U.S. where office asking rates were below the national average in April. Each averaged around or less than $30 per square foot.
Next, when looking at total market office sales in the region, data showed that northern California markets held a comfortable lead. More precisely, San Francisco — which saw nearly $1.6 billion in sales close during the first four months of the year — shot up to the top spot, followed by the neighboring Bay Area, where year-to-date transactions approached $1 billion.
Further south, Los Angeles commanded the third-highest sales total in the region so far this year ($617 million). It was followed by sales of San Diego office space, which added up to $454 million since the start of the year.
Once again, Phoenix and Denver were the only other Western U.S. markets to see office sales surpass $300 million during the first four months of the year.
Granted, high-profile assets in gateway markets continue to command top-tier prices. Namely, San Francisco office sales closed through April averaged $686 per square foot, which was the highest in the Western U.S. and, thus far, the second-highest nationwide.
California markets also led the region in terms of development in April. For instance, San Diego had a little more than 1.7 million square feet under construction, followed by Los Angeles office space under development that totaled more than 1.6 million square feet. Together, they accounted for more than 62% of the roughly 5.3 million square feet currently in development across the largest markets in the region.
Midwestern Markets
Twin Cities Hold Tightest Vacancy, Year-to-Date Sales in Chicago Surpass $700 Million
The top Midwestern U.S. office markets we looked at for this report remained some of the most affordable in the country in April, both in terms of average listing rate and for-sale price per square foot.
In this region, asking rents for Detroit office space were the most accessible in this group with rates here averaging $20.81 per square foot. Next, the average asking rate for office space in Minneapolis; St. Paul, Minn.; and the wider Twin Cities metro submarkets rested at $27.66 per square foot. At the same time, occupancy levels in the Minnesota market last month also kept vacancy at 17.7% to make it the closest large market in the Midwest to approach the national average of 17.6% last month.
Unsurprisingly, Chicago office space was the region’s priciest for leasing in April with asking rents averaging $28 per square foot. Additionally, the Windy City’s occupancy levels averaged an 18.2% vacancy rate, which was also relatively close to the national average.

Likewise, the highest regional office sales total thus far this year was also in Chicago: By the start of May, the largest office market in the Midwest had seen $714 million worth of office space change hands since the beginning of the year. Then, at quite a distance, office sales in the Twin Cities followed in second place with a total of $377 million through April 2026.
Other than those, development in the region remained quite slow last month with a combined total of less than 900,000 square feet of office space under construction in April across the Midwestern U.S. markets we analyzed.
Southern Markets
Miami Tops Leasing Rates, Texas Markets Lead Office Construction
In the South, Miami; Austin, Texas; and Washington, D.C. topped the list in terms of asking rents and were the only Southern U.S. markets to see full-service equivalent listing rates averaging more than $40 per square foot in April.
At the opposite end of the ranking, office space in Orlando, Fla., had the lowest asking rent average in the region and was one of only two markets in this group to average less than $30 per square foot last month. The other was Houston.
Meanwhile, a look at year-to-date office sales showed that eight of the Southern U.S. markets we analyzed for this report recorded totals higher than $300 million through last month. First, Dallas had the highest year-to-date sales total as office transactions here amounted to a little more than $1 billion last month. Next, Miami office sales totaled $902 million through April, followed by office space in Washington, D.C. ($810 million).
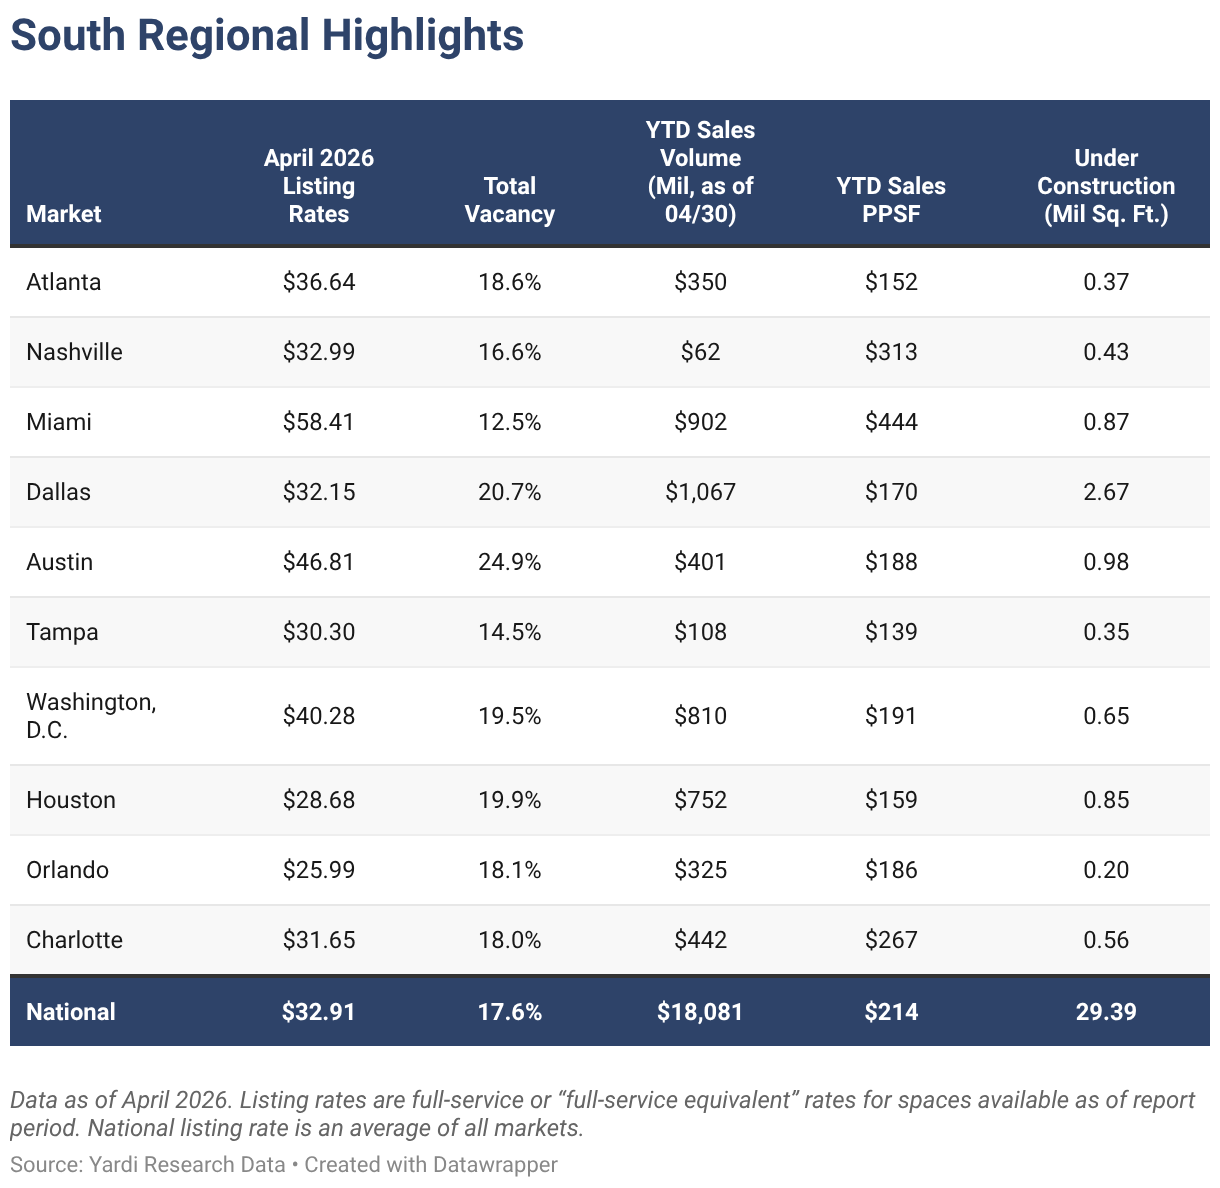
Then, looking at leasing data, office space in Miami had the highest average full-service equivalent listing rate in the region in April at $58.41 per square foot. Next, office space in Austin, Texas, asked an average of nearly $47 per square foot, followed by Washington, D.C. — the only other market in this regional group to see lease rates average more than $40 per square foot last month.
Two other markets in the region also rested above the national average last month: Office space in Atlanta saw asking leasing rates approach $37 per square foot, whereas asking rents for Nashville, Tenn., office space averaged close to $33 per square foot.
Notably, Texas’ Austin and Dallas had the highest vacancy rates in the region in April 2026 and were the only ones to exceed 20%. Conversely, Miami and Tampa, Fla., had the highest rates of occupancy and were among the only three Southern U.S. markets with vacancy below the national average last month (the third one was Nashville, Tenn.).
As for construction, data showed that Texas markets carried more than half of the office pipeline in the region: In April, nearly 2.7 million square feet of office space was in development in Dallas: close to 1 million square feet was under construction in Austin; and Houston’s pipeline totaled 850,000 square feet. Combined, these three Texas powerhouses accounted for nearly 57% of development in the region and roughly 15% of the national pipeline.
Northeastern Markets
Manhattan YTD Sales Approach $3 Billion, Boston Leads Office Development
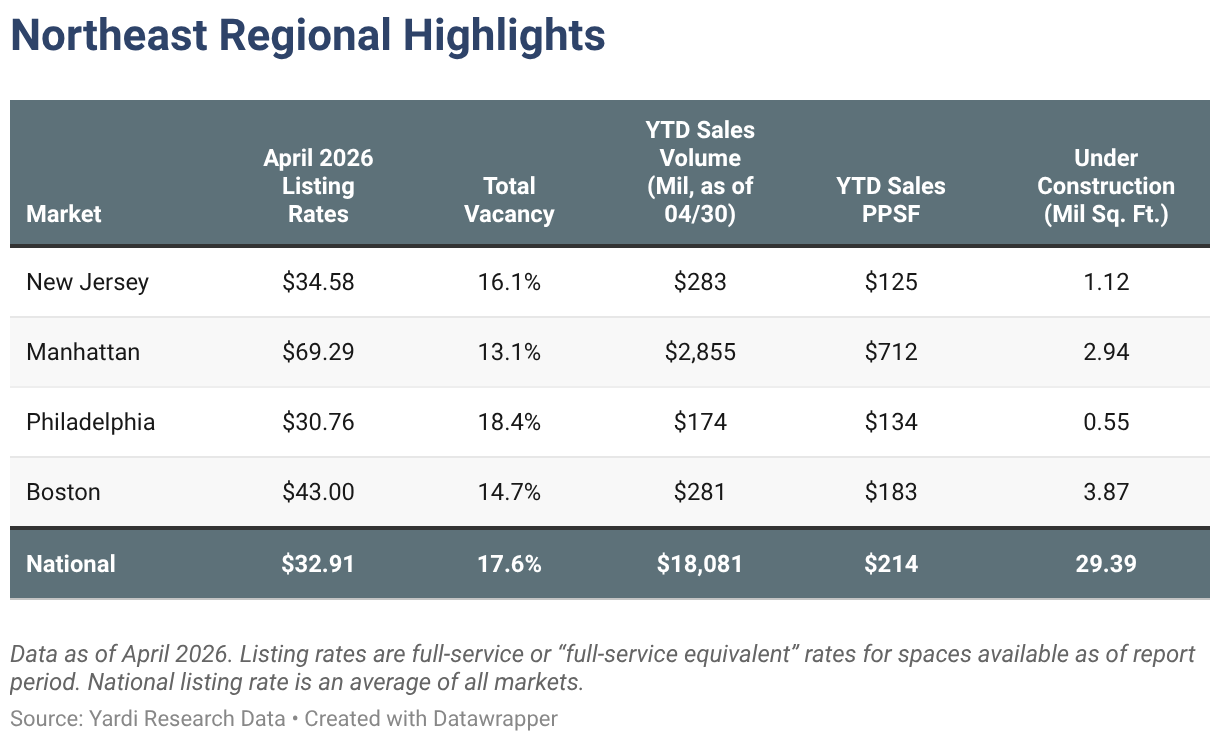
In April, Manhattan, N.Y., had the highest average listing rate in the region at $69 per square foot. For comparison, asking rents for Philadelphia office space averaged slightly below $31 per square foot, making it the only Northeastern U.S. office market to ask less than the national average of $32.91per square foot last month.
Looking at construction, three of the four largest office markets in the Northeast had more than 1 million square feet of new office space in development. Together, they accounted for close to 27% of the national pipeline last month.
Of these, Boston led supply in the region as office projects in development here totaled close to 3.9 million square feet. Next, the Manhattan, N.Y., office space pipeline was the second-largest in the region last month with 2.94 million square feet under construction. With that, these two Northeastern U.S. markets accounted for about 23% of the country’s total pipeline of approximately 29.4 million square feet last month. The New Jersey office space pipeline was the only other market in the region to exceed 1 million square feet in April.
As you might expect, an analysis of office sales showed that transactions in Manhattan, N.Y., amounted to the largest sales total since the start of the year in both the region and the country — more than $2.8 billion. Nearby, New Jersey sales added up to $283 million by the end of April, while transaction activity in Boston during the first four months of the year totaled $281 million in year-to-date office sales.
Office-Using Employment
Growth in Financial Sector Defies National Trend in Austin, Texas
According to data from the Bureau of Labor Statistics, office-using sectors of the labor market lost a combined 17,000 jobs last month, led by financial activities and information technology. However, the professional and business services sector gained 7,000.
Looking at office-using sectors on a year-over-year basis, data showed a loss of 203,000 jobs nationally, which represented a 0.6% decrease in 12 months.
Among the locations we analyzed for this report, Austin, Texas, stood out as the leader in office employment by outpacing all other top metros with 1.6% Y-o-Y growth in February. In this case, the market has seen consistent job gains in the financial activities sector since the onset of the pandemic, which softened the significant swings suffered by the other two large office-using sectors. Fintech corporate mobility to the local tech scene, such as the moves by Peak6 and Togetherwork, are also contributing to Austin emerging as a notable financial hub.

Methodology
This report covers office buildings that are 25,000 square feet or larger. Listing rate and occupancy information was based on Yardi Research data.
Listing rates are full-service rates or “full-service equivalent” for spaces that were available as of the report period.
Vacancy refers to the total square feet vacant in a market (including subleases) divided by the total square feet of office space in that market. Owner-occupied buildings are not included in vacancy calculations. For reporting purposes, A and A+/trophy buildings were combined.
Stages of the supply pipeline:
Planned — Buildings that are currently in the process of acquiring zoning approval and permits, but have not yet begun construction.
Under Construction — Buildings for which construction and excavation has begun.
Office-Using Employment is defined by the Bureau of Labor Statistics as including the sectors Information, Financial Activities, and Professional and Business Services. Employment numbers are representative of the metropolitan statistical area and do not necessarily align exactly with CommercialCafe market boundaries.
Sales volume and price-per-square-foot calculations for portfolio transactions or those with unpublished dollar values were estimated using sales comps based on sales that were similar in terms of the market and submarket; use type; location and asset ratings; sale date; and property size.
Market boundaries in the CommercialCafe office report coincide with markets defined in the CommercialCafe Markets Map and may differ from regional boundaries defined by other sources.
Fair Use & Redistribution
We encourage and freely grant you permission to reuse, host, or repost the research, graphics, and images presented in this article. When doing so, we kindly ask that you credit our research by linking to CommercialCafe.com or this page so that your readers can learn more about this project, the research behind it, and its methodology. For more in-depth, customized data, please contact us at [email protected].



Ioana Ginsac
Senior Content Writer, Industry News & Reports
Ioana is a content writer who has been covering all-things-CRE (and more) for several Yardi network publications since 2017. You will find her byline regularly in industry news and market reports, but also on articles covering sustainable development, green urbanism, and innovation, all of which she has been passionately learning about for more than a decade. Her work has been referenced by publications including AmericanInno, Bisnow, BusinessInsider, Commercial Property Executive, Curbed, Fast Company, Forbes, GlobeSt.