Are You Living in One of the Cities Where Commuting Time Increased the Most or Least?


If you live and work in the U.S., you likely have some form of commute to work. Whether you take the train or go by car, bus or subway – or all of the above – commuting takes up a large amount of your personal time that can often lead to frustration.
Spending hours in traffic is never fun, but people who do it every day try to make it as pleasant as possible by using the “downtime” to do things they enjoy. For example, listening to podcasts, reading, or even catching up on work can be great distractions from the long commute and, sometimes, even a quick nap works wonders.
But, how has commuting time evolved since 2008? According to U.S. Census data, 96% of the employed population commuted to work in 2008, spending an average of 51 minutes on the route (both ways). By 2017, the percentage of commuters had dropped 1% as more remote and freelancing jobs started popping up.
The amount of time spent commuting also changed in every city in the past decade, mostly due to shifts in the economy, population and job market. In San Jose, for example, if you add up all the hours spent in traffic each day, you end up with 2 extra days per-year commuting in 2017 compared to 2008, as the hours spent in traffic daily grew from 51.6 minutes to 62.6 minutes.
Nowadays, 95% of employed Americans spend an average of 54 minutes commuting to work each day. But, if you look at some of the larger, more bustling cities, the average number of minutes spent in traffic is significantly higher. In New York City, for example, expect to spend an average of 84 minutes commuting each day.
Intrigued by the evolution of commuting, we researched and compiled statistics for several rankings. First, we looked at the cities with a population above 500,000 where commuting time increased and decreased the most between 2008 and 2017. We also analyzed the cities where people spent the most and least time commuting in 2017. For a more detailed methodology, scroll to the end of the article.
Below are some of the highlights of the study and visuals.
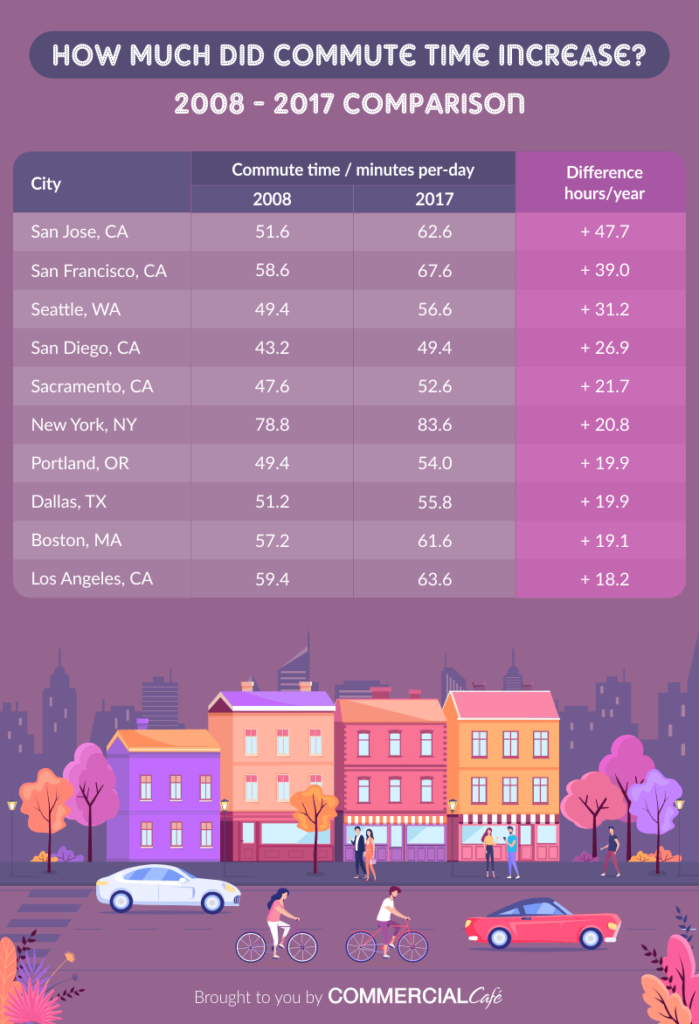
San José Commuters Spend 2 More Days per Year in Traffic in 2017 Than in 2008
It’s no surprise that commuting time increased the most in San José since 2008. As the city was swept by the tech industry, it started to expand rapidly – and so did its population. San José’s population increased 13% in 10 years, which also added to the increase of commuting time.
In 2008, workers spent an average of 51.6 minutes per day commuting to work; by 2017, this number had increased to 62.6 minutes. Even though the difference is just 11 minutes per day, if you add up all of those extra minutes spent on commuting in one year, you end up with two extra days spent in traffic – 47.7 hours, to be exact.
As far as means of commute go, the number of drivers increased 19% in 10 years and walking decreased 8%. People who do their commuting by bike dropped 21% in San José, while the use of public transportation increased 44%.
Workers Spend 39 More Hours per Year Commuting in San Francisco
Of the 10 cities on the list where commuting time has increased the most, five are in California. This comes as no surprise, as people gravitated toward cities with better job opportunities and quality of life. San Francisco came in second, with commuting time increasing by 39 hours per year in 10 years’ time. Workers spent an average of 58.6 minutes per day commuting in 2008; in 2017, that number increased to 67.6 minutes. The city’s workforce also increased in 10 years, going from 442,831 to 523,364 – an 18% surge – which influenced commuting time severely.
Other California cities with commuting time hikes include San Diego (26.9 hours per year increase), Sacramento (21.7 more hours per year) and Los Angeles (up 18.2 hours per year).
Seattle’s Workforce Surges 26%, Commuting Gets Complicated
Another West Coast city that ranked high is Seattle, where the expansion of the workforce and population led to an increase in commuting time, as well. Locals spent about 49.4 minutes per day commuting in 2008; by 2017, the daily average had increased to 56.6 minutes. Additionally, in just 10 years, the number of workers in Seattle had risen by 26%, while the city’s population grew 24%.
The only two East Coast cities that made the chart are New York City and Boston, where commuting time increased 20.8 hours per year and 19 hours per year, respectively.
Las Vegas, Memphis & Denver Commute Times Improve
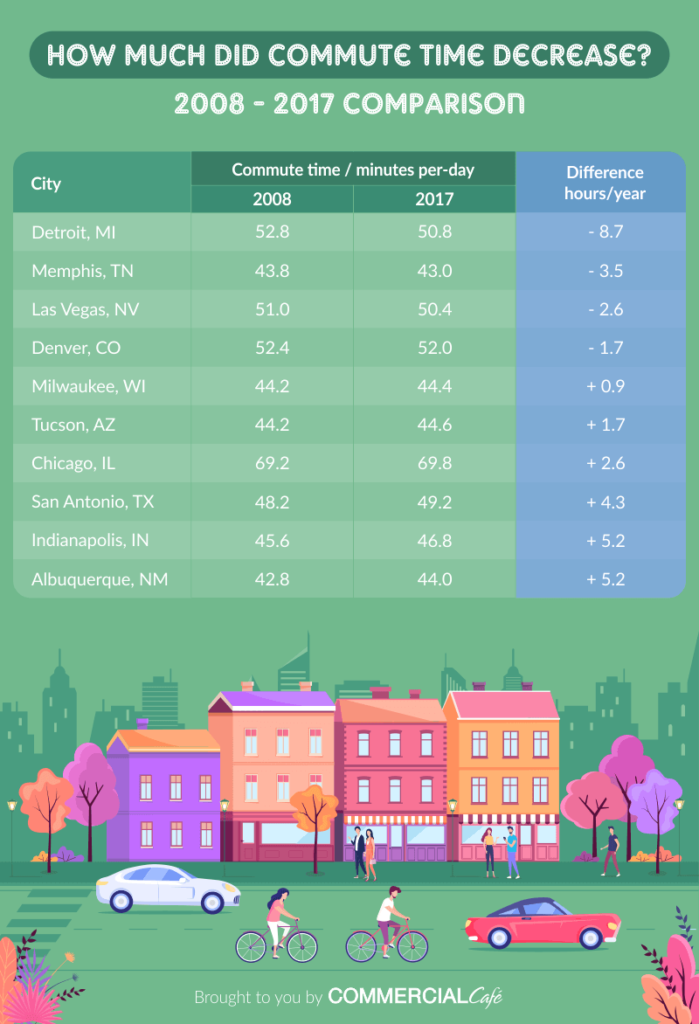
Despite most cities on the list seeing growth in both population and workers, commuting time did decrease in a few cities with populations greater than 500,000 people. This is due to several factors. One of the most important aspects of the decreases is related to good infrastructure. Tennessee, Nevada, Texas and Indiana rank among the top states with the best infrastructure in the U.S., so it comes as no surprise that commute time in Memphis and Las Vegas dropped by a few hours per year since 2008, while San Antonio and Indianapolis commutes increased just slightly.
In Memphis, workers now commute 3.47 hours less per year than they used to, while Las Vegas workers are saving 2.6 hours per year compared to 2008. In San Antonio, commute time increased by four hours per year, and Indianapolis commute times were up 5.2 hours per year.
The percentage of workers using bikes as their main mode of transportation surged significantly in some of the above-mentioned cities. In Memphis, biking increased 103% from 2008 to 2017; in San Antonio, biking is up a staggering 140%. Even though biking increased, driving to work is still the main way to commute in these cities.
Denver & Detroit Commutes Drop; Chicago Up Slightly
Biking and walking to work also increased in Denver. Compared to 2008, 32% more workers walk to their job in the city, and 78% more people bike. Despite increases in both population and workers, commuting time in Denver actually decreased by 1.73 hours per year.
In Chicago, commuting time increased by only 2.6 hours per year, while in Detroit, the average commuting time dropped by 8.67 hours per year.
Cities with the Highest & Lowest Amount of Time Commuting in 2017
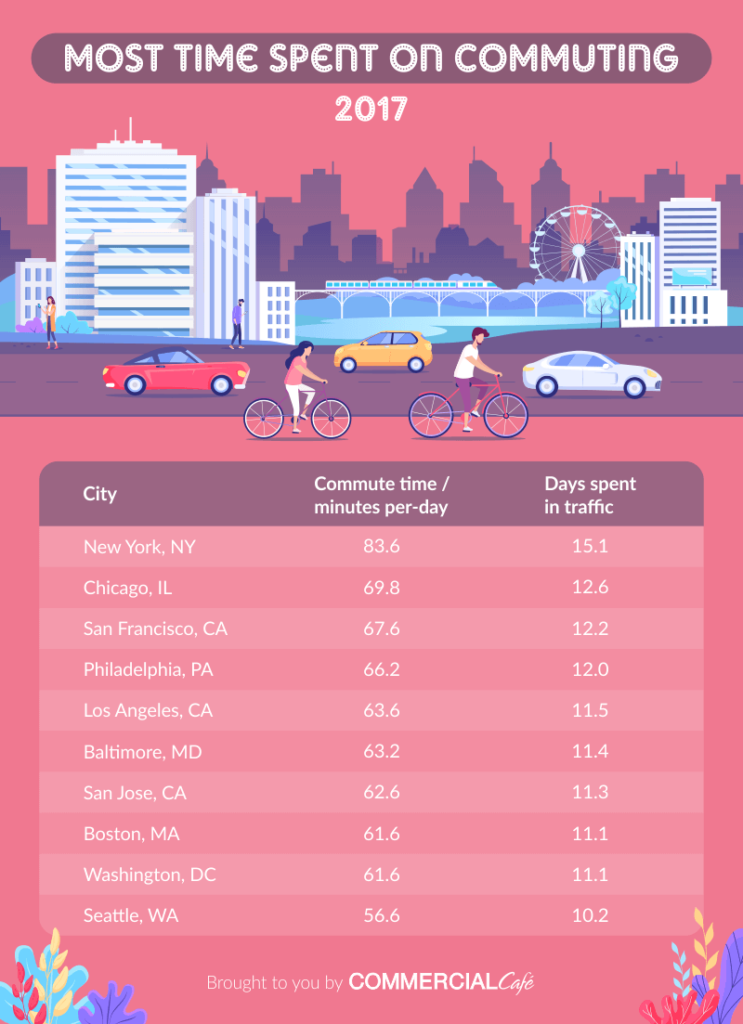
Long Commutes in NYC, Chicago & San Francisco
The bigger the city, the longer it takes to get from point A to point B, and, if you’re commuting from outside of the city, it’s even worse. Population increases, traffic congestion and a high concentration of workers all add up to excruciating commuting times.
In New York City, if you add up all of the hours spent commuting, you end up with an average of 15 days per year just going to work and back home; that’s one month every two years. Many people take public transportation in New York City, and the same goes for all of the others in the top 10 cities with the highest amount of commuting time.
Things aren’t any better in Chicago, IL, San Francisco, CA, or Philadelphia, PA, either. In these cities, you spend between 12 and 13 days per year commuting. In Los Angeles and San José, you spend a little more than 11 days going to and from work.
Cities Where You Spend the Least Amount of Time in Traffic
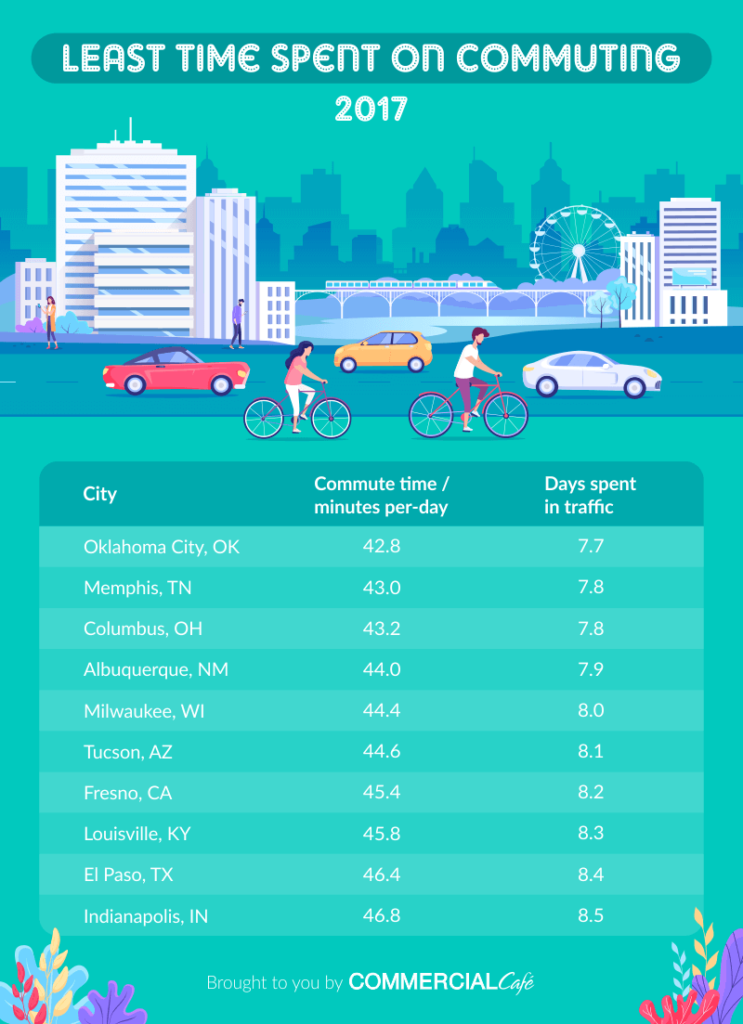
On the opposite side of the spectrum, Oklahoma City, OK, Memphis, TN, and Columbus, OH, are the cities where you spend the least amount of time commuting. In Oklahoma City, a commuter spends about 42.8 minutes per day commuting, or 7.7 days per year. Commuters spend approximately the same amount of time in traffic in Memphis, Columbus and Albuquerque, NM.
The cities in this particular ranking are fairly uncluttered, which explains why you spend significantly less time on the road getting to and from work. These cities are also more spread out, which means people commute by car and rarely use public transportation.
Final Takeaway
A lot has changed in 10 years when it comes to commuting – for better and for worse in some cases. The average number of people commuting dropped by 1% percent, freelancer and remote jobs increased, and more people than ever use alternative transportation to get to work. People are also more considerate than in years past, taking the environment into account, and walking and biking to work, if distance permits it.
Commuting long distances can be draining, and one way to avoid spending long hours stuck in traffic – at least for those who are offered a flexible or hybrid work schedule – is to conduct their daily activities from a nearby coworking space. Explore top listings near you with CommercialCafe.com:
Methodology
The data used for the study was extracted from the U.S. Census Bureau of Labor Statistics. We extracted commuting characteristics by one-year estimates (2017 and 2008) and analyzed cities with a population larger than 500,000 people.
Cities were selected based on the most and least time spent in traffic. We calculated the time spent in traffic for both ways (data from Census multiplied by two).
Hours spent in traffic were calculated by multiplying the minutes by working days (we used an average of 260 days) and dividing the result by 60 (minutes in an hour).


Robert Demeter
Robert is a copywriter at CommercialCafe and brings 3+ years of experience in commercial real estate. He previously worked as a copywriter at PropertyShark, as a senior associate editor at Commercial Property Executive and Multi-Housing News, and also wrote monthly market reports at Yardi Matrix.