Suburbs Home to 67% of All Offices Constructed in Last 20 Years


Key Takeaways
- 1.8 billion square feet of rentable office space has been constructed across the country in the last 20 years, with 85% in the top 50 metropolitan areas.
- Office construction was overwhelmingly suburban, as campus-style design and cheaper land pulled developers and companies further out of the city.
- New York City, Los Angeles, Seattle and Buffalo, N.Y., bucked the suburban trend, adding more offices to urban areas.
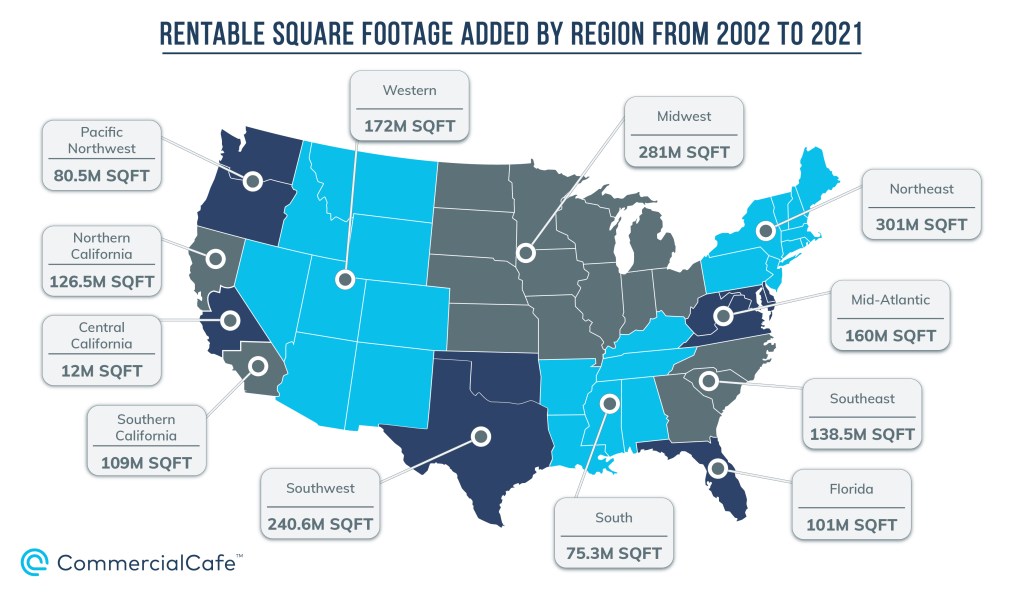
- Suburban office development dominated Western and Southwestern markets, with more than 330 million square feet constructed.
- Charlotte, N.C., and Washington, D.C. saw more office development in their CBDs as compared to the country overall.
- 64% of offices constructed in LA were in urban or CBD locations, whereas just 9% of San Diego’s were in the city.
The evolution of how and where we work changes slowly. But sometime during the last half-century, we stopped building as many skyscraper office buildings and started building more campus-style offices in the suburbs or on the urban fringe — or at least that’s how it feels. Plus, in many cases, it’s cheaper to build a new property in the suburbs than it is to update and retrofit an older urban building. As a result of this transition, parking became easier, office amenities expanded and commuting time increased.
But is this really what happened? Have the suburbs been more popular for office development than cities? And, if so, has this same trend played out across the entire country?
To find out, we identified properties in 50 top markets across all urban, suburban, and central business district (CBD) locations. Then, using data provided by Yardi Research Data, we analyzed the office footprint within each area from 2002 through 2021 to see where the expansion and growth was concentrated in the last two decades. For consistency, “urban” does not include the central business district. These metrics were calculated separately.
It’s worth mentioning that one thing to keep in mind when analyzing growth data is size. Suburban geographies are larger than their urban centers and, consequently, can handle far more growth. But the suburbs also tend to have more square footage already. So, while 5 million square feet added to an urban location may represent a high growth rate for that area, the same addition in a large, suburban location might actually be quite low relative to the existing office space, depending on the market.
Mountains, Boundaries & Prestige: The Northwest & Northeast Grow Urban Cores
 Fully two-thirds of all office space added in the last 20 years in the U.S. was in the suburbs — totaling more than 1.2 billion square feet across nearly 18,000 properties. Accordingly, with the availability of cheaper land that’s more easily developed, it stands to reason that the majority of office growth would be in the suburbs.
Going deeper, though, the suburbs weren’t always more popular areas for office development. For instance, the Pacific Northwest and Northeastern regions of the U.S. saw more office development in their urban and CBD areas, with suburban development accounting for only 42% and 47% of office development, respectively. Specifically, since 2002, these regions have added 206 million square feet of urban and CBD office space across 1,020 properties.
Notably, the more urban-concentrated development in the Pacific Northwest has two main causes: geography and growth boundary policies. The Northwestern U.S. is mountainous and, as a result, more difficult to build on, especially around the largest urban center — Seattle. What’s more, in 1979, Portland instituted its urban growth boundary policy that restricts development outside of the city, thereby forcing Portland to grow up, rather than out, to combat urban sprawl.
On the opposite coast, the Northeastern region added more square footage of office space than any other region across all location types — 2,362 properties totaling more than 300 million square feet. Of course, this region is home to global cities like New York City and Boston, which explains why 53% of the office space developed here in the last 20 years was in urban and CBD areas. New York City, in particular, has very little developable land, comparatively speaking. Therefore, up is really the only way to go for building new office space in New York City. However, Buffalo, N.Y., also ranked alongside the largest cities in the country with 60% of the nearly 8 million square feet of Buffalo office space being built in urban and CBD locations.
Suburban Office Development Dominates in West & Southwest
Conversely, suburbs in the Southwestern region accounted for 80% of the office expansion in the last two decades. In fact, this region also added the second-most office space overall, developing more than 240 million square feet of office space across 2,463 properties since 2002. Granted, Texas makes up the majority of this region, which includes not only the sprawling markets of Houston and the Dallas-Fort Worth metroplex (DFW), but also the fast-growing Austin market, as well. Clearly, the expanse of east Texas surrounding these urban centers provides cheaper construction options for developers than the more expensive urban areas.
But not every Texas city grew the same way. While office space in Houston, DFW, and Austin saw similar suburban office development throughout the last two decades (81%, 77% and 77%, respectively), it was actually San Antonio’s suburban office market that grew the most as a percentage of existing stock compared to the other three Texas cities: In the Alamo City, 86% of all office square footage added since 2002 was in the suburbs.
And, despite the Texas capital’s mid-range performance among its peers in the suburban category, its CBD significantly outperformed DFW and Houston. Specifically, 16% of new office space in Austin was downtown, totaling more than 6 million square feet across 37 properties. By comparison, Houston and DFW added a combined 10.1 million square feet of office space in their downtowns. And as the way work changes, all three of these cities are on the cutting edge with coworking spaces in Dallas, Houston, and Austin all in the top 12 markets nationally.
Meanwhile, the Western region — encompassing Arizona, Nevada, Colorado and Idaho — added the most office square footage as a percentage of total 2022 stock. More precisely, 34% of this region’s current office space was built in the last 20 years — accounting for more than 1,989 properties and 172 million square feet of office space. Here again, large, suburban markets were the reason for this region’s growth, with 81% of all office properties built since 2002 being in the suburbs of cities like Phoenix, Denver, Las Vegas, and Salt Lake City.
Moreover, the suburbs made the campus-style headquarters possible, too: Silicon Valley tech giants became famous for their HQs, attracting top talent with high-quality and unique amenities, like complimentary snacks, nap pods, and free transportation to and from work. And, although office campuses like these weren’t anything new, they were previously treated like any other business park with the buildings leasing out individual spaces. But while it’s possible to achieve this atmosphere in the city center, the campus-style office design is best suited for the suburbs, where land is plentiful and cheap.
Florida Focuses on Suburbs, D.C. & Charlotte Grow CBDs
Office development on the East Coast was anything but homogeneous: Indeed, every city added more office space in suburban areas than in urban or CBD areas combined, but some cities saw more urban office development than others. In particular, office space added in Florida since 2002 was overwhelmingly suburban, with 81% of office construction happening in the suburbs — totaling more than 81 million square feet across 1,153 properties. In fact, across the five Florida cities we analyzed — Miami, Ft. Lauderdale, Tampa, Orlando and Jacksonville — only 25 properties were constructed in CBDs, equating to less than 3% of all properties added in this timeframe.
Farther north, both Charlotte, N.C., and Washington, D.C. added considerably more space to their urban areas and CBDs than most other cities in our analysis. Indeed, both cities also offer significant shared office space, with coworking space in Washington, D.C. and Charlotte coworking both within the top 20 markets.
The national capital market is vast, covering roughly half of Maryland and all of northern Virginia, which means that most of the area within the market is suburban. Even so, 47% of Washington, D.C. office space added in the last 20 years was in urban and CBD areas such as Arlington, Va.; Alexandria, Va.; and D.C. proper. Specifically, 21% of the space was in the CBD, the center of D.C. itself. Moreover, of the nearly 105 million square feet of office space added to the market overall in the last two decades, nearly 22 million was added to the CBD — which is quite a feat given that the construction height restriction in the District is roughly 11 stories.
Interestingly, Charlotte’s CBD also saw more growth than most others in the country in since 2002, adding nearly 7 million square feet of office space across 14 properties — 21% of the total space added in the market overall. Overall, the MSA added 33.4 million square feet of Charlotte office space across 290 properties.
At the same time, office construction in Atlanta and Baltimore leaned heavily on areas outside of the CBD, with just 2% and 3% of office properties constructed being located there, respectively. However, Atlanta’s urban locations outside of its CBD grew significantly. In fact, 35% of all office space added in the ATL in the last 20 years was concentrated in the urban areas of Midtown and Buckhead — with 62 properties totaling 16.6 million square feet of Atlanta office space. Coincidentally, much of the coworking space in Atlanta is also located in these areas. Not far behind, 23% of office space added to the Baltimore office market during the last two decades was in urban areas outside of its CBD, totaling 8.3 million square feet.
LA & San Francisco Focus on Urban Offices; San Diego & Bay Area Opposite
In general, California markets largely avoided the CBD as far office development goes, with the exception of high-profile properties like the Wilshire Grand Center in Los Angeles. Here, just 7% of all of the Los Angeles office space that was added since 2002 — 2.9 million square feet across 31 properties — was located in the city’s CBD. And while this might seem like a significant amount, the LA urban areas outside of the CBD — mostly between downtown and Santa Monica, as well as south to Long Beach — added 211 properties totaling more than 23 million square feet. Furthermore, the suburban areas to the east and north added less than 15 million square feet of office space, just 36% of the total space added in the last 20 years.
Coworking has also exploded in popularity in the City of Angels. In fact, the number of coworking spaces in Los Angeles is second only to New York City. Coworking in San Francisco is nearly as popular in Los Angeles as the sixth most popular coworking market in the country.
San Francisco followed a similar pattern to LA, with office construction mostly taking place outside of the CBD. As a matter of fact, just one property was constructed in the CBD in the last 20 years: 350 Bush, with 388,000 square feet of San Francisco office space. Meanwhile, 44% of office space constructed was concentrated primarily in the SOMA and South Financial districts, with the famous Salesforce Tower being completed in 2018 and totaling 1.4 million square feet.
Alternatively, the very suburban markets of the Bay Area and San Diego added office space exactly there — in the suburbs. San Diego’s suburbs saw a whopping 91% of total office construction in the MSA — nearly 27 million square feet across 268 properties. Despite the fact that the dispersion of properties covered many of the outer regions of the San Diego market, the lion’s share of the properties were claimed by Carlsbad, Torrey Pines and the Sorrento Valley. That’s because San Diego’s biotechnology sector is largely concentrated in those submarkets — and they show no signs of slowing down. San Diego coworking has also been expanding recently.
Similarly, the Bay Area is the definition of suburban, with the only urban areas being located right around San Jose and Oakland. Consequently, 375 properties consisting of 55.6 million square feet of Bay Area office space constructed in the last 20 years were in suburban areas. By comparison, just 52 properties were added to Bay Area urban locations during the same timeframe. Here, startup culture, boutique offices and tech campuses dominate the office market of the Bay Area — a fact that’s not expected to change anytime soon with coworking spaces in Palo Alto and San Jose expanding.
Chicago Adds More Urban Offices Than Suburban, Other Midwest Cities Trend Similarly
In the Midwest and Southern regions, only one market added more urban office space than suburban space — Chicago. In particular, 56% of Chicago office space constructed since 2002 was in urban and CBD areas (119 properties totaling 33.7 million square feet) and more than half of that was in the CBD itself. Likewise, Nashville, Tenn.; Minneapolis-St. Paul, Minn.; Birmingham, Ala.; and Milwaukee, Wis., followed similar lines with at least one-third of office space constructed in these markets being in urban and CBD areas. Notably, one-fifth of properties added to the Omaha office market were in its CBD. In total, 10 properties added nearly 3.2 million square feet to Nebraska’s largest city.
However, Cleveland and St. Louis saw far more suburban growth than urban. In fact, each city only constructed a single property in their respective CBDs — The PwC Pennant Building in St. Louis and the Cuyahoga County Administrative Building in Cleveland. Accordingly, 88% of office space constructed in St. Louis was in suburban areas, while that figure was 82% for Cleveland.

Clearly, suburban office development outpaced that of urban office development in the vast majority of markets across the country. Then, part of the campus-style suburban office created micro communities — which attracted other ancillary businesses to serve the workers, which attracted more businesses and development. Nevertheless, it’s hard to predict what the office environment will look like in the next 20 years, and the pandemic has only accelerated hybrid work schedules and remote working trends. Even so, there’s a chance that the landscape could look very different. Then again, real estate doesn’t change that rapidly and startups are seemingly everywhere — and more space is likely on the horizon.
Methodology
For this report, we compared all office properties completed since January 1, 2002, to the total completed office inventory on December 31, 2021.
Market inventories are highlighted based on the number of properties shown as “Completed” and the total amount of “Office Rentable Square Feet” incorporated in those properties.
Each market inventory is divided into location ratings (CBD-Primary, CBD-Secondary, Urban-Primary, Urban-Secondary, Suburban-Primary, and Suburban-Secondary). For the purposes of this article, primary and secondary locations were combined to focus only on CBD, urban, and suburban locations overall.
Square footage parameters: at least 25,000 square feet.
Regional differences feature the office inventory of 120 commercial markets.
Data extraction date: January 2022.
Want to see what other top office markets have to offer? Select any location from those linked below to check out the local listings!


Patrick McGregor
Patrick McGregor is a senior writer covering the real estate industry and overall economic trends in the United States for several Yardi product publications. He also holds an MBA from Thunderbird School of Global Management. Patrick was previously a commercial real estate analyst at Yardi Matrix for five years. His work has appeared in the New York Times, Bisnow, GlobeSt, The Real Deal, Business Insider, The Denver Post, The Motley Fool, and more.