Top 50 Office Sales of the Last 2 Decades


The years between 2000 and 2020 have proven to be quite eventful for the U.S. office market. The first decade started on the tail end of the dot-com bubble, which resulted in the boom and bust of an unprecedented real estate bubble. Then, the 2010s were marked by growth and consolidation, only to be capped by a global pandemic — the long-term effects of which remain uncertain. Nonetheless, the market continues to offer opportunities for those who can time their moves well and weather the occasional storm.
The last 20 years had a good share of trophy deals, which usually indicate strong market conditions. We used numbers provided by Yardi Research Data to review the top 50 office transactions between 2000 and 2020. Specifically, we looked at office buildings of at least 50,000 square feet and mixed-use properties that have more than 50% office space (for further details, read our methodology). In addition to our top 50 list, we also zoomed in to the regional level, reviewing major deals in the Northeast, Midwest, South and West, as well as best-selling Class B office spaces and properties less than 250,000 square feet in size.
Key takeaways:
- #1 U.S. office deal of 2000-2020: $2.8 billion sale of GM Building
- Priciest office outside NYC: $1.6 billion sale of Century Plaza in LA
- The #1 office sale of 2020 ranks 45th in the 20-year ranking at just under $1 billion
- Investor appetite for smaller office properties increased in 2019 and 2020
- Priciest Class B office buildings since 2000: $920 million for Starrett Lehigh Building
Keep reading to learn more about which U.S. office properties fetched top dollar in the past 20 years — both in and outside New York City.
Priciest Office Deal of the Last 20 Years: $2.8 Billion Sale of GM Building
New York City doesn’t just dominate the list of best-selling office buildings since 2000 — it also occupies the first 12 spots within the ranking. In fact, in terms of office deals outside of New York City, there are only 11 among the 50 entries — and more than half of those transactions represent portfolio deals. One such sale, the $1.64 billion Century Plaza portfolio in Los Angeles, is the highest ranking outside of New York City, reaching 13th place. Four Boston properties also made the list, led by 500 Boylston — sold in 2015 for $1.3 billion — and 222 Berkeley.
As far as the number of top sales recorded during each year, both 2006 and 2014 boast five entries. Other strong years in terms of number of sales of trophy offices include 2013 and 2016 — both of which featured four entries.
Meanwhile, in 2008, Boston Properties paid $4 billion to the Macklowe family for a portfolio that included four Midtown Manhattan office spaces. One of them, the General Motors Building at 767 5th Ave., raked in $2.8 billion to make it the #1 office deal in the U.S. since 2000. And, even before the New York commercial real estate market reached its feverish pre-crisis peak, the General Motors Building had previously sold for a hefty $1.4 billion in 2003 — landing it in 18th place for a second entry on the top 50 list.
Another office property that is featured twice in this ranking is the 1.4-million-square-foot News Corporation Building. Located at 1211 Avenue of the Americas and anchored by media giant Fox News, the property changed hands for $1.52 billion in 2006. Then, in 2013, Montreal-based Ivanhoe Cambridge acquired a 51% stake in the property for $855 million, enough to hand it the 50th position on the list.
Additionally, the Sony Tower at 550 Madison Ave. was acquired in 2013 for $1.1 billion by The Chetrit Group, which had plans to convert the 41-story high-rise into luxury condos. But, the plan was scrapped only three years later when Saudi conglomerate Olayan took ownership, paying $1.4 billion for the property.
Priciest Office Deal Outside NYC Since 2000: $1.6 Billion Sale of Century Plaza in Los Angeles
While the Northeast and Midwest are dominated by single-asset office sales, the majority of the top three office deals in the South and West are primarily portfolio sales. In particular, the three-building Century Plaza portfolio in Los Angeles is the largest among these. Encompassing 3.25 million square feet, it’s the #1 office deal in the West since 2000. The transaction closed in July 2014 when JP Morgan Asset Management acquired the properties for $1.6 billion.
Leading the list in the South, the Wilson Blvd. portfolio in Arlington, Va., sold for $1.26 billion in 2011. It’s followed by the State Street office portfolio in Richardson, Texas, which was acquired by Transwestern in 2016 for $825 million.
Meanwhile, in the Midwest, Blackstone paid $1.3 billion in 2015 to acquire the Willis Tower, which tops the 20-year list of best-selling office buildings in that region. A year before the sale of Willis Tower, another Chicago office space – located at 300 North LaSalle Drive – changed hands for $850 million.
Alternatively, considering the priciest office deals in the Northeast outside of New York City, all of the top three entries are occupied by Boston portfolio sales. Here, in 2015, 222 Berkeley Street and 500 Boylston Street went for $1.3 billion, while RMR forked over $1 billion for 11 Fan Pier Blvd. and 50 Northern Ave. in 2014.
Highest-Selling Office Space in 2020 Ranks 45th in Top 50 Sales of 2000-2020
Between 2005 and 2008, all three top office deals of each year carried price tags above the $1 billion threshold. The markets briefly readjusted in 2009, when the priciest office transaction was the more modest $590 million commanded by the 2-million-square-foot Worldwide Plaza. U.S. Office sales kicked back into high gear four years later and ushered in some of the highest office prices of the past 20 years.
Since 2013, deals above the $1 billion mark have become somewhat of a staple for top-ranking properties, with the occasional sales price even going as high as $2 to $3 billion. In particular, the sale of Chelsea Market in 2018 and 11 Madison Avenue in 2015 were the largest post-recession office transactions with price tags of $2.4 billion and $2.36 billion, respectively.
Notably, the former Coca-Cola Building at 711 5th Ave. changed hands twice within a month in 2019. It was initially acquired by Wafra Capital Partners for $909 million before being sold just a few weeks later to New York-based SHVO for $937 million. As such, these two rapid-fire transactions generated the highest average price per square foot ratio among top-selling buildings since 2000. More precisely, the 313,000-square-foot property averaged $2,900 per square foot for the first exchange and roughly $3,000 per square foot for the second.
So far, although none of the 2020 office transactions hit the $1 billion mark, the top three positions stuck close to the trend seen during previous years. German reinsurance giant, Munich Re bought 330 Madison Avenue for $900 million and SL Green fetched $810 million for the former Master Printers Building.
Swipe on mobile or use the slideshow left and right arrows to see details about the best-selling office properties each year since 2000.
[metaslider id=”27361″]Office Buildings Less Than 250,000 Square Feet Pique Investor Interest in 2019 & 2020
Before 2008, prices for office buildings less than 250,000 square feet remained under the $200 million mark. The first such office property to pass that dollar threshold was the 206,000-square-foot America’s Square. This Washington, D.C office space, located at 51 Louisiana Ave. NW, traded for $290 million in April 2008.
However, that sale came on the cusp of the financial crisis, and it wasn’t until 2012 that investors started showing a similar level of interest in assets like the 228,000-square-foot Candler Tower in New York City. The 23-story Manhattan office property was acquired by UK-based real estate company EPIC for $261 million – roughly $1,146 per square foot.
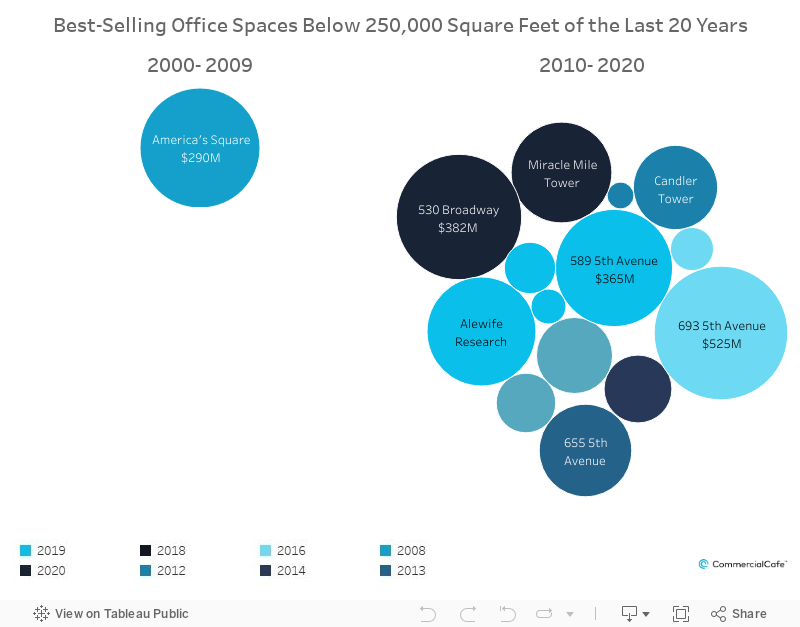
Following the post-recession recovery, the real estate market hit its first peak in 2015, eventually settling on a high plateau. While Chinese investment (the most prolific at the time among foreign investors) focused primarily on trophy assets in Manhattan, French holding company Firmalac forked over a whopping $525 million for 693 5th Ave. At roughly $5,400 per square foot, it was the highest price since 2000 for an office building of less than 250,000 square feet, as well as the first major pickup of the French holding company in New York City.
Since then, and especially throughout 2019 and 2020, six other smaller office properties sold for prices ranging between $230 and $380 million.
Priciest Class B Office Space Since 2000: $920 Million for Starrett Lehigh Building
Throughout the decades, the alternating popularity of urban and suburban offices has provided many opportunities for savvy developers with an eye for ideally located Class B properties. To that end, a recent study by CommercialCafe on office building renovations in the last two decades revealed a steady increase since 2012 in the number of projects undertaken to breathe new life into aging assets. Accordingly, we can then observe an increase in the number of top-selling Class B office properties in the last decade, when compared to the pre-crisis period.
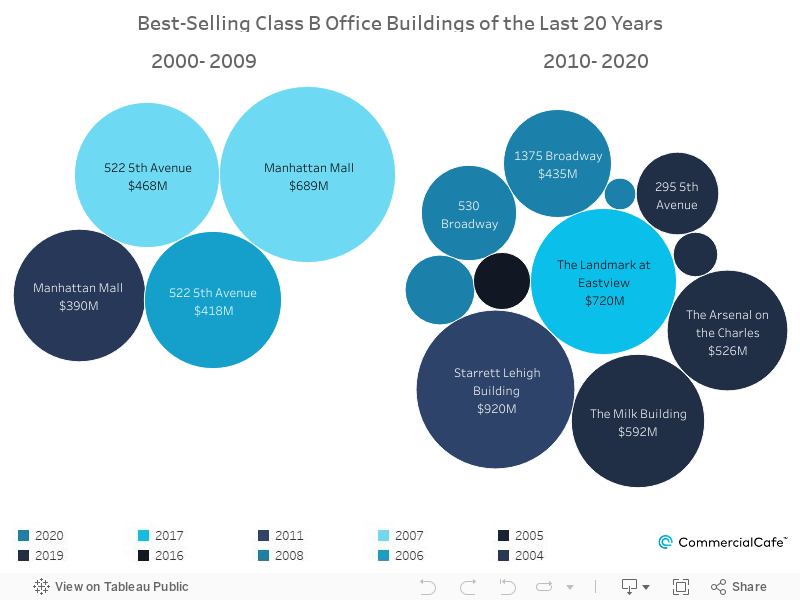
Notice that even the lowest entry among the top 15 Class B office sales — the 423,000-square-foot Miracle Mile Tower in Los Angeles — breaks the $300 million mark. Furthermore, this ranking is also firmly dominated by New York City properties. Only four buildings outside of New York City make the cut — with the $720 million sale of the Landmark at Eastview in Tarrytown, N.Y., in third place, and the $525 million sale of the Arsenal on the Charles in Waterfront, Mass., in sixth place among the higher ranking.
By far, the Starrett Lehigh Building at 601 West 26th St. in New York City is the #1 Class B office sale of the last 20 years. In 2011, it traded for $920 million — landing in 42nd place in the top 50 — when RXR Realty bought the 19-story property from Shorenstein. Since then, the building has undergone a series of renovation programs, including an effort to replace 5,000 steel-framed, continuous “ribbon-style” windows with various energy-efficient, aluminum-framed units; expanding and upgrading its lobby, common areas and gym; and converting its ground floor into retail space. Meanwhile, the entire neighborhood in which the property is located has also been going through important changes in recent years. To the north, Related Companies’ Hudson Yards massive development is ongoing, while the 34th St.-Hudson Yards station of the 7 Subway Extension finally opened in 2018 after a series of delays.
Need a reliable and up-to-date listings platform that grants you access to the most sought-after office solutions throughout the U.S.? Explore thousands of properties by location, size or price to find the best fit for your business:
Methodology
We based this analysis on Yardi Research Data sales data recorded up until January 6, 2021. Transactions included were those between January 1, 2000, and December 31, 2020. For this report, we considered office properties of at least 50,000 square feet.
Yardi Research Data relies on recorded dates for its sale prices. However, for the purposes of this study, an exception was made for the Master Printers Building. Since that transaction was closed just before the end of 2020, we used the sign date on the document, instead of its recorded date.
We counted portfolio deals as single transactions and only analyzed portfolio sales of buildings that were part of the same campus or property, and that shared the same transaction terms.
Where the previous purchase was a partial stake deal, only the majority stakeholder is shown.
In the case of mixed-use assets, only properties with more than 50% office space were considered.
We excluded distressed sales.
Regional lists were compiled according to the U.S. Census Bureau’s map of regions and divisions of the United States.
For buildings less than 250,000 square feet and Class B buildings, only single-building transactions were included.
The Wilson Blvd. Portfolio includes: 1000 Wilson Blvd., 1100 Wilson Blvd., 1101 Wilson Blvd., 1200 Wilson Blvd., 1401 Wilson Blvd., 1501 Wilson Blvd., 1515 Wilson Blvd., 1400 Key Blvd. & 1701 North Fort Myer Drive in Arlington, Va.
The Vertex Buildings Portfolio includes: 11 Fan Pier Blvd. & 50 Northern Ave. in Boston, Mass.
The East Rio Salado Portfolio includes: 300 East Rio Salado Pkwy., 400 East Rio Salado Pkwy., 450 East Rio Salado Pkwy., 500 East Rio Salado Pkwy. & 600 East Rio Salado Pkwy. in Tempe, Ariz.
The Century Plaza Portfolio includes: 2000 Avenue of the Stars, 2029 Century Park East and 2049 Century Park East in Los Angeles.
The Rockefeller Center Portfolio includes: 1 Rockefeller Plaza, 10 Rockefeller Plaza, 30 Rockefeller Plaza and 50 Rockefeller Plaza; 1230 Avenue of the Americas and 1270 Avenue of the Americas; and 600 5th Ave., 610 5th Ave., 620 5th Ave. and 630 5th Ave. in New York City.
The John Hancock Office Portfolio includes: 197 Clarendon Street, 200 Clarendon Street and 200 Berkeley Street in Boston, Mass.


Diana Sabau
Senior Content Writer, CRE News & Market Analysis
Drawing on years of intense research in the U.S. commercial real estate market at Yardi Matrix, Diana now applies her expertise as a writer for the CommercialCafe blog. Her articles focus on CRE investment, labor market trends, and technology, and have been picked up by prestigious publications including the New York Times, GlobeSt, The Real Deal, NAIOP, MSN, and Bisnow.