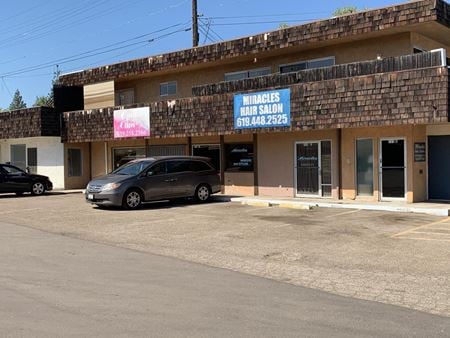
El Cajon, CA Commercial Real Estate for Lease and Sale
Explore 44 listings of El Cajon commercial real estate to find the best space for your business.
-
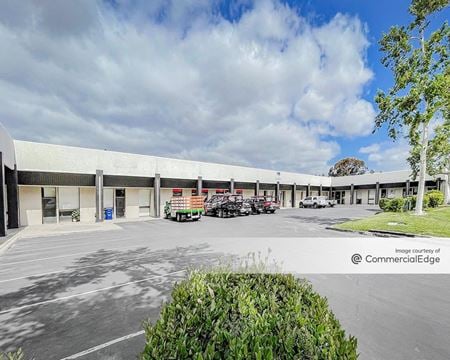 1452 Fayette Street, El Cajon, CAProperty
- Industrial
- 34,600 SF
Availability- 3 Spaces
- 6,918 SF
Year Built- 1975
For Lease- $1.75/SF/MO
-
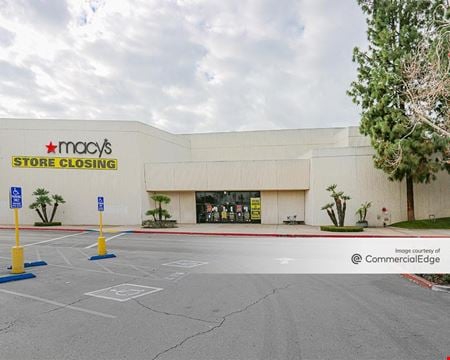 291 Fletcher Pkwy, El Cajon, CAProperty
- Retail
- 115,612 SF
Availability- 2 Spaces
- 119,000 SF
Year Built- 1974
For Lease Contact for pricing -
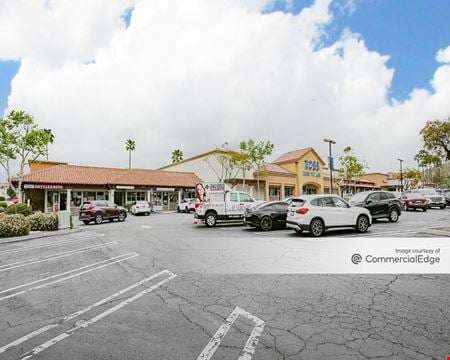 2520 Jamacha Road, Rancho San Diego, El Cajon, CAProperty
- Retail
- 98,316 SF
Availability- 2 Spaces
- 4,910 SF
Year Built- 1994
For Lease Contact for pricing -
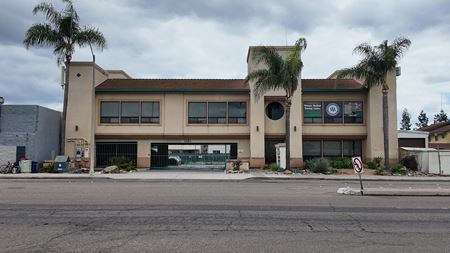 1161 E Main St, El Cajon, CAProperty
- Office
- 6,416 SF
Availability- 4 Spaces
- 7,350 SF
Year Built- 1992
For Lease- $2.25/SF/MO
-

What type of listing property are you looking for?
-
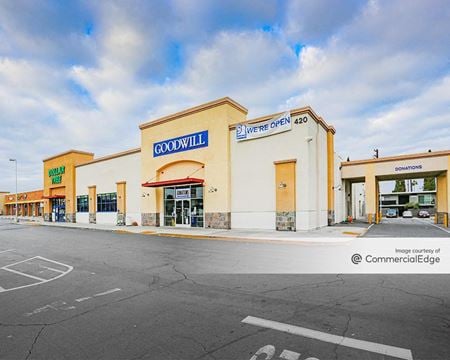 328 North 2nd Street, El Cajon, CAProperty
- Retail
- 52,900 SF
Availability- 2 Spaces
- 2,250 SF
Year Built- 1965
For Lease Contact for pricing -
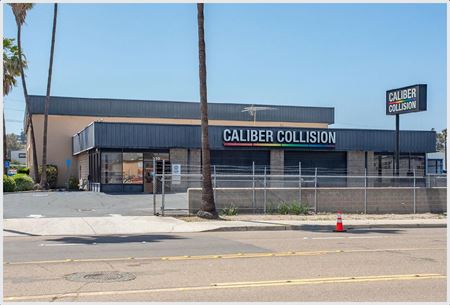 332 North Johnson Avenue, El Cajon, CAProperty
- Retail
- 15,877 SF
Availability- 1 Space
- 15,877 SF
For Lease- $1.75/SF/YR
-
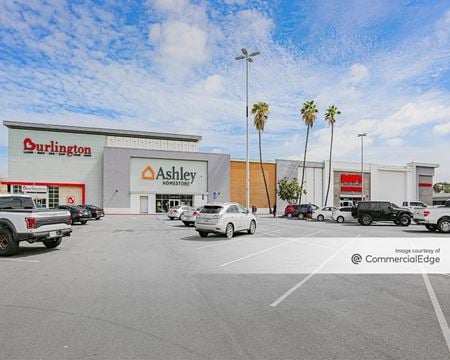 575 Fletcher Pkwy, El Cajon, CAProperty
- Retail
- 116,366 SF
Availability- 1 Space
- 4,183 SF
Year Built- 1974
For Lease Contact for pricing -
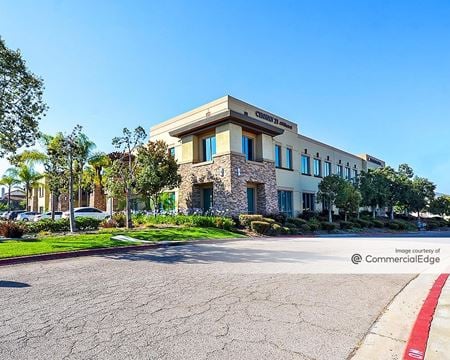 1530 Hilton Head Road, Rancho San Diego, El Cajon, CAProperty
- Office
- 40,223 SF
Availability- 1 Space
- 7,149 SF
Year Built- 2000
For Lease- $2.75/SF/MO
-
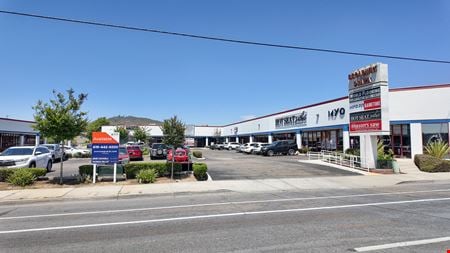 1220 -1224 Broadway, El Cajon, CA
 -
723 Est Bradley Avenue, Bostonia, El Cajon, CAProperty
- Retail
- 14,126 SF
Availability- 1 Space
- 1,350 SF
Year Built- 1960
For Lease- $1.09/SF/MO
-
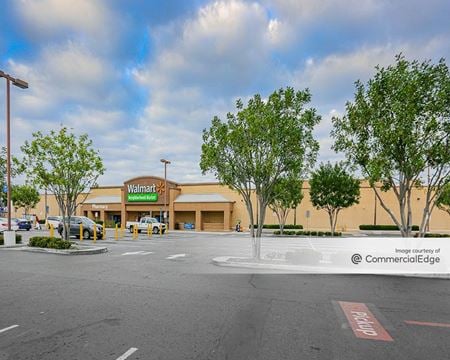 152-300 N. 2nd St., El Cajon, CAProperty
- Retail
- 75,378 SF
Availability- 1 Space
- 2,027 SF
Year Built- 1966
For Lease Contact for pricing -
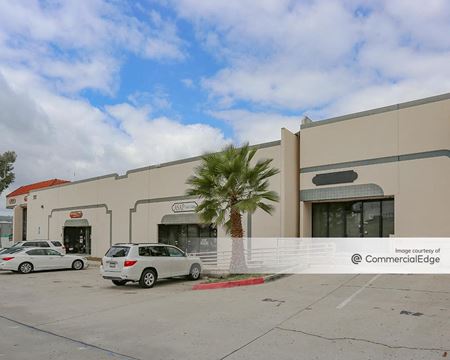 208 Greenfield Drive, Bostonia, El Cajon, CAProperty
- Industrial
- 95,846 SF
Availability- 7 Spaces
- 14,335 SF
Year Built- 1989
For Lease- $1.70 - $20.40/SF/YR
-
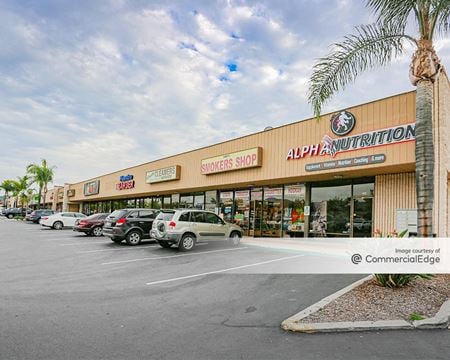 518 Jamacha Road, El Cajon, CAProperty
- Retail
- 113,935 SF
Availability- 1 Space
- 1,100 SF
Year Built- 1959
For Lease Contact for pricing -
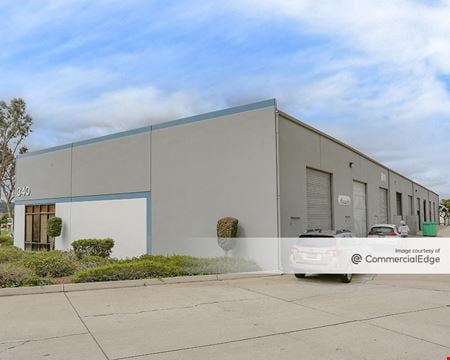 340 Vernon Way, El Cajon, CAProperty
- Industrial
- 59,200 SF
Availability- 1 Space
- 3,650 SF
Year Built- 1985
For Lease- $1.60/SF/MO
-
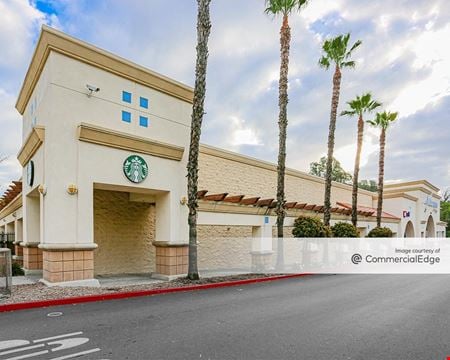 1608 Broadway, El Cajon, CA
 -
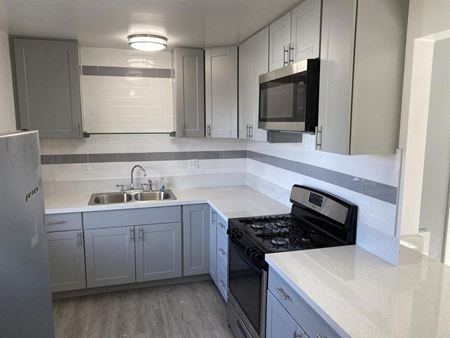 1011 El Cajon Blvd, El Cajon, CAProperty
- Other
- 6,400 SF
Year Built- 1952
For Sale- $2,750,000
-
 1304 Pepper Drive, Granite Hills, El Cajon, CA
 -
 819 Jamacha Rd, El Cajon, CA
 -
 395 North Johnson Ave, El Cajon, CAProperty
- Industrial
- 2,285 SF
Availability- 1 Space
- 2,285 SF
For Lease- $1.63/SF/MO
-
 669 S Mollison Ave, El Cajon, CAProperty
- Retail
- 9,100 SF
Availability- 2 Spaces
- 1,965 SF
For Lease- $30.00/SF/YR
-
 1437 E Main St, El Cajon, CAProperty
- Retail
- 4,560 SF
Availability- 1 Space
- 4,560 SF
Year Built- 1996
For Lease Contact for pricing -
 2812 Fletcher Pkwy, El Cajon, CAProperty
- Retail
- 145,372 SF
Availability- 3 Spaces
- 7,786 SF
Year Built- 1974
For Lease Contact for pricing -
 650 N Mollison Ave, El Cajon, CA
 -
 1360 Magnolia Ave, Bostonia, El Cajon, CAProperty
- Retail
- 16,634 Acre
Year Built- 1982
For Sale- $7,911,000
-
 1360 North Magnolia Avenue, Bostonia, El Cajon, CA
 -
 1830 John Towers Ave, El Cajon, CAProperty
- Industrial
- 24,000 SF
Year Built- 1985
For Sale- $5,100,000
-
 Jamacha Rd. & Fury Lane, Rancho San Diego, El Cajon, CA
 -
 1000 W. Bradley Avenue, El Cajon, CAProperty
- Industrial
- 6,000 SF
Availability- 1 Space
- 6,000 SF
For Lease- $1.49/SF/YR
-
 1240 Lyons Ln, Bostonia, Santa Ana, CAProperty
- Office
- 2,400 SF
Availability- 1 Space
- 2,400 SF
Year Built- 1970
For Lease- $3,600.00/SF/YR
-
 985 E. Main Street, El Cajon, CA
 -
 315, El Cajon, CA
 -
 185 W Madison Ave, El Cajon, CAProperty
- Office
- 4,392 SF
Availability- 1 Space
- 4,392 SF
Year Built- 1962
For Lease- $2.50/SF/MO
-
 1196 East Main Street, El Cajon, CAProperty
- Retail
- 29,984 SF
Availability- 1 Space
- 8,460 SF
Year Built- 1973
For Lease- $2.00/SF/MO
-
 270 East Douglas Avenue, El Cajon, CA
270 East Douglas Avenue
East County Biz CenterServices- Virtual Office
- Meeting Room
- Private Office
Amenities -
 250-280 E Chase Ave, El Cajon, CAProperty
- Office
- 15,193 SF
Availability- 1 Space
- 2,100 SF
Year Built- 1988
For Lease- $2.30/SF/YR
-
 701 W Main St, El Cajon, CAProperty
- Industrial
- 8,100 SF
Availability- 1 Space
- 8,100 SF
Year Built- 1965
For Lease- $1.50/SF/MO
-
 1150 Broadway, El Cajon, CAProperty
- Office
- 356 SF
Availability- 1 Space
- 356 SF
Year Built- 1990
For Lease- $800.00/MO
-
 310 S Anza St, El Cajon, CAProperty
- Multi-Family
- 22,251 SF
Year Built- 1991
For Sale- $8,750,000
-
 165 Denny Way, Bostonia, El Cajon, CAProperty
- Industrial
- 44,748 SF
Availability- 1 Space
- 24,026 SF
Year Built- 1986
For Lease- $1.35/SF/MO
-
 638 El Cajon Blvd, El Cajon, CA
 -
 1588 North Marshall Ave, El Cajon, CAProperty
- Industrial
- 86,578 SF
For Sale- $23,000,000
-
 1291-1299 E. Main St., El Cajon, CA
 -
 2990 Jamacha Road, Rancho San Diego, El Cajon, CAProperty
- Retail
- 44,485 SF
Availability- 4 Spaces
- 5,928 SF
Year Built- 1988
For Lease Contact for pricing -
 1324 E. MAIN STREET, El Cajon, CA
