
The handwringing over the latest exploits, likes and dislikes of millennials has become somewhat of a national sport. Some of the observations are the result of generational rivalry rather than insights into wide-ranging trends. Still, it’s essential to recognize that—given their sheer numbers—anything millennials do is likely to have a significant influence on the daily lives of Americans.
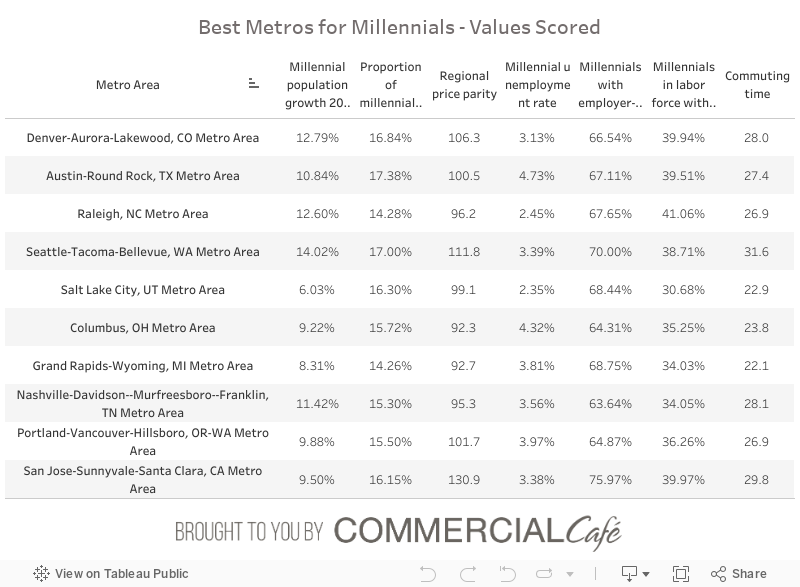
Millennials currently make up the largest segment of the U.S. labor force. As such, any migration patterns—whether between rural and urban areas, downtown and suburbia, or metro-to-metro—will boost the talent pool of those on the winning side. CommercialCafe set out to determine the most attractive metro areas for this age group, by measuring performance across seven indicators:
- Millennial population growth between 2014-2018
- Proportion of millennials in the overall population
- Regional price parity
- Millennial unemployment rate
- Percentage of millennials in the labor force, with a bachelor’s degree
- Percentage of millennials with employer-based health insurance
- Commuting times
This research focuses on demographic and economic metrics but also recognizes that several other factors contribute to the perceived quality of life in each location. For instance, a wide array of personal preferences can greatly influence an individual’s choice of living in a particular metropolitan area, such as the climate, geography, urban density, air quality, public transportation options, the local food, entertainment, and sporting scene.
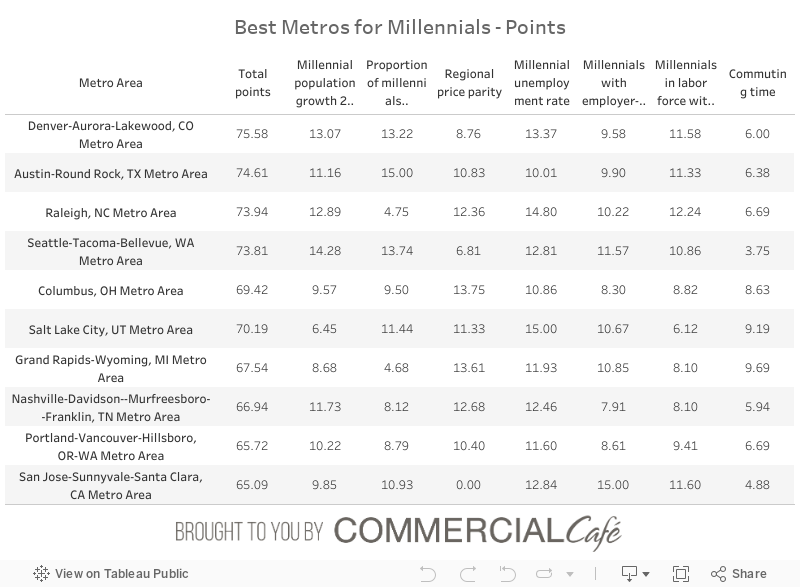
For more information about our analysis, check out the methodology section. The map below highlights the top 10 metro areas for millennials, according to this study.
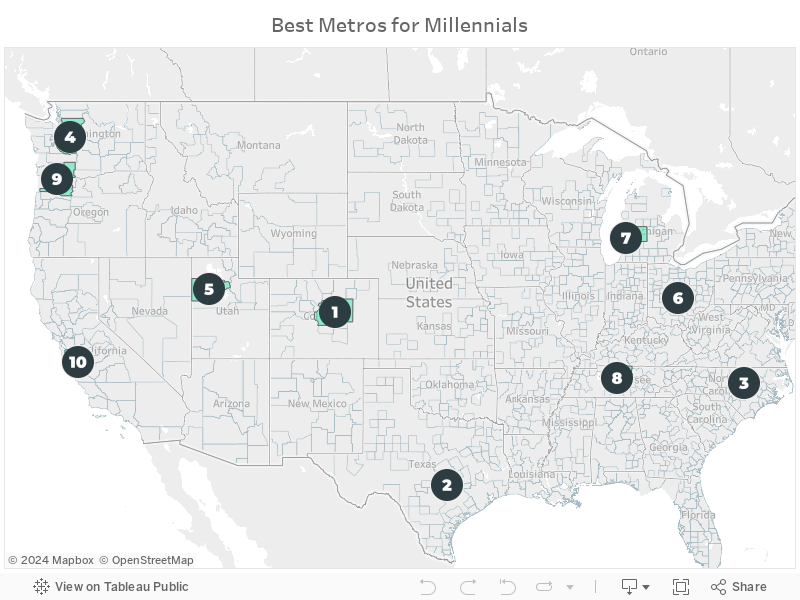
At the top of the list, the Denver-Aurora-Lakewood metropolitan statistical area (MSA) increased its number of millennial residents by 13% between 2014 and 2018, and leads the pack with 75.5 points; it’s followed by Austin-Round Rock and Raleigh. Keep reading for more highlights about each metro’s strong points.
Midwestern & Southern Metro Areas Win for Lower Costs of Living
When analyzing the rankings across the seven indicators, it’s evident that the top spots for each are spread out pretty evenly. While all of these locations attract millennials, they have different strong points; some perform around or above average across most metrics, while others do exceptionally well in a couple of them.
Take Salt Lake City, for example. Among the 10 metros on the list, it has the lowest unemployment rate for its millennial residents—roughly 2.4% according to 2018 U.S. Census Bureau estimates. Salt Lake City also has the second-best mean commute time at just under 23 minutes. However, the Portland-Vancouver-Hillsboro metro area displays a different pattern. Its best score is its fourth-place ranking in terms of its commute time, with all other metrics just slightly below the list-wide average.
While the Denver-Aurora-Lakewood area gathered the highest score overall, it didn’t land in the first position for any of the individual indicators.
Seattle-Tacoma-Bellevue heads the list for the highest growth in millennial population among the metro areas, having increased its population of 25 to 34 years old by 14% between 2014 and 2018. Millennials make up 17.4% of the Austin-Round Rock metropolitan area’s roughly 2.2 million residents. The most recent Census records estimate that there are currently 376,940 residents within the 25-34 age group, an 11% increase in the last four years.
Two Midwest metro areas—Columbus and Grand Rapids-Wyoming—received top points for their regional price parity. This indicator is determined by comparing the average cost of goods and services in a given region to the national average, set to 100 points. At 92 and 93 points, respectively, Columbus and Grand Rapids-Wyoming offer significantly lower costs of living than some of the other entries in the top 5, such as Nashville, Raleigh, and Salt Lake City. The Grand Rapids metro area also received the highest score for having the shortest mean commute time of the ten entries (22 minutes).
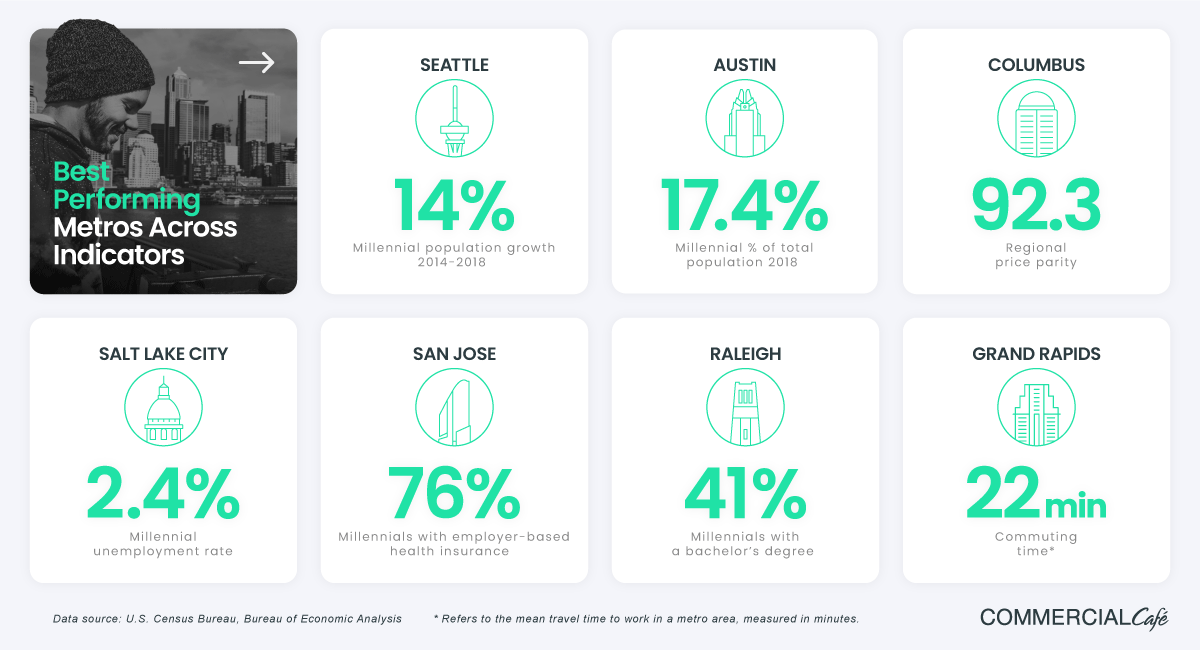
As far as millennial unemployment, Salt Lake City has the lowest level-alongside Raleigh, which also ranks number one for the percentage of millennials with a bachelor’s degree-roughly 41%. San Jose-Sunnyvale-Santa Clara has the highest rate of workers between the ages of 25-34 years old who have employer-based health insurance—roughly 76%—followed by Seattle-Tacoma-Bellevue and Grand Rapids-Wyoming—with 70% and 69%, respectively.
It’s also important to note that while some metros might rank relatively low in terms of absolute values, conditions on the ground and the local context might alter how they perform for that specific indicator.
For instance, a longer commute in Austin-Round Rock may mean something different for relocating young workers than it would for those in an area like the Seattle-Tacoma-Bellevue metro—which has invested in its infrastructure and public transportation, including bike lanes and improved walkability.
Although the former has a better average commute time, moving around Austin-Round Rock is heavily dependent on car ownership. As a result, the lack of public transportation options creates a significant additional expense, as well as the likelihood of increased congestion and commuting times as the metro population continues to grow.
The diversity of local coworking market can also factor in, as it allows many Milennials to conduct their business remotely, thus rendering commute times irrelevant in terms of their relocation decision. And by accessing CommercialCafe.com, young professionals can explore various coworking spaces within their city or wider metro area.
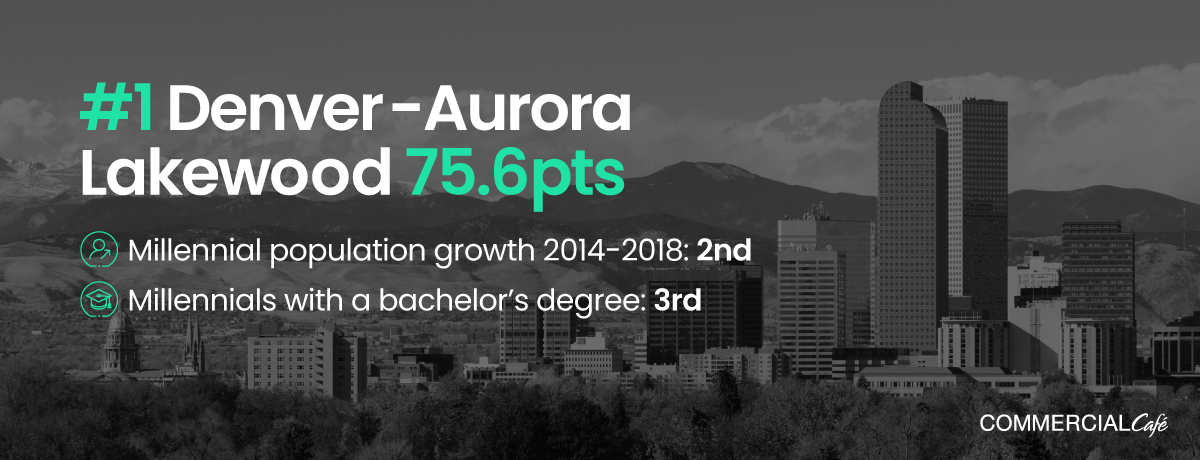
The Denver-Aurora-Lakewood MSA performed particularly well for its millennial population growth, the proportion of millennials from the overall number of residents of a metro area, and the low unemployment rate for workers within this age group. Each of these metrics gathered roughly 13 out of 15 points.
In particular, between 2014 and 2018, the area’s total population grew by 6.5%—going from 2.7 million to 2.9 million. Approximately 17% of these new residents were 25 to 34 years old; this means that in four years, the metropolitan area’s millennial population jumped by 13%. The only other MSA on the list that had a higher growth rate during the studied period was Seattle-Tacoma-Bellevue, with a 14% increase.
Furthermore, in 2018, the unemployment rate for millennials here was only 3%—the third-lowest value among the ten entries—behind Salt Lake City and Raleigh metro areas. Roughly 40% of millennials who are part of the labor force here have a bachelor’s degree diploma, and 66.5% have health insurance through their employer.
The Denver-Aurora-Lakewood metropolitan area also has a mean commute time of 28 minutes, ranking seventh on our list. However, it’s only six minutes longer than the Grand Rapids-Wyoming MSA value, which garnered the highest score for this indicator. As such, millennials looking for the quickest commute into Denver might choose to move to nearby towns such as Englewood or Littleton. Or, they might consider Northglenn—one of the city’s newest suburbs—which is also one of the more affordable options in terms of housing.
Finally, millennials looking for job opportunities can expect increasing numbers of employment prospects within metro Denver’s 37 opportunity zones. Passed as part of the Tax Cuts and Jobs Act of 2017, these tax incentives aim to attract long-term investments from businesses, private and institutional investors, hedge funds, or real estate investment trusts (REITs). There are already a couple of projects under construction, including Synergy Medical—a 102,000-square foot medical office building in Englewood—and World Trade Center Denver—which will consist of a 240-room hotel and conference center and a 350,000-square foot office tower.

Salt Lake’s millennial population growth has been rather modest, compared to the other metros on the list. Between 2014 and 2018, it rose by 6%, but although it is the lowest percentage increase, this metro area has the fourth-highest proportion of millennials of its overall population—at roughly 16%. The state of Utah also has the highest percentage of people between the ages of 25 and 34 in the nation;726,000 people, or one in every four Utahns is a millennial.
Unemployment rates for young people here are the lowest on our list—only 2.4%, according to the latest Census data. Within the city, the pace of job growth is three times the national average, and household incomes outpaced overall U.S. averages twice-over in 2018. For those weary of long commuting times, the Salt Lake City metropolitan area has the second shortest commute times among the ten entries, with an average of 23 minutes.
The cost of living is also lower than the national average, with a price parity of 99 points. According to a LendingTree study, millennials in Salt Lake City are more likely to pursue homeownership than those living in any of the nation’s other metro areas. Roughly 51% of purchase requests in Salt Lake City come from residents between the ages of 25-34.
The region has attracted many large companies—from Adobe to eBay and Microsoft—and a reputation as Utah’s Silicon Valley (lovingly dubbed, “Silicon Slopes”). The vibrancy of the local business environment has also driven demand for coworking spaces in Salt Lake City, with national and local operators eager to supply flexible workspace options.
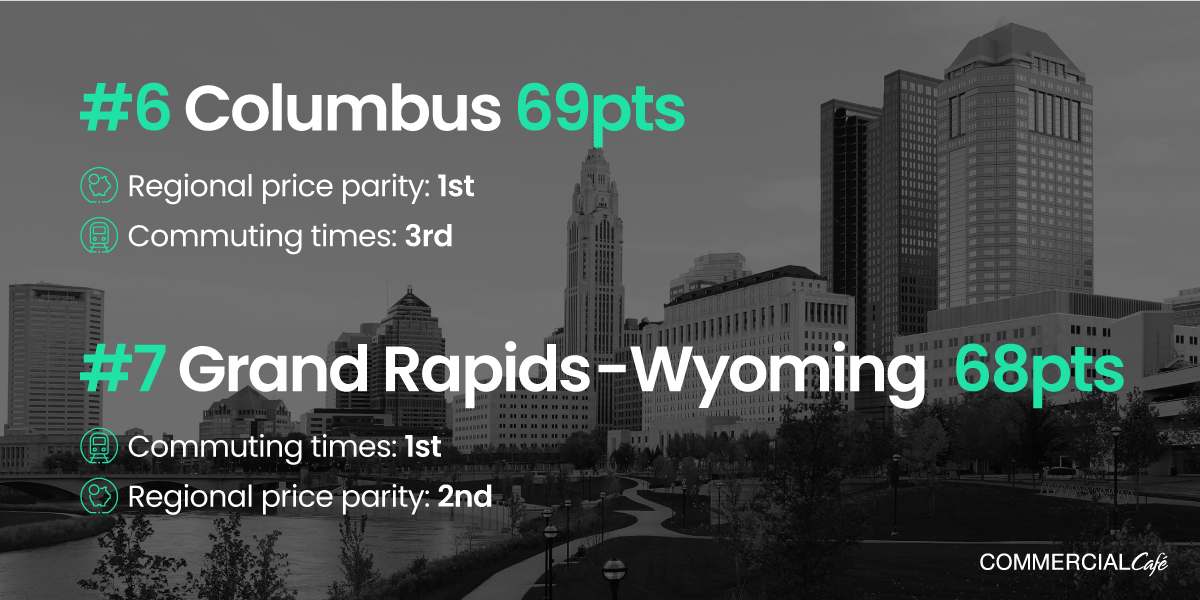
Two Midwestern metro areas made our list. The Columbus metro area received 69 points as the sixth most attractive entry for millennials, closely followed by Grand Rapids-Wyoming in seventh place with roughly 68 points.
Columbus’ strong points include the best regional price parity—92 points—and the third shortest commute time among the ten metros—at 24 minutes. Grand Rapids-Wyoming outperforms its Midwest contender in terms of mean commute times, and also ranks second best for the cost of living—with 93 points—and third for the percentage of millennials with employer-based health coverage.
Notably, America’s former manufacturing cities may be making a comeback, and the most successful of these have become magnets for millennials. In fact, in a recent CommercialCafe study, Grand Rapids ranked number one with strong performances in its poverty reduction and increase in its percentage of millennial residents. Columbus made the top 5, boasting high educational attainment levels of its active workforce and acting as the Midwest’s venture capital hub.
Like many metropolitan areas in the Midwest, Grand Rapids-Wyoming has invested in its healthcare and pharmaceutical industry. Companies such as Perrigo, Mercy Health or Spectrum Health—a top employer in West Michigan with around 31,000 people working in its hospitals, clinics and urgent care facilities—are particularly active in the region.
Columbus is consistently listed as one of the best places for startups and tech businesses. For instance, coworking spaces in Columbus cost entrepreneurs, on average, less than 3% of the median income to rent. What’s more, in 2018, the survival rate for startups with less than five employees was roughly 65%. Home to one of the largest venture capital funds in the Midwest, Columbus has the money to back some of these entrepreneurial ambitions. Millennials working in the Columbus metro area can seek jobs in a diverse range of industries—from tech to brewing, manufacturing, retail, or e-commerce.
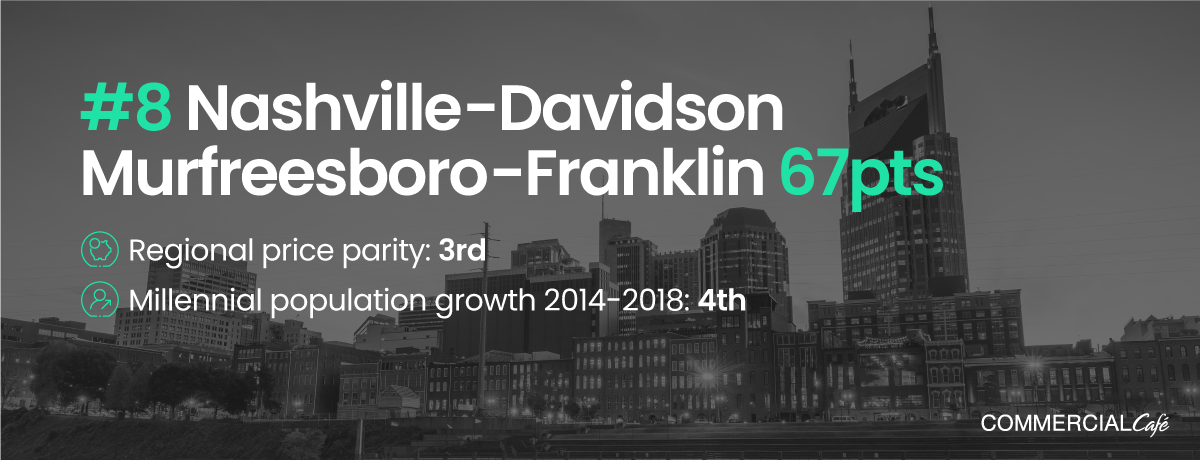
Between 2014 and 2018, the number of residents between the ages of 25 and 34 in the Nashville-Davidson-Murfreesboro-Franklin metropolitan area grew by 11.4%; now millennials make up about 15% of the region’s overall population.
Regional price parity here is five points below the national average, and the unemployment rate for young workers was 3.6% in 2018. While it ranked fairly low for commute times, Nashville metro is still below the 30-minute mark, with a mean travel time of 28 minutes.
The year 2018 was a particularly exciting one for this Tennessee metro area. Amazon rolled out plans to create 5,000 jobs in Nashville—part of its new Operations Center of Excellence—making this the single largest job announcement in the state’s history. The online seller planned to inject $230 million in private capital into the new hub, opening up positions with average earnings of $150,000 a year. The same year, global accounting firm EY began preparations for a $22 million investment in a new Exceptional Delivery Growth Engine Center, with a goal to bring 600 jobs to the area.
With so many big names having a presence in the region, the demand for office space in Nashville has also been steadily increasing. Explore listings in this area and all major U.S. markets with CommercialCafe:
However, millennials interested in living and working in the Nashville metropolitan area should move fast because the number of homes—especially the more affordable ones—is dropping as the residential market heats up. According to Zillow, home prices have shot up 87% over the last five years. With more than 300,000 people in the region about to reach their home-buying years, demand will likely continue to be strong.
Methodology
To define the Millennial cohort, we used the 25-29- and 30-34 age groups, as defined by the U.S. Census Bureau.
Points for all indicators were distributed directly proportional to their value, except for the regional price parity and the commuting time indicators, for which points were awarded in inverse proportion. Entries could gather a maximum of 100 points.
“Millennial population growth” refers to the relative difference in each metropolitan area’s Millennial population from 2014 through 2018, according to U.S. Census Bureau data. Values scored represent the change in the millennial population in five years. The maximum weight for this metric is 15 points.
“Proportion of millennials” represents the percentage of millennials of each metropolitan area’s total population, based on the latest available U.S. Census Bureau data. The values scored are 2018 demographic percentages. The maximum weight for this metric is 15 points.
“Regional price parity” (RPP) measures the cost of living in a region by comparing it to a national average, conventionally set at 100. Areas with high/low RPPs typically correspond to regions with high/low price levels for rents. In addition to housing costs, RPPs also cover all consumption goods and services. Values scored are the 2017 Bureau of Economic Analysis numbers. The maximum weight for this metric is 15 points.
“Millennial unemployment rate” highlights the percentage of millennials unemployed and actively searching for a job. This indicator is obtained by dividing the population of unemployed 25- to 34-year-olds, with the overall millennial population within the labor force. Values scored are 2018 U.S. Census Bureau demographic percentages. The maximum weight for this metric is 15 points.
“Millennials with employer-based health insurance” measures the percentage of millennials covered by an employment-based health insurance plan. Values scored are 2018 U.S. Census Bureau demographic percentages. The maximum weight for this metric is 15 points.
“Millennials in the labor force with a bachelor’s degree” is the percentage of individuals between the ages of 25 to 34, who are active within the labor force, and have a bachelor’s degree. Values scored are 2018 U.S. Census Bureau demographic percentages. The maximum weight for this metric is 15 points.
“Commuting time” refers to the mean travel time to work in a metro area, measured in minutes. Values scored are 2018 U.S. Census Bureau estimates, for all means of transportation available in a given region. The maximum weight for this metric is 10 points.
We excluded metropolitan areas with less than 1 million residents.